
Nyheter
More TradFi Players Step in To Solve Pain Points in Crypto, What’s Next?
Inflation in the U.S. rose by 3.2% from a year ago in July, still higher than the Federal Reserve’s ideal 2% rate. Bitcoin and Ethereum barely moved in response, increasing a little below 1% each over the past week. The biggest gainers this week were Solana (+9%), Uniswap (+6.83%), and Maker (+2.77%). The latter was the frontrunner in assets under management, accruing 16.52% more than last week. Maker’s surge in total value locked (TVL) can be attributed to the savings rate hike on DAI from 3% to 8%, making it one of the highest yields currently offered by a major stablecoin issuer.
Figure 1: Weekly Price and TVL Developments of Cryptoassets in Major Sectors
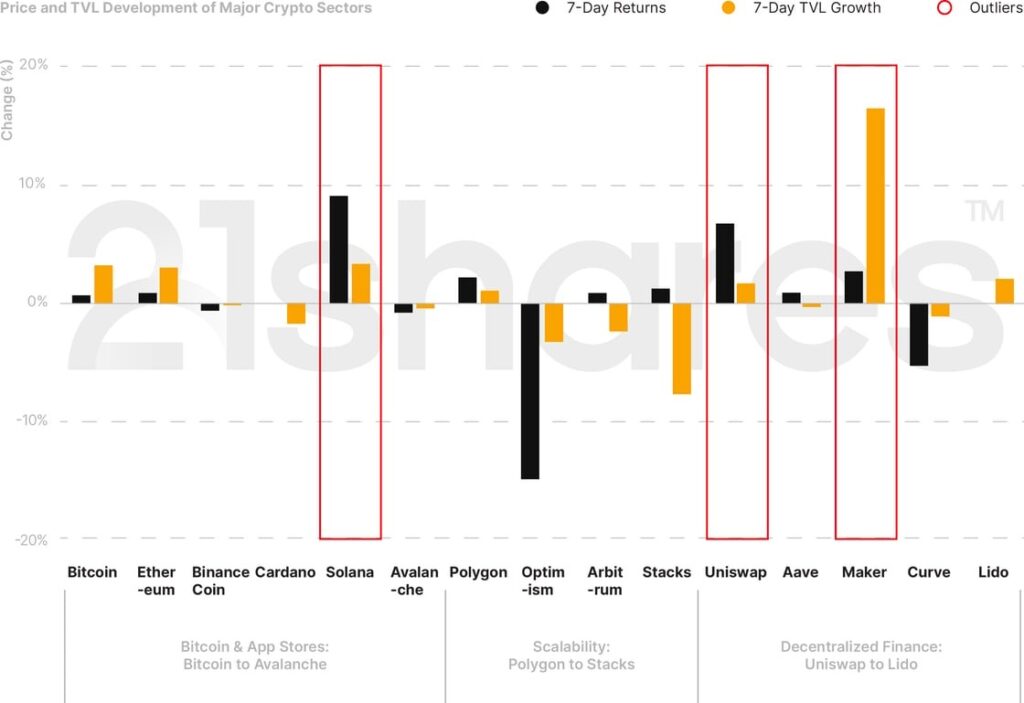
Source: 21Shares, CoinGecko, DeFi Llama. Close data as of August 14, 2023.
3 Things to Remember in Markets this Week:
• The Federal Reserve Prepares for Inevitable Stablecoin Adoption
As traditional players begin entering the stablecoin market, the Federal Reserve Board (FRB) announced a program to supervise the “novel activities” the banks under its jurisdiction are carrying out. The FRB has also provided guidance on the process a state bank needs to follow before engaging in stablecoin activities. State banks will require a written supervisory non-objection from the FRB before issuing, holding, or transacting in stablecoins. This comes a day after PayPal announced its launch of a fully-backed, dollar-pegged stablecoin, PYUSD, with Paxos, built on Ethereum, with zero transaction fees. PayPal expects its PYUSD to be used primarily in decentralized finance and remittances, leveraging its position as a leader in the online payments market with a 40.52% market share. While it’s still too early to tell whether PayPal’s venture into crypto will level up to its success in traditional finance, steady progress should be guaranteed, given the company’s regulatory and adoption advantages.
Figure 2: Total Supply of Stablecoins on Ethereum
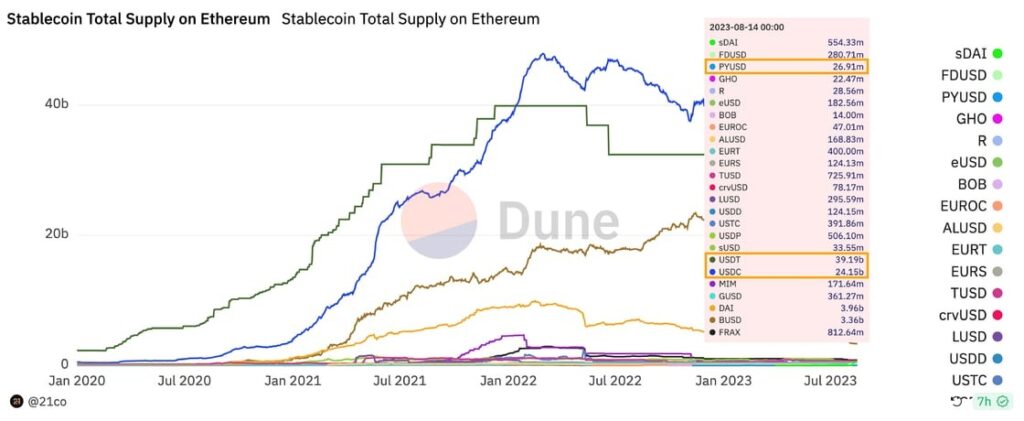
Source: @21co on Dune Analytics
• Visa’s Pilot Trial to Simplify Transacting On-Chain
After Visa initially announced their experiment utilizing Account Abstraction (AA) to streamline crypto native payments on top of Ethereum back in May, the financial services giant revealed the piloted project’s latest updates. Namely, leveraging the ERC-4337 standard, more commonly known as AA, Visa was able to abstract the process of paying gas fees in ETH using a credit card. As AA allows for the asset conversion to take place in the backend, users will not have to worry about holding the right native token to pay for transaction costs. Thus, users would be met with the flexibility of paying with their cards or any other ETH-based token, and the AA smart contract will simply trigger the conversion via what’s known as a paymaster smart contract that sponsors transactions on users’ behalf. That said, Visa’s experiment has the power and potential to transform the crypto native ecosystem and make them more accessible using the average users’ traditional financial instruments and could, thus, catalyze the adoption of native blockchain applications without users necessarily becoming aware of the technical intricacies.
Figure 3: Visa’s Process to Abstract ETH Gas Fees
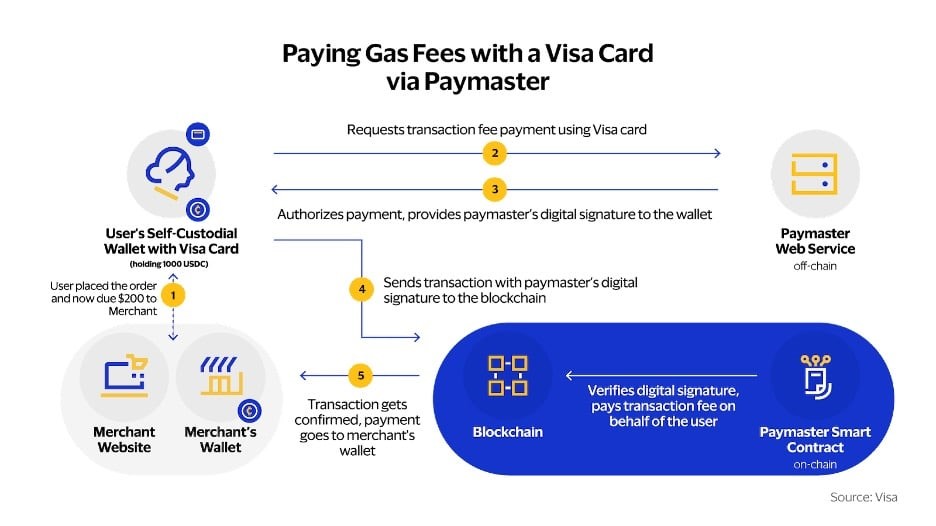
Source: Visa
• Fantom Considering a Return to Ethereum
Fantom is contemplating a strategic move to enhance its integration with Ethereum by establishing an optimistic-based rollup linking the two networks. While Fantom boasts crucial innovations like sharding and sharing gas costs with developers, its growth trajectory faced obstacles following the MultiChain bridge hack, resulting in a significant decline in assets and liquidity. Notably, the past month witnessed the closure of the two largest lending and exchange applications due to challenges within the network and decreasing liquidity. Thus, the decision is aimed at helping Fantom seek recovery by positioning itself as a scaling solution for Ethereum, leveraging its unparalleled user base and liquidity. This trend is not exclusive to Fantom, as Celo also recently announced a similar shift, indicating an emerging industry trend.
Figure 4: Total Assets Under Management on the Fantom Blockchain
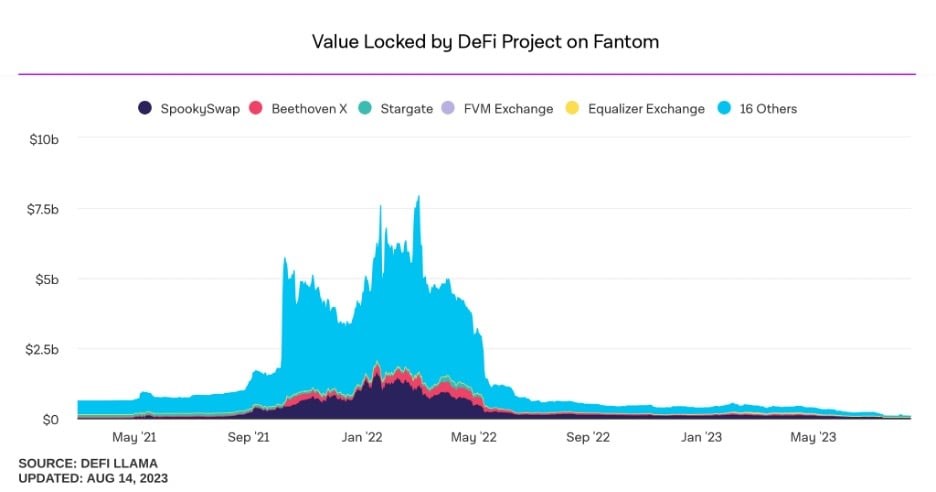
Source: DeFi Llama, The Block
What You Should Pay Attention To
• OP Stack Establishing its Presence
Optimism’s modular framework, OP Stack, maintains its position as the leading scaling solution for Ethereum, with established players like Binance, Coinbase, Worldcoin, and A16z all opting to leverage the solution to build their customized networks. This week, Coinbase launched public access to its scaling solution dubbed Base, leveraging the OP Stack. Although developers have been allowed to deploy applications and migrate their capital since mid-June, the official bridge opened last week, allowing users to migrate their capital using official channels. That said, Base experienced tremendous growth quickly, amassing close to ~$200M in AuM in less than three weeks.
Figure 5: Coinbase Scaling Solution AuM
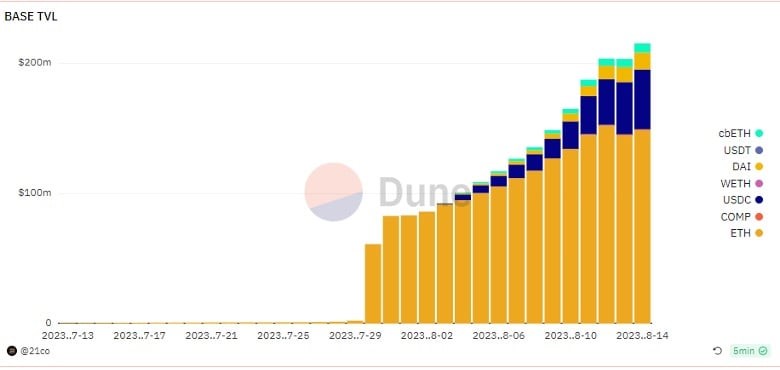
Source: @21co on Dune
While the initial shift was prompted by a meme coin frenzy, the ongoing surge in user activity signifies strong enthusiasm for the Ethereum ecosystem. Moreover, Base holds significant growth potential due to Coinbase’s extensive 110M user base, which can seamlessly transition to the on-chain ecosystem through user-friendly interfaces. In line with this, Coinbase revealed “on-chain summer”, an initiative to introduce users to Base’s vibrant ecosystem and showcase the network’s enhanced performance. The program was a success as the network logged more than 136K daily active users at its peak, surpassing Optimism and Polygon. Whether Base can sustain its user base in the long run, remains to be seen. However, it will certainly be a key network to look for over the next few months.
Figure 6: Daily Active Addresses of the Four Leading Ethereum Scaling Solutions
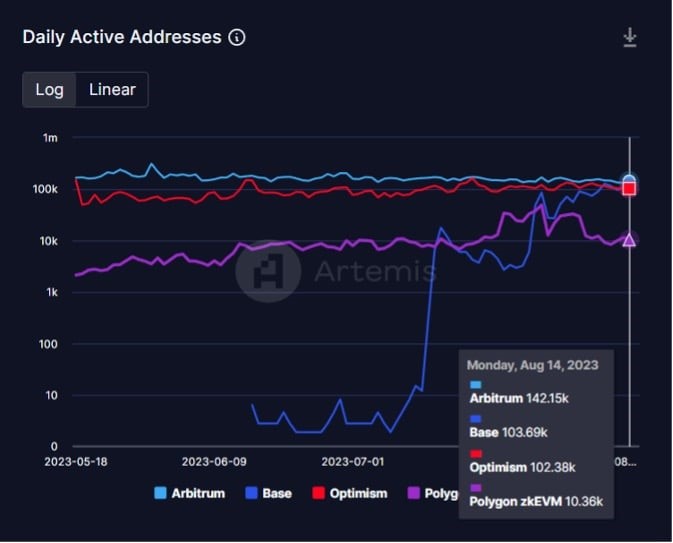
Source: Artemis.xyz
Comparatively, Debank, a renowned portfolio tracker, has revealed plans for a social media network on the OP stack. This initiative aims to convert their messaging service into a complete social graph, rewarding users for valuable contributions like posts and time invested. Debank has already introduced a testnet version of this network, demonstrating nearly 100x lower gas costs for data storage compared to traditional blockchains. Similar to Coinbase, Debank boasts a substantial user base, offering the potential to drive decentralized social media adoption beyond Lens. Lastly, the upcoming OP Stack network releases are a net positive for the ecosystem, as a portion of their respective transaction costs is directed towards the Optimism treasury to help drive its sustainable growth.
Bookmarks:
• Inside Crypto Exchange-Traded Products; check out our 9th issue of State of Crypto
• Check out our Dune dashboard, tracking Worldcoin’s airdrop and adoption metrics, here.
Next Week’s Calendar
These are the top events we’re monitoring for next week.
• August 16: FOMC meeting minutes
• Earnings season: Walmart, Home Depot
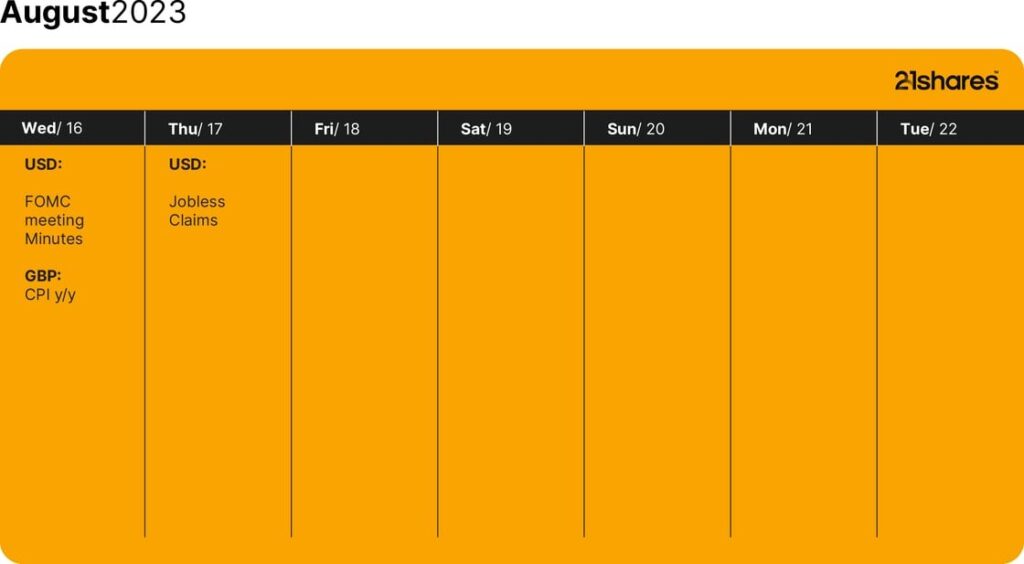
Source: Forex Factory
Research Newsletter
Each week the 21Shares Research team will publish our data-driven insights into the crypto asset world through this newsletter. Please direct any comments, questions, and words of feedback to research@21shares.com
Disclaimer
The information provided does not constitute a prospectus or other offering material and does not contain or constitute an offer to sell or a solicitation of any offer to buy securities in any jurisdiction. Some of the information published herein may contain forward-looking statements. Readers are cautioned that any such forward-looking statements are not guarantees of future performance and involve risks and uncertainties and that actual results may differ materially from those in the forward-looking statements as a result of various factors. The information contained herein may not be considered as economic, legal, tax or other advice and users are cautioned to base investment decisions or other decisions solely on the content hereof.


Vilken typ av sektor ETFer finns det?

LVLD ETF investerar i ett urval av företag världen över med låg volatilitet

Den europeiska ETF-revolutionen: Skiftet som ritar om kartan för kapitalförvaltning
EEAK ETF investerar i eurodenominerade statsobligationer från eurozonen

HEQQ ETF mål är att ge långsiktig kapitaltillväxt

USA satsar 2 miljarder dollar på kvantdatorer – så kan investerare dra nytta av utvecklingen

Extrema skillnader: Varför presterar Europas kvantdator-ETFer så olika?

QQCC ETF följer företag världen över som är aktiva inom kvantberäkning

Fastställd utdelning i MONTDIV maj 2026

Varför Plus500 är en dröm för finans-affiliate
-
 Nyheter4 veckor sedan
USA satsar 2 miljarder dollar på kvantdatorer – så kan investerare dra nytta av utvecklingen
-
 Nyheter3 veckor sedan
Extrema skillnader: Varför presterar Europas kvantdator-ETFer så olika?
-
 Nyheter3 veckor sedan
QQCC ETF följer företag världen över som är aktiva inom kvantberäkning
-
 Nyheter4 veckor sedan
Fastställd utdelning i MONTDIV maj 2026
-
 Nyheter3 veckor sedan
Varför Plus500 är en dröm för finans-affiliate
-

 Nyheter1 vecka sedan
Den osynliga flaskhalsen i AI-boomen: Varför elinfrastruktur är nästa stora megatrend
-

 Nyheter3 veckor sedan
ETFer för fotbolls-VM 2026
-

 Nyheter4 veckor sedan
21shares produkter nu finns tillgängliga hos Revolut