
Nyheter
ETC Group Crypto Market Compass #12 2024
• Cryptoassets pull back after a strong rally as short-term BTC investors are taking profits
• Our in-house “Cryptoasset Sentiment Indicator” has declined significantly and currently signals neutral sentiment
• Meanwhile, large investors continue to accumulate bitcoins as Coinbase BTC on-exchange balances just hit a 9-year low
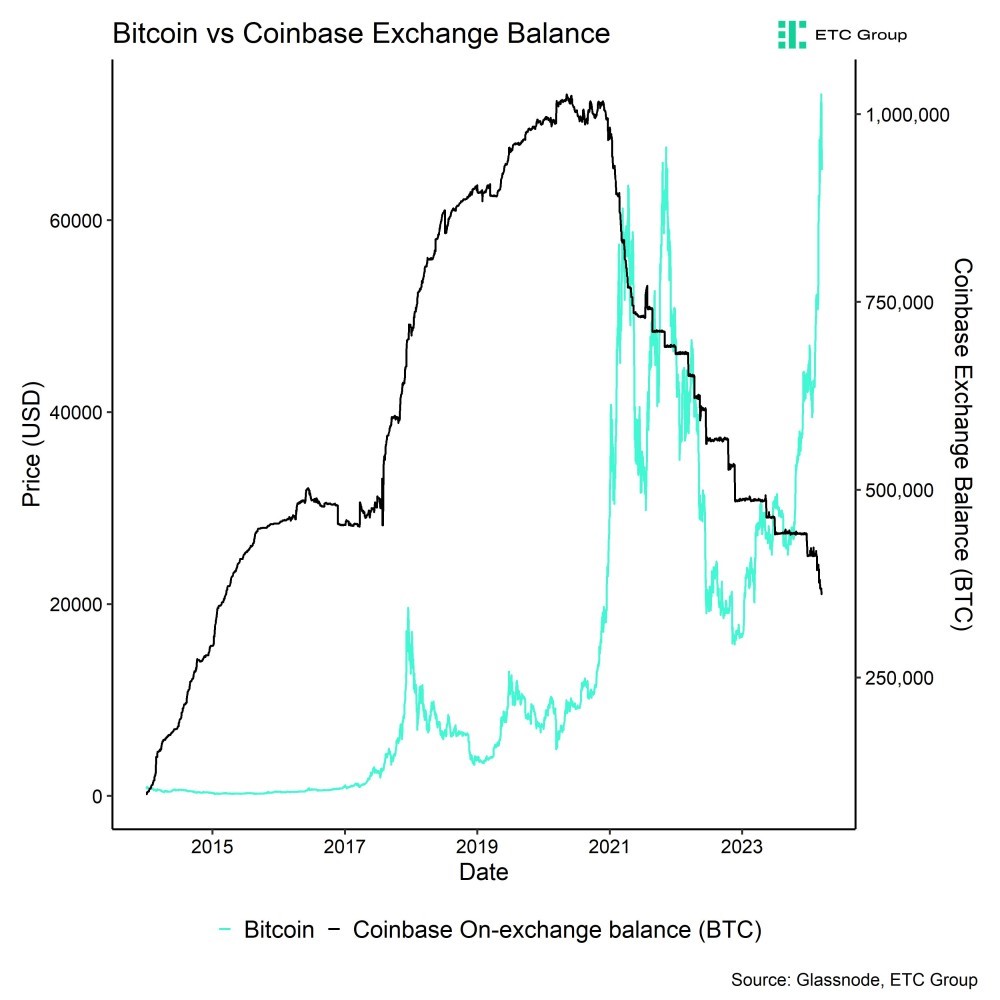
Chart of the Week
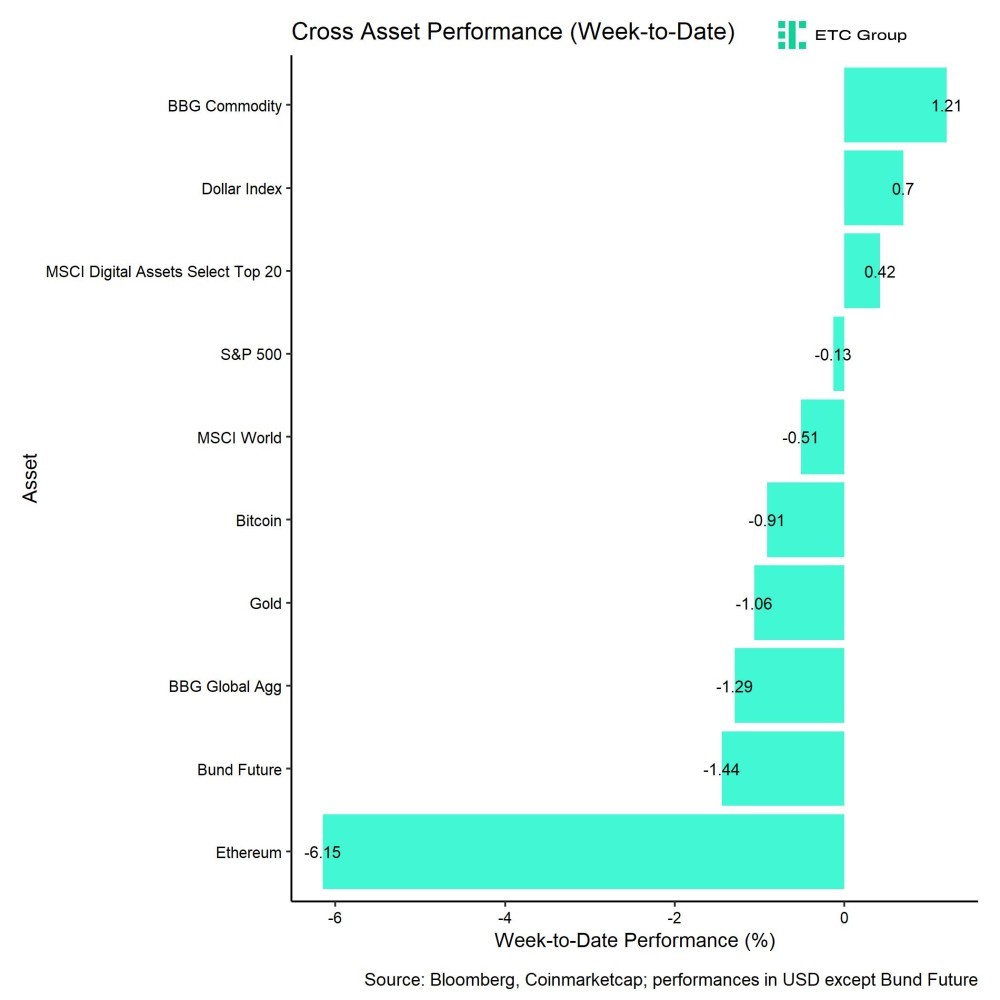
Performance
Last week, cryptoassets pulled back after a strong rallye to new all-time highs. The major catalyst for this latest move appears to be related to short-term investors and smaller wallet cohorts taking profits already. The downside move was also exacerbated by an increase in long futures liquidations as well as a deceleration in fund inflows more recently.
However, overall exchange balances imply that the demand overhang for bitcoins is still very much present and that larger investors continue to accumulate bitcoins at a very large scale. Amongst others, this is visible in Coinbase on-exchange balances that have just touched a fresh 9-year low (Chart-of-the-Week).
Thus, the most recent on-chain data suggest that there is currently a renewed redistribution of bitcoins from smaller to larger wallet cohorts taking place.
All in all, Bitcoin was more or less flat compared to last week. However, there was a significant underperformance of Ethereum vis-à-vis Bitcoin that was most likely related to an open letter of two US senators to SEC chairman Gary Gensler who oppose additional crypto spot ETF approvals by the SEC.
Moreover, the influential Bloomberg ETF analyst Eric Balchunas has also reduced his personal probability of an earlier Ethereum ETF approval in May 2024 to around 35% due to less activity between issuers and the SEC relative to the activity in the run-up to the Bitcoin spot ETF approval. However, he also thinks that an Ethereum spot ETF will ultimately be approved at some later point in the future. The underperformance was also accompanied by accelerating net outflows from global Ethereum-based ETPs.
This comes at a time when Ethereum has undergone the so-called Dencun upgrade which amongst others includes the EIP-4844 that promises to increase scalability and reduce fees on Layer 2s. Some major Layer 2s like Base and Arbitrum have already implemented the upgrade and fee reductions are so far very significant.
This will most likely put Ethereum and ETH Layer 2s in a better position to compete with low-cost and highly scalable chains like Solana.
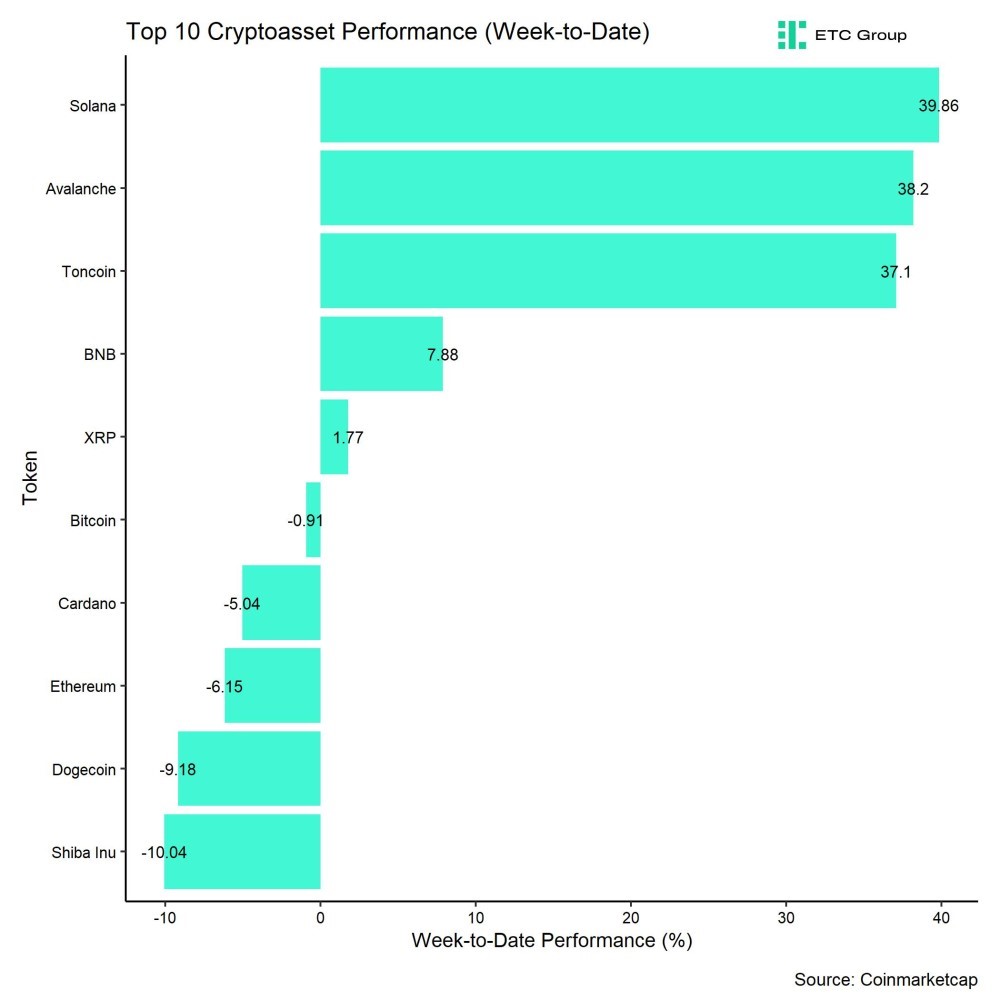
In general, among the top 10 crypto assets, Solana, Avalanche, and Toncoin were the relative outperformers.
Nonetheless, overall altcoin outperformance vis-à-vis Bitcoin was low compared to the week prior, with only 30% of our tracked altcoins managing to outperform Bitcoin on a weekly basis. This was most likely due to a general decline in risk appetite due to the most recent pull-back in Bitcoin.
Sentiment
Our in-house “Cryptoasset Sentiment Index” has declined significantly and currently signals neutral sentiment.
At the moment, 8 out of 15 indicators are above their short-term trend.
There were significant reversals to the downside in BTC perpetual futures funding rate and the short-term holder spent output profit ratio (STH-SOPR).
The Crypto Fear & Greed Index still remains in ”Extreme Greed” territory as of this morning.
Besides, our own measure of Cross Asset Risk Appetite (CARA) has increased again throughout the week which signals ongoing bullish sentiment in traditional financial markets. This index is currently at the highest reading since July 2023.
Performance dispersion among cryptoassets has declined further due to the most recent correction. However, overall performance dispersion still remains relatively high.
In general, high performance dispersion among cryptoassets implies that correlations among cryptoassets are low, which means that cryptoassets are trading more on coin-specific factors and that cryptoassets are increasingly decoupling from the performance of Bitcoin.
At the same time, altcoin outperformance vis-à-vis Bitcoin was relatively unchanged compared to the week prior with only 30% of our tracked altcoins that have outperformed Bitcoin on a weekly basis. However, there was a significant underperformance of Ethereum vis-à-vis Bitcoin last week.
In general, decreasing altcoin outperformance tends to be a sign of declining risk appetite within cryptoasset markets.
Fund Flows
Overall, we saw another week of record net fund inflows in the amount of +2,862.7 mn USD (week ending Friday) based on Bloomberg data across all types of cryptoassets.
Global Bitcoin ETPs continued to see significant net inflows of +2,856.2 mn USD of which +2,565.7 mn (net) were related to US spot Bitcoin ETFs alone. The ETC Group Physical Bitcoin ETP (BTCE) saw net outflows equivalent to -13.3 mn USD last week.
The Grayscale Bitcoin Trust (GBTC) experienced a significant increase in net outflows of approximately -1246.1 mn USD last week. However, this was also more than offset by net inflows into other US spot Bitcoin ETFs which managed to attract +3,812 bn USD (ex GBTC).
Last week on Tuesday (12/03/2024), US spot Bitcoin ETFs saw the highest daily net inflow since trading launch of above 1 bn USD on a single day. However, since then, we have seen a gradual deceleration in net inflows overall and also a reacceleration in net outflows from GBTC which probably also contributed to the most recent downside move. This was also evident in negative NAV discounts of those ETFs towards the end of last week.
Apart from Bitcoin, we saw comparatively small flows into other cryptoassets last week again.
Global Ethereum ETPs even saw significant net outflows last week of around -56.6 mn USD which represents an acceleration of outflows compared to the week prior. Meanwhile, the ETC Group Physical Ethereum ETP (ZETH) had -0.7 mn USD while the ETC Group Ethereum Staking ETP (ET32) was able to attract almost +20.0 bn USD in net inflows last week.
Besides, Altcoin ETPs ex Ethereum managed to attract inflows of around +24.7 mn USD last week.
Thematic & basket crypto ETPs also experienced net inflows of +38.4 mn USD, based on our calculations. The ETC Group MSCI Digital Assets Select 20 ETP (DA20) saw neither in- nor outflows last week (+/- 0.0 mn USD).
Besides, the beta of global crypto hedge funds to Bitcoin over the last 20 trading remained at around 1.00 which implies that global crypto hedge funds have currently a neutral market exposure.
On-Chain Data
The major catalyst for this latest move appears to be related to short-term investors and smaller wallet cohorts taking profits already. Amongst others, this was very visible in the short-term holder spent output profit ratio (STH SOPR) that spiked to the highest reading since May 2019 on Wednesday last week. So, there was a very significant degree of short-term profit-taking.
However, overall exchange balances imply that the demand overhang for bitcoins is still very much present and that larger investors continue to accumulate bitcoins at a very large scale. Amongst others, this is visible in Coinbase on-exchange balances that have just touched a fresh 9-year low (Chart-of-the-Week).
In general, we saw record net outflows from exchanges last week. Both Coinbase and Bitfinex, which is known to be an exchange for larger investors, saw their highest net outflows of 2024 last week which implies a continued high buying interest for bitcoin.
The highest outflows just happened yesterday (Sunday) which implies that larger investors have accumulated into the most recent price correction.
Meanwhile, smaller wallet cohorts have continued to distribute their bitcoins into the most recent rallye. This is particularly visible in net exchange flows by wallet cohort. While large wallet cohorts in excess of 1 mn USD have seen net exchange outflows of -50.4k BTC over the past 7 days, smaller wallet cohorts have sent around +12.7k BTC to exchanges during the same time period.
This observation is corroborated by the fact that Bitcoin whales have taken around -2,878 BTC off exchanges over the past 7 days. Whales are defined as unique entities holding at least 1k coins. The absolute number of whales also continues to grow.
Overall, we have seen the highest weekly net exchange outflows in 2024 last week with around -37.6k BTC net outflows over the past 7 days.
Thus, the most recent on-chain data suggest that there is currently a renewed redistribution of bitcoins from smaller to larger wallet cohorts taking place.
The fact that long-term holders have increasingly been distributing bitcoins can be reconciled with the fact that many long-term holders are actually part of smaller wallet cohorts.
Futures, Options & Perpetuals
The most recent downside move from all-time highs was exacerbated by an increase in long futures liquidations as well. Long futures liquidations spiked above 100 mn USD on Friday last week according to data provided by Glassnode.
Nonetheless, both futures and perpetual open interest managed to increase over the past week. Especially CME saw a significant increase in futures open interest despite the most recent rout which implies that CME futures traders, which is dominated by institutional investors, have continued to increase their exposure to Bitcoin.
The futures basis rate has also remained elevated throughout the past correction at around 24.2% p.a.
In the context of the most recent correction, it is worth noting that the weighted Bitcoin futures perpetual funding rate across multiple derivatives exchanges has not turned negative during the most recent correction. However, funding rates have certainly declined to more moderate levels that do not imply excessive risk-taking to the upside anymore.
BTC options’ open interest has also increased last week. The Put-call open interest continued to decline compared to last week and is now at around 0.56 which does not signal a significant appetite for downside protection. Put-call volume ratios also remained relatively low despite the most recent correction.
However, the 25-delta BTC 1-month option skew increased last week signalling higher bids for puts relative to call options.
However, BTC option implied volatilities have come off the highs recorded on Monday last week. Implied volatilities of 1-month ATM Bitcoin options are currently at around 73.6% p.a.
Bottom Line
• Cryptoassets pull back after a strong rallye as short-term BTC investors are taking profits
• Our in-house “Cryptoasset Sentiment Indicator” has declined significantly and currently signals neutral sentiment
• Meanwhile, large investors continue to accumulate bitcoins as Coinbase BTC on-exchange balances just hit a 9-year low
Disclaimer
Important Information
The information provided in this material is for informative purposes only and does not constitute investment advice, a recommendation or solicitation to conclude a transaction. This document (which may be in the form of a blogpost, research article, marketing brochure, press release, social media post, blog post, broadcast communication or similar instrument – we refer to this category of communications generally as a “document” for purposes of this disclaimer) is issued by ETC Issuance GmbH (the “issuer”), a limited company incorporated under the laws of Germany, having its corporate domicile in Germany. This document has been prepared in accordance with applicable laws and regulations (including those relating to financial promotions). If you are considering investing in any securities issued by ETC Group, including any securities described in this document, you should check with your broker or bank that securities issued by ETC Group are available in your jurisdiction and suitable for your investment profile.
Exchange-traded commodities/cryptocurrencies, or ETPs, are a highly volatile asset and performance is unpredictable. Past performance is not a reliable indicator of future performance. The market price of ETPs will vary and they do not offer a fixed income. The value of any investment in ETPs may be affected by exchange rate and underlying price movements. This document may contain forward-looking statements including statements regarding ETC Group’s belief or current expectations with regards to the performance of certain asset classes. Forward-looking statements are subject to certain risks, uncertainties and assumptions, and there can be no assurance that such statements will be accurate and actual results could differ materially. Therefore, you must not place undue reliance on forward-looking statements. This document does not constitute investment advice nor an offer for sale nor a solicitation of an offer to buy any product or make any investment. An investment in an ETC that is linked to cryptocurrency, such as those offered by ETC Group, is dependent on the performance of the underlying cryptocurrency, less costs, but it is not expected to match that performance precisely. ETPs involve numerous risks including, among others, general market risks relating to underlying adverse price movements and currency, liquidity, operational, legal, and regulatory risks.


Nyheter
BlackRock lanserar ST4R ETF för att erbjuda snabb tillgång till möjligheter inom rymdekonomin


Nya ETF- och ETP-noteringar den 9 juni 2026 på Deutsche Börse

UONS ETF spårar den amerikanska dagslåneräntan

BlackRock lanserar ST4R ETF för att erbjuda snabb tillgång till möjligheter inom rymdekonomin

DJIW ETF investerar i Sharia-kompatibla globala företag utanför USA

Nya ETF- och ETP-noteringar den 8 juni 2026 på Deutsche Börse

USA satsar 2 miljarder dollar på kvantdatorer – så kan investerare dra nytta av utvecklingen

De bästa ETFerna för att investera i emerging markets

Fastställd utdelning i MONTDIV maj 2026

Varför Plus500 är en dröm för finans-affiliate

Extrema skillnader: Varför presterar Europas kvantdator-ETFer så olika?
-
 Nyheter2 veckor sedan
USA satsar 2 miljarder dollar på kvantdatorer – så kan investerare dra nytta av utvecklingen
-
 Nyheter3 veckor sedan
De bästa ETFerna för att investera i emerging markets
-
 Nyheter3 veckor sedan
Fastställd utdelning i MONTDIV maj 2026
-
 Nyheter1 vecka sedan
Varför Plus500 är en dröm för finans-affiliate
-
 Nyheter1 vecka sedan
Extrema skillnader: Varför presterar Europas kvantdator-ETFer så olika?
-

 Nyheter3 veckor sedan
ASWF ETF är en aktivt förvaltad fond som investerar i Kanada
-

 Nyheter2 veckor sedan
21shares produkter nu finns tillgängliga hos Revolut
-

 Nyheter2 veckor sedan
Olja och Hormuzsundet fick flest sökningar i maj 2026