
Nyheter
Crypto Market Compass 8 July 2024
• Last week, cryptoassets continued to underperform on account ongoing profit-taking by large long-term holders
• Our in-house “Cryptoasset Sentiment Indicator” has declined sharply and signals bearish sentiment again
• Ongoing profit-taking by large long-term holders such as German government entities or the Mt Gox trustee will likely continue to be a headwind over the coming weeks
Chart of the Week
Performance
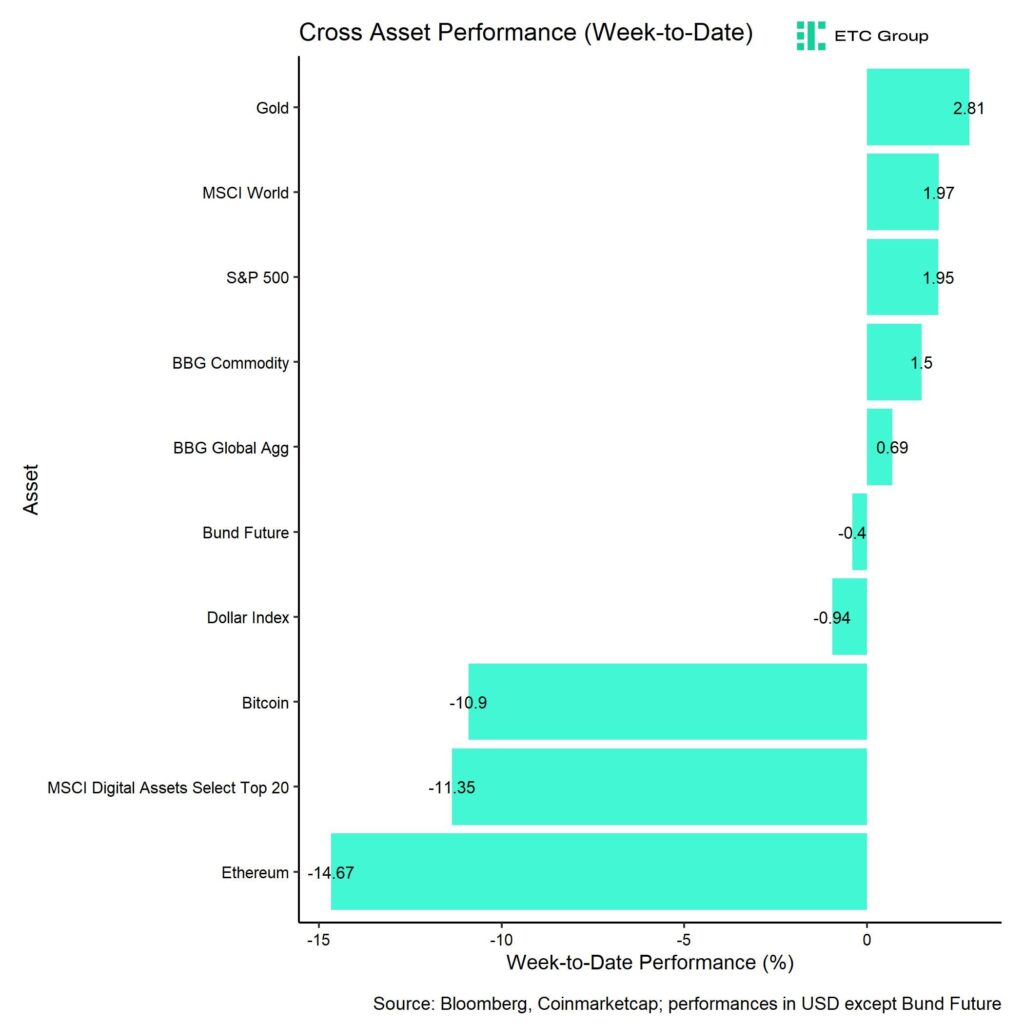
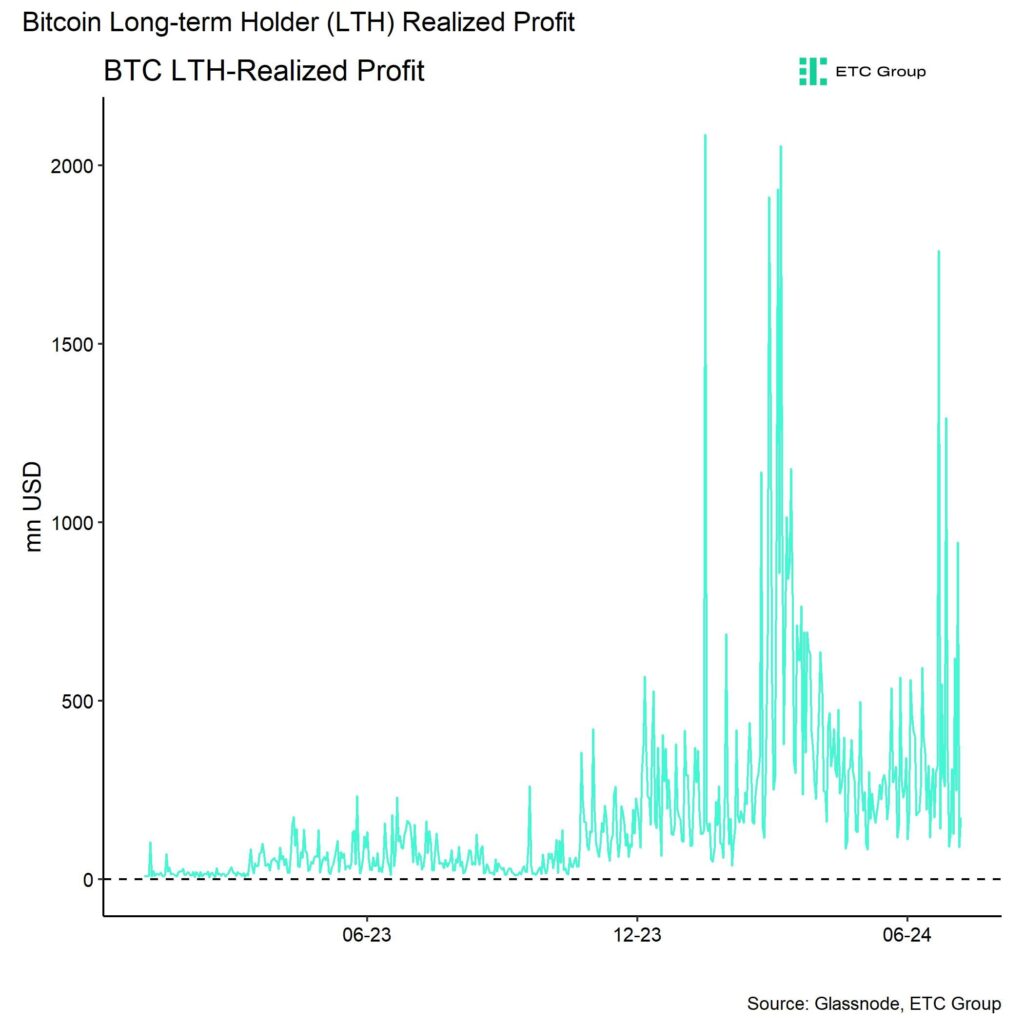
Last week, cryptoassets continued to underperform on account ongoing profit-taking by large long-term holders. This is also evident in the high readings of long-term holder’s (LTH) realized profits for Bitcoin (Chart-of-the-Week).
In this context, large long-term holders such as German government entities or the Mt Gox trustee continue to distribute their long-term holdings that they acquired many years back.
More recently, the Mt Gox trustee has also started distributing bitcoins. The trustee sold around 2.7k BTC on Friday alone last week. At the time of writing, the Mt Gox trustee still controls around 139k BTC according to data provided by Glassnode. Another major force of selling was the German government that sold around 6.4k BTC over the past week. This particular government entity still controls around 39.8k BTC.
Looking ahead, we still anticipate this amount of selling to continue to be a headwind for the overall market. In our latest monthly report we also wrote:
“Continued selling from US and German government entities could likely exert continued selling pressure on the market over the coming weeks.”
It may take time for the market to fully digest this level of selling, as opined by some influential market observers. This is due to the fact that much of the legacy supply that was accumulated by government entities (US and Germany), large trusts (GBTC) or legacy exchanges (Mt Gox) over the past years is currently being distributed again.
That being said, our Cryptoasset Sentiment Index has touched a fresh 2-months low again and is currently signalling relatively bearish sentiment and positioning again.
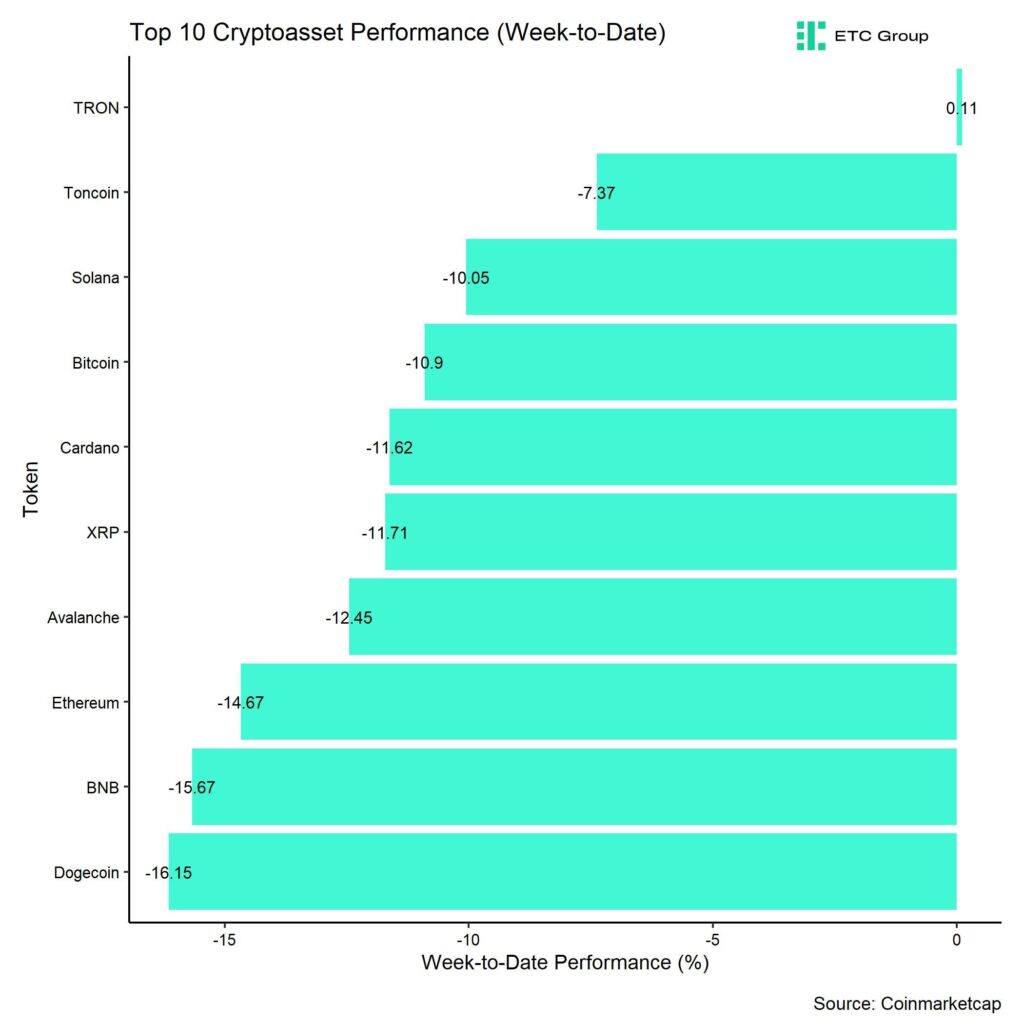
In general, among the top 10 crypto assets, TRON, Toncoin, and Solana were the relative outperformers.
Overall, altcoin outperformance vis-à-vis Bitcoin has significantly reversed again compared to the prior week, with only 20% of our tracked altcoins managing to outperform Bitcoin on a weekly basis. Ethereum also underperformed Bitcoin on a weekly basis.
Sentiment
Our in-house “Cryptoasset Sentiment Index” has declined sharply and signals a bearish sentiment again.
At the moment, only 5 out of 15 indicators are above their short-term trend.
Last week, there were significant reversals to the downside in the BTC Short-Term Holder Net Unrealized Profit/Loss ratio (STH-NUPL) and the Crypto Fear & Greed Index.
The Crypto Fear & Greed Index still signals a “Fear” level of sentiment as of this morning.
Performance dispersion among cryptoassets has reversed to the downside again. This means that altcoins are increasingly becoming correlated with the performance of Bitcoin again.
Altcoin outperformance vis-à-vis Bitcoin has also significantly reversed compared to the week prior, with only around 20% of our tracked altcoins outperforming Bitcoin on a weekly basis, which is consistent with the fact that Ethereum also underperformed Bitcoin last week.
In general, increasing (decreasing) altcoin outperformance tends to be a sign of increasing (decreasing) risk appetite within cryptoasset markets and the latest altcoin underperformance could signal declining appetite for risk at the moment.
In contrast, sentiment in traditional financial markets rebounded from its multi-year lows along with a rebound in market-based global growth expectations, judging by our own measure of Cross Asset Risk Appetite (CARA).
Fund Flows
Despite the weak price action last week, fund flows into global crypto ETPs continued to be positive and even started to accelerate again. Global crypto ETPs saw around +695.9 mn USD in net inflows across all types of cryptoassets which is significantly higher than the +38.2 mn USD in net inflows recorded the prior week.
Global Bitcoin ETPs saw net inflows of +632.7 mn USD last week, of which +238.5 mn USD in net inflows were related to US spot Bitcoin ETFs.
Last week also saw significant inflows into Hong Kong Bitcoin ETFs with +247.2 mn USD which was even slightly higher than US spot Bitcoin ETF net inflows.
Outflows from the ETC Group Physical Bitcoin ETP (BTCE) continued last week with net outflows equivalent to -42.0 mn USD while the ETC Group Core Bitcoin ETP (BTC1) saw neither in- nor outflows last week.
The Grayscale Bitcoin Trust (GBTC) continued to see net outflows, with around -87.9 mn USD last week.
Meanwhile, global Ethereum ETPs saw a reversal in flows last week compared to the week prior with positive net inflows totalling +7.7 mn USD. Interestingly, Hong Kong Ethereum ETFs neither recorded in- nor outflows last week (+/- 0 mn USD).
The ETC Group Physical Ethereum ETP (ZETH) saw minor net outflows of around -1.7 mn USD and the ETC Group Ethereum Staking ETP (ET32) showed sticky AuM last week (+/- 0 mn USD in flows).
In contrast, altcoin ETPs ex Ethereum continued to attract an even higher amount of capital of around +20.1 mn USD last week.
The same is true for Thematic & basket crypto ETPs which also continued to see positive net inflows of +35.4 mn USD, based on our calculations. The ETC Group MSCI Digital Assets Select 20 ETP (DA20) saw neither in- nor outflows last week.
Meanwhile, global crypto hedge funds have continued to increase their market exposure even further into the most recent correction. The 20-days rolling beta of global crypto hedge funds’ performance increased to around 0.66 (up from 0.57) per yesterday’s close.
On-Chain Data
Bitcoin on-chain data currently show a significant level of “pain” among short-term holders, which renders a short-term bottom very likely.
For instance, the short-term holder net unrealized profit-loss ratio (STH-NUPL) is currently at -14.6% meaning that the average short-term holder has around -14.6% in unrealized losses. This metric is already at the lowest level since November 2022 – when FTX collapsed!
Furthermore, the short-term holder spent output profit ratio (STH-SOPR) has declined to 0.957 last Friday – the lowest level since end of 2022 as well.
Short-term holders are investors with a holding period of less than 155 days.
At the time of writing, the average cost basis of short-term holders lies at around 64k USD per bitcoin according to data provided by Glassnode which means that short-term holders are significantly “under water” with their holdings. It is no surprise that short-term holders have continued to realize large amounts of losses into the most recent correction.
This seems to have exacerbated the most recent downside price correction.
That being said, profit-taking by long-term holders is currently the dominant force that is exerting selling pressure on the market.
This is also evident in the high levels of long-term holders’ (LTH) realised gains for bitcoin (Chart-of-the-Week).
In this context, large long-term holders such as the German government or the Mt Gox trustee continue to distribute their long-term holdings acquired many years ago.
Recently, the Mt. Gox trustee has also started to distribute bitcoins. On Friday of last week alone, the trustee sold around 2.7k BTC. At the time of writing, the Mt. Gox trustee still controls around 139k BTC, according to Glassnode. Another major selling force was the German government, which sold around 6.4k BTC last week. This particular government entity still controls around 39.8k BTC.
Looking ahead, we still anticipate this amount of selling to continue to be a headwind for the overall market as opined in our latest monthly report.
Besides, the hash ribbon signal also implies that BTC miners still remain under economic pressure which signals a heightened risk of continued distributions from these entities as well.
Moreover, the market lacks new catalysts that would lead to a significant influx of new short-term investors as shown by the Short- to Long-Term Realized Value (SLRV) Ribbon signal.
Despite the fact that we saw a positive reversal of global net inflows into Bitcoin ETPs over the past 2 weeks, net buying volumes on BTC spot exchanges continue to be negative, highlighting the high selling pressure from other types of investors.
On a positive note, this high degree of selling implies that sellers could become exhausted relatively soon, which would lead to a stabilization in prices.
Futures, Options & Perpetuals
Last week, both BTC futures and perpetual open interest declined amid an increase in forced long liquidations.
Nonetheless, perpetual funding rates mostly remained positive throughout last week. When the funding rate is positive (negative), long (short) positions periodically pay short (long) positions. A positive funding rate tends to be a sign of bullish sentiment in perpetual futures markets.
The 3-months annualized BTC futures basis rate declined significantly to only around 8.0% p.a.
BTC options’ open interest increased significantly last week after the large expiries at the end of June. This increase in open interest was largely driven by an increase
in relative put open interest consistent with the recent price correction as BTC option traders increased their downside bets/hedges. However, the aggregate put-call open interest ratio still remains significantly lower than during the highs observed in March.
That being said, both the spike in put-call volume ratios as well as 1-month 25-delta option skew signalled a significant increase in demand for downside protection.
BTC option implied volatilities have also increased slightly during the latest leg down. Implied volatilities of 1-month ATM Bitcoin options are currently at around 50.5% p.a. The term structure of volatility is also inverted now, with short-dated options trading at significantly higher implied volatilities than longer-dated options. This tends to be a sign of overextended bearishness in the options market.
Bottom Line
• Last week, cryptoassets continued to underperform on account ongoing profit-taking by large long-term holders
• Our in-house “Cryptoasset Sentiment Indicator” has declined sharply and signals bearish sentiment again
• Ongoing profit-taking by large long-term holders such as German government entities or the Mt Gox trustee will likely continue to be a headwind over the coming weeks
To read our Crypto Market Compass in full, please click the button below:

This is not investment advice. Capital at risk. Read the full disclaimer
© ETC Group 2019-2024 | All rights reserved


iShares Space Technologies UCITS ETF investera bortom jorden

JIPD ETF delar ut månadsvis

Quantum computers can’t break bitcoin. Yet.

MMAX ETF är en globalfond

SICE ETF köper investment grade företagsobligationer från hela världen

USA satsar 2 miljarder dollar på kvantdatorer – så kan investerare dra nytta av utvecklingen

De bästa ETFerna för att investera i emerging markets

Extrema skillnader: Varför presterar Europas kvantdator-ETFer så olika?

Fastställd utdelning i MONTDIV maj 2026

Varför Plus500 är en dröm för finans-affiliate
-
 Nyheter3 veckor sedan
USA satsar 2 miljarder dollar på kvantdatorer – så kan investerare dra nytta av utvecklingen
-
 Nyheter4 veckor sedan
De bästa ETFerna för att investera i emerging markets
-
 Nyheter2 veckor sedan
Extrema skillnader: Varför presterar Europas kvantdator-ETFer så olika?
-
 Nyheter3 veckor sedan
Fastställd utdelning i MONTDIV maj 2026
-
 Nyheter2 veckor sedan
Varför Plus500 är en dröm för finans-affiliate
-

 Nyheter4 veckor sedan
ASWF ETF är en aktivt förvaltad fond som investerar i Kanada
-

 Nyheter2 veckor sedan
ETFer för fotbolls-VM 2026
-

 Nyheter2 veckor sedan
QQCC ETF följer företag världen över som är aktiva inom kvantberäkning