Nyheter
Gold’s Muted Response Speaks Volumes
Publicerad
6 år sedanden

Contributors to the text Gold’s Muted Response Speaks Volumes: Joe Foster, Portfolio Manager and Strategist, and Imaru Casanova, Deputy Portfolio Manager/Senior Analyst for the Gold Strategy
Gold Faced Selling Pressure Early in February Despite Normally Positive Conditions
In an environment that would typically be positive for gold, it appears gold faced selling pressure as investors searched for liquidity to cover margin calls and redemptions. Gold declined in February as increased market volatility and a drop in equity and bond markets failed to support demand for gold as a safe haven1. On February 2, the labor market report in the U.S. showed a strong rebound in average hourly earnings that was well above expectations. The U.S. dollar rallied and gold declined. Equity markets dropped, with the Dow Jones Industrial Average (DJIA)2 down almost 9% by February 8 (ending February down 4%), U.S. Treasury yields rose, and the U.S. dollar, rather than gold, was the beneficiary.
Weaker U.S. Dollar, Heightened Inflation Expectations Helped Gold Reach Month High
On February 14, January’s inflation report beat consensus, with headline inflation measured by the Consumer Price Index (CPI)3 accelerating to 2.1% year-on-year. U.S. Treasury yields continued their rise and the U.S. dollar weakened. Meanwhile, the equity markets and gold bounced back. Gold reached its high for the month of $1,353.70 per ounce on February 15.
Gold Rally Loses Momentum as U.S. Dollar Strengthens on Fed comments
However, the gold rally was short lived, as the markets priced in hawkish expectations ahead of the release of Federal Open Market Committee (FOMC) minutes on February 21. The Fed minutes themselves did not contain much new information, but confirmed the market’s expectations for three rate hikes this year. In addition, the testimony by new Fed chairman Jerome Powell to the House of Representatives’ Committee on Financial Services was viewed as optimistic, stating that he sees gradual rate hikes, and more importantly, an improved U.S. growth outlook. The U.S. Dollar Index (DXY)4 was up 1.7% during the month. Commodities were lower during February, which is also negative for gold. Gold closed at $1,318.38 per ounce on February 28, down 2% or $26.78 per ounce for the month.
Demand for Gold ETPs up YTD Helping Bullion Outperform Gold Stocks
Demand for gold bullion-backed exchange traded products (ETPs) declined in February, with holdings down about 0.3% for the month. This followed a 1.3% increase in holdings in January, resulting in a net 1.1% increase year to date as of February 28. We track the flows into the gold bullion ETPs as we believe investments in those products typically represent longer-term, strategic investment demand for gold and, as such, provide an excellent proxy for the direction of the gold market.
Gold stocks underperformed gold, with the NYSE Arca Gold Miners Index (GDMNTR)5 falling 9.91%, and the MVIS Global Junior Gold Miners Index (MVGDXJTR)6 dropping 6.7% during the month. The junior companies caught up with their larger peers after underperforming in January.
Gold Stocks Impacted by Reaction to Mixed Q4 Reporting, Not Fundamentals
While many gold companies reported positive fourth quarter 2017 operating results, earnings/financial results were mixed and guidance for 2018, in some cases, seems to have surprised the markets. The negative sector headlines put significant selling pressure on the stocks. In many cases, these negative surprises have shorter-term effects, and do not change the companies’ fundamental valuations. However, more recently, it appears that selling pressure might be intensified by headline-driven, algorithm-based trading where the longer-term fundamentals are ignored.
The End of the Low Interest Rates Era and the Multi-Decade Bond Bull Market?
It looks like the post-crisis era of ultra-low, below-market interest rates and the multi-decade bond bull market both came to an end in February. In early February the simultaneous fall in both stocks and bonds caught the markets very off guard. Five- and 10-year U.S. Treasury rates jumped up and out of a downtrend that goes back to 1985. The stock market sell-off was a taste of the unintended consequences of Fed policies that encourage investors to take on more risk, driving markets in one relentless direction for nine years. Funds designed to thrive in a low volatility environment were forced to sell in a reinforcing feedback loop, exposing new systemic risks.
Bitcoin Crash Another Sign that Easy Money May Be Over
Another sign of the end of an era of easy money was the bitcoin crash. From its high of $19,511 in December, bitcoin declined 70% to its $5,922 low on February 5. It has since recovered to around $10,000. Bitcoin has already gone through one crash this year and the value of the emerging technology, while potentially disruptive, is still unproven.
Investor Complacency Remains Despite Volatility, Rising Debt, Rising Rates
Safe haven investments showed little reaction to the stock market selloff. Gold and the dollar essentially trended sideways, while U.S. Treasuries headed lower. So far investors are treating the stock market volatility as an overdue correction, however we see it as the beginning of a secular shift in markets and investor psychology that brings more volatility and risk going forward. Perhaps the prelude to a bear market and economic downturn.
It looks like a higher interest rate regime is taking hold. It is not yet clear whether it is being driven by inflationary expectations, Fed rate increases, increasing fiscal deficits, or a combination of all three. Protectionist trade policies, wage pressures, and a weak dollar may cause core inflation to trend through the Fed’s 2% target, which may bring more aggressive rate policies. Fiscal deficits projected to rise above $1,000,000,000,000 in a couple of years will cause the Treasury to issue huge quantities of debt at the same time the Fed is reducing its $4,000,000,000,000 hoard of U.S. Treasuries, mortgage-backed securities, and agency debt. (FYI…12 zeroes equals a trillion).
A new era of higher interest rates brings added uncertainty. As these rates rise, equity risk premiums get squeezed, making stocks less desirable. According to Gluskin Sheff7, a 50 basis point rise in rates costs the economy $250 billion in debt service annually. We do not know how the new Fed management will respond to volatile markets and potentially weaker economic growth. Unwinding the Fed balance sheet (quantitative tightening) is an unprecedented financial experiment. Is the February volatility an indication of how a system dominated by passively managed funds, algorithms, and automation will behave?
We believe the muted response from gold and other safe haven investments suggests complacency continues to dominate the markets. In fact, the University of Michigan Consumer Sentiment Index’s mid-month reading for February rose unexpectedly to nearly a 13-year high. As the year unfolds, we expect an erosion of complacency and confidence that benefits gold.
IMPORTANT DISCLOSURE
1Safe haven is an investment that is expected to retain its value or even increase its value in times of market turbulence.
2The Dow Jones Industrial Average (DJIA) is a price-weighted average of 30 significant stocks traded on the New York Stock Exchange (NYSE) and the NASDAQ.
3The Consumer Price Index (CPI) is a measure that examines the weighted average of prices of a basket of consumer goods and services, such as transportation, food and medical care. It is calculated by taking price changes for each item in the predetermined basket of goods and averaging them.
4U.S. Dollar Index (DXY) indicates the general international value of the U.S. dollar. The DXY does this by averaging the exchange rates between the U.S. dollar and six major world currencies: Euro, Japanese yen, Pound sterling, Canadian dollar, Swedish kroner, and Swiss franc.
5NYSE Arca Gold Miners Index (GDMNTR) is a modified market capitalization-weighted index comprised of publicly traded companies involved primarily in the mining for gold.
6MVIS® Global Junior Gold Miners Index (MVGDXJTR) is a rules-based, modified market capitalization-weighted, float-adjusted index comprised of a global universe of publicly traded small- and medium-capitalization companies that generate at least 50% of their revenues from gold and/or silver mining, hold real property that has the potential to produce at least 50% of the company’s revenue from gold or silver mining when developed, or primarily invest in gold or silver.
7Gluskin Sheff + Associates Inc., a Canadian independent wealth management firm, manages investment portfolios for high net worth investors, including entrepreneurs, professionals, family trusts, private charitable foundations, and estates.
Important Disclosures
This commentary originates from VanEck Investments Limited (“VanEck”) and does not constitute an offer to sell or solicitation to buy any security.
VanEck’s opinions stated in this commentary may deviate from opinions presented by other VanEck departments or companies. Information and opinions in this commentary are based on VanEck’s analysis. Any forecasts and projections contained in the commentary appear from the named sources. All opinions in this commentary are, regardless of source, given in good faith, and may only be valid as of the stated date of this commentary and are subject to change without notice in subsequent versions of the commentary. Any projections, market outlooks or estimates in this material are forward-looking statements and are based upon certain assumptions that are solely the opinion of VanEck. Any projections, outlooks or assumptions should not be construed to be indicative of the actual events which will occur.
Du kanske gillar
-


GOLD ETC en börshandlad råvara utgiven av Boerse Stuttgart
-


GLDA ETC ger exponering mot fysiskt guld
-


Investing in Gold and Silver For Dummies
-


WisdomTree lanserar fysiskt uppbackad guld-ETC med ansvarsfullt ursprung
-


Guldfonder ser utflöden när investerare aktiverar risken
-


HANetf lanserar ETF för ESG-kompatibelt Guld
Nyheter
Regulatory Crackdowns and Ethereum’s Most Anticipated Application
Publicerad
11 timmar sedanden
1 maj, 2024
• Regulatory Crackdowns Fire Up in April
• Macro Uncertainty, Geopolitical Headwinds, and Bitcoin’s Fourth Halving
• The Arrival of Ethereum’s Most Anticipated Application
Macro Uncertainty, Geopolitical Headwinds, and Bitcoin’s Fourth Halving
April brought a challenging landscape for Bitcoin. Geopolitical tensions flared in the Middle East when Israel targeted the Iranian Consulate in Syria on the 1st of April. In an unprecedented response, Iran retaliated directly with a drone strike against Israel, intensifying hostilities. The event contributed to a decline in the stock market and a temporary pullback in Bitcoin’s price. As mentioned two weeks ago, although Bitcoin historically served as a safe haven during crises like the Russian Invasion of Ukraine, its response to Iran-Israeli escalation may have been adverse.
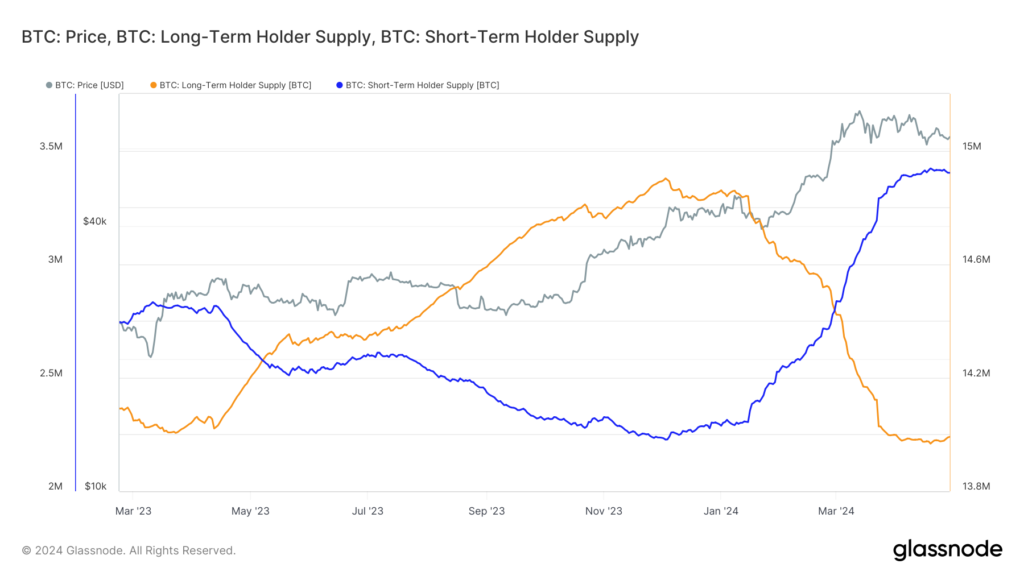
However, a closer look at the market reveals a more nuanced picture. The impact on Bitcoin was primarily felt in the futures market, where open interest peaked at $35 billion on the day of the Consumer Price Index (CPI) print, leading to significant liquidations when inflation came in hotter than expected for the fourth month running. Resilience in the labor market, coupled with strong domestic demand, is evidence that despite Fed efforts, the US is not yet in a position for rate cuts, which may pose further turbulence for risk-on assets. Encouragingly, long-term holders demonstrated resilience amidst escalating tensions. Unlike short-term fears reflected in futures markets, long-term holders increased their supply by 0.1% over the past week, for the first time since January, as the Israeli response seemingly coincided with a local bottom for long-term holder supply. This is a bullish signal, showcasing belief in the asset, irrespective of recent market activity. Nevertheless, we can see that BTC will continue to be stuck in the $60K – $70K range until we get more clarity on the macroeconomic and geopolitical front.
Figure 1: Bitcoin Short-Term Holder Supply vs. Long-Term Holder Supply
Source: Glassnode
Despite the macroeconomic headwinds, significant progress was made in the institutional adoption of Bitcoin. Despite a break in Blackrock’s Bitcoin ETF 71-day net inflow streak, the conclusion of the 90-day due diligence period for fund managers considering the spot ETFs revealed that over 100 institutions, such as BNY Mellon and Banco do Brazil, are exposed to Bitcoin. Morgan Stanley is also actively exploring allowing 15,000 brokers to provide this exposure to their clients. They also filed to broaden access to BTC ETFs by expanding it to 12 more funds, signifying the growing acceptance of Bitcoin by TradFi institutions. Finally, the launch of Bitcoin ETFs in Hong Kong marked a significant step towards adoption in Asia, potentially influencing other jurisdictions like South Korea, Japan, and Singapore to follow suit while expanding Bitcoin’s access to Hong Kong’s $1.15 trillion wealth management sector.
Beyond the market’s activity, April also marked a historic event for Bitcoin: the fourth halving, reducing Bitcoin’s annual inflation rate to below 1%, making it even scarcer than Gold. Historically, Bitcoin trades 50% down from its peak leading up to the halving. This year, Bitcoin defied historical trends, reaching a new all-time high prior to the halving, attributed to the surge in demand from the aforementioned US Bitcoin ETFs, coupled with ongoing technical advancements within the Bitcoin ecosystem, such as Ordinals, BRC-20s, and Runes, as touched upon in the last newsletter.
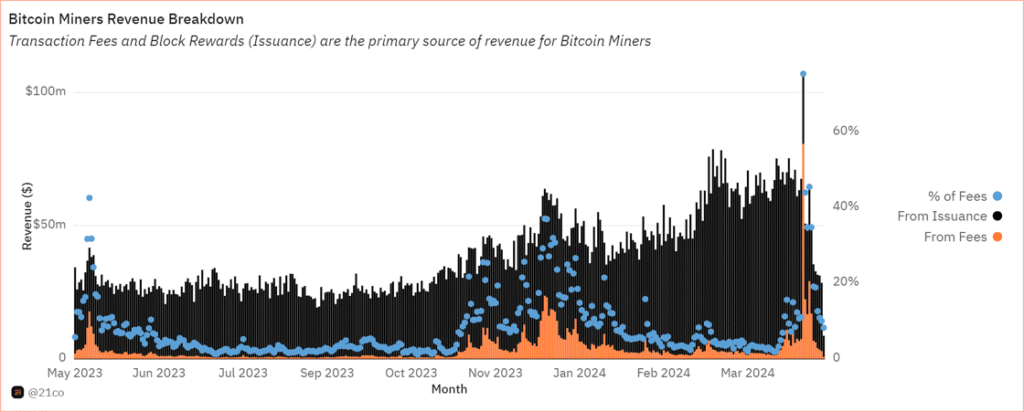
These advancements are transforming Bitcoin beyond its original vision as a purely decentralized payment network. The emergence of Ordinals and Runes has amplified on-chain activity, reflected in surging transaction fees. This is particularly beneficial for Bitcoin miners, who saw their block reward cut in half due to the halving. Higher transaction fees help compensate for this lost revenue, ensuring the continued security of the Bitcoin network. Notably, as shown in Figure 2, Bitcoin transaction fees made up 75% of Bitcoin miner revenue, soaring to $128 on the day of the halving. While the surge might have been driven by the desire to have a historical inscription, it does underscore the potential impact on miners’ revenue as Bitcoin’s on-chain ecosystem matures.
Figure 2: Bitcoin Miners Revenue
Source: 21.co on Dune
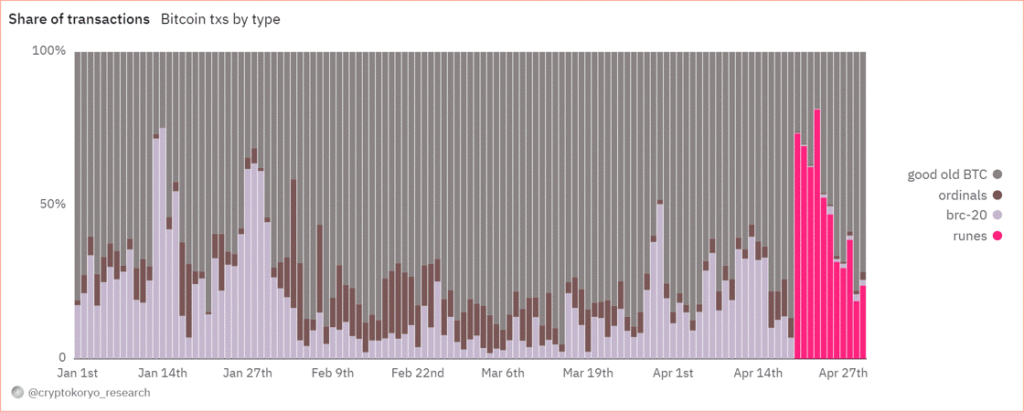
Launched in April, Runes Protocol offers a novel approach to creating fungible tokens on the Bitcoin network. It addresses inefficiencies associated with the BRC-20 standard, which have burdened the Bitcoin blockchain due to its inefficient data handling. Ultimately, Runes presents a key innovation that bolsters Bitcoin’s security budget by offering miners an alternative source of revenue, while reducing their dependence on block rewards. Runes has already rewarded miners with almost $150 million, impressively making up 80% of fees generated on the Bitcoin network on April 23, as shown below.
Figure 3: Share of Bitcoin Transaction Fees
Source: CryptoKoryo on Dune
While Bitcoin’s daily transaction volume surpassed 1 million, rivaling Ethereum’s activity, the initial excitement surrounding Runes might recede before a more long-term, sustainable surge in the network’s DeFi activity. The initial phase often focuses on meme-like tokens attracting rapid but fleeting interest. However, the development of sophisticated DeFi protocols like exchanges and Automated Market Makers (AMMs) will enhance Bitcoin’s application layer, streamlining token trading similar to what ERC-20/ERC-721 standards did for Ethereum. This paves the way for a more robust and mature DeFi ecosystem on Bitcoin, which we will closely monitor in the months to come.
Regulatory Crackdowns Fire Up in April
April saw the continued regulation-by-enforcement trend, cracking down on non-custodial infrastructure and the Ethereum ecosystem. On April 10, the Securities and Exchange Commission (SEC) sent Wells Notices to Uniswap and Consensys for alleged violation of federal securities law. Uniswap announced its intention to resolve this through court. The details of the SEC’s Wells Notice remain unclear. However, it could have been triggered by Uniswap’s pending revenue-sharing initiative, which has had a domino effect on the ecosystem. In the short term, the crackdown could dissuade protocols from following suit, which would have incentivized their users to stake and delegate their tokens for a share of the revenue.
On April 25, Consensys filed a lawsuit against the SEC for “unlawful seizure of authority,” arguing that Ethereum is not a security nor that MetaMask is a securities broker. The recent crackdown could put a strain on the crypto infrastructure industry in the short term, as it could severely disrupt the ecosystem while encouraging companies to explore alternative jurisdictions aside from the U.S. market.
Earlier in February, the SEC adopted rules that widened its interpretation of a dealer to include “as part of a regular business” in addition to the initial definition, “any person engaged in the business of buying and selling securities . . . for such person’s own account through a broker or otherwise.” The newly adopted rules have now triggered an outcry in the crypto community, deeming the legislation too broad, as it includes average market participants in cryptoasset liquidity pools (liquidity providers), who essentially have a very different role than a broker.
For example, liquidity providers on Uniswap can be anyone, given they have the capital to deposit and earn yield, unlike professional market makers in traditional finance whose responsibilities extend beyond that. Providing liquidity on Uniswap is open to anyone to enable permissionless markets, which makes this an important characterization due to the impact it could have on how DeFi functions in the US. While the ongoing crackdown could cause uncertainty in the short term within the Ethereum ecosystem, regulatory clarity will ultimately be reached in the long run, as we’ve seen on several counts of hurdles over the past few years.
Ethereum’s Most Anticipated Application of the Year is Live
EigenLayer is finally live on Ethereum’s mainnet. It’s a new primitive that allows ETH users to “re-stake” their existing staked ETH to validate the security of external networks. EigenLayer has been eagerly anticipated as it optimizes capital efficiency by allowing users to earn additional yield on top of their native staking rewards. Further, it allows younger protocols to borrow the security assurances of Ethereum, circumventing the need to bootstrap their own security from scratch. This translates to a more cost-efficient approach while simultaneously bolstering their decentralization. Nevertheless, the protocol comes with inherent risks.
By opting to earn additional yield, users, and validators subject themselves to heightened smart contract risks as they become exposed to the vulnerabilities of both Ethereum and the additional protocols relying on its security. Moreover, a large portion of ETH could end up being “re-staked” in EigenLayer instead of just validating the security of Ethereum, creating a problem of misalignment. Simply, some validators might opt to maximize their profits by pursuing strategies that prioritize short-term gains over the long-term security of the network. Additionally, the growing enthusiasm for the protocol suggests that a significant portion of the crypto economy might rely on Ethereum’s security. Currently, 15% of all staked ETH is allocated towards Eigen’s re-staking strategy. The continuation of this trend could lead to centralization, posing a risk as Ethereum might inadvertently become a single point of failure over a longer time horizon.
Wide-spread slashing is another concern. In essence, if a substantial amount of ETH is re-staked in a singular protocol, then a slashing event due to unintended or malicious behavior could significantly impact honest ETH stakers. Thus, Eigen proposed a slashing committee comprising esteemed ETH developers and trusted community members, empowered to veto such occurrences and safeguard Ethereum’s integrity.
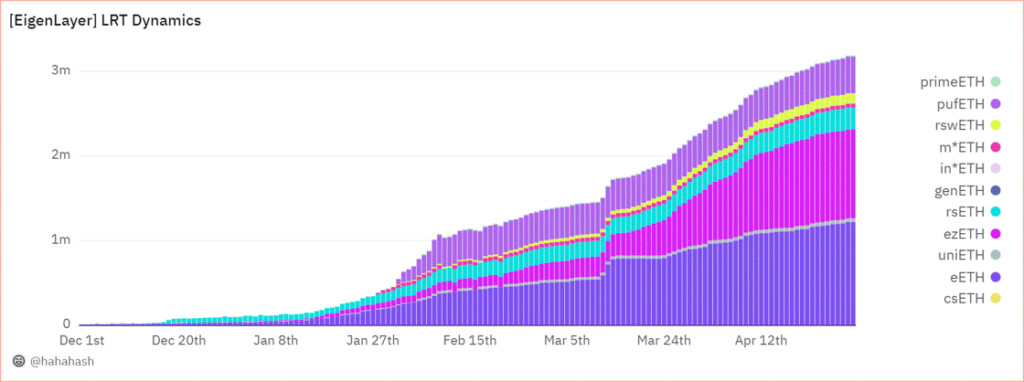
The final risk concerns a new breed of tokens known as Liquid re-staking Tokens (LRTs), which operate atop EigenLayer. LRTs, akin to Liquid Staking Tokens (LSTs) issued by the established Lido Protocol in 2021, aim to unlock similar capital efficiency by allowing users to use their re-staked ETH as collateral for lending and borrowing. Given that re-staked ETH in Eigen can’t be used across DeFi platforms, users have turned to LRT protocols like Ether.fi and Renzo to seek higher levels of capital flexibility, with their re-staked assets. For context, LRTs grew exponentially by a factor of 28 throughout Q1, increasing from nearly 100K units to the current figure of 2.8M, as shown in Figure 4, illustrating its soaring demand.
Figure 4: Growth of Liquid re-staking Tokens (LRTs) on EigenLayer
Source: @hahahash on Dune
While LRTs can offer amplified gains through leveraged lending, they can also exacerbate losses, increasing systemic risk in market downturns. Since some LRT protocols can’t offer withdrawals yet, users may be forced to swap their LRT tokens on thinly traded secondary markets, intensifying their decline. Last week, we saw an instance of this risk manifest when Renzo’s ezETH lost its peg. This happened as the ETH derivative experienced heavy selling on various exchanges, causing it to trade at over a 75% discount compared to ETH. This coincided with the company facing scrutiny over its controversial token distribution plan, which is scheduled to launch on April 30.
All in all, the impact of EigenLayer is not to be understated, as the excitement surrounding the new primitive has propelled it to become the second-largest protocol on Ethereum by Total Value Locked (TVL), boasting an impressive $15.6B. This already eclipses the TVL of established players like Solana by fourfold, highlighting the immense adoption that EigenLayer is witnessing despite its brief existence. Further, the excitement building up to its launch since it unveiled its roadmap in March has propelled the Ethereum validator entry queue to its highest level since October. The queue now necessitates a minimum waiting period of 8 days before new validators can join the network, as seen below in Figure 5. Nevertheless, stay tuned as we prepare to release a more in-depth exploration of EigenLayer risks over the coming weeks.
Figure 5: Ethereum Validator Entry Queue in Days

Source: ValidatorQueue
Next Month’s Calendar

Source: Forex Factory, 21Shares
Research Newsletter
Each week the 21Shares Research team will publish our data-driven insights into the crypto asset world through this newsletter. Please direct any comments, questions, and words of feedback to research@21shares.com
Disclaimer
The information provided does not constitute a prospectus or other offering material and does not contain or constitute an offer to sell or a solicitation of any offer to buy securities in any jurisdiction. Some of the information published herein may contain forward-looking statements. Readers are cautioned that any such forward-looking statements are not guarantees of future performance and involve risks and uncertainties and that actual results may differ materially from those in the forward-looking statements as a result of various factors. The information contained herein may not be considered as economic, legal, tax or other advice and users are cautioned to base investment decisions or other decisions solely on the content hereof.
Nyheter
ETC Group lanserar BTC1, En unik Core Bitcoin ETP
Publicerad
12 timmar sedanden
1 maj, 2024
BTC1 är en bäst-i-klassen Bitcoin ETP utformad för benchmark-fokuserade långsiktiga investerare. ETC Group tillkännagav i förra veckan lanseringen av sin senaste börshandlade produkt (ETP) på Deutsche Börse XETRA. ETC Group Core Bitcoin ETP (ticker BTC1; ISIN DE000A4AER62) som har skräddarsytts specifikt för benchmarkmedvetna, långsiktiga köp-och-håll-investerare och globala institutionella investerare med utökade behov av likviditet och riskhantering. BTC1 kompletterar ETC Groups befintliga produktsortiment, som bland annat inkluderar den mest likvida och största krypto-ETP i Europa.
Viktiga höjdpunkter
- Kostnadseffektiv: Med en Total Expense Ratio (TER) på 0,30 % erbjuder BTC1 en konkurrensfördel i kostnadseffektivitet.
- Benchmark-fokuserad: BTC1 spårar det institutionella prisindexet för Bitcoin med CF Benchmarks, vilket säkerställer noggrannhet och tillförlitlighet vid spårning av Bitcoins prisrörelser.
- Bredare och bredare primärmarknadslikviditet: Som den första reglerade globala spot-Bitcoin-produkten tillhandahåller BTC1 oöverträffad primärmarknadslikviditet, och överbryggar USA, Europa och Asien spot-BTC-likviditet under de handelsfönster som används av globalt, reglerat institutionellt kapital.
- Tri-NAV-metodik: BTC1 introducerar en unik Tri-NAV-metodik, som erbjuder institutionella investerare ett utökat likviditetsfönster på primärmarknaden som täcker amerikanska, europeiska och asiatiska BTC-spotlikviditeter. Därför tillhandahåller emittenten, förutom börsens öppettider, tre prisbestämningar under dagen (istället för bara en) för att utöka den primära marknadens likviditet över ytterligare tidszoner. Detta innebär att institutionella investerare kan handla med sina innehav under den längsta perioden jämfört med alla andra reglerade Bitcoin spotinstrumement över hela världen på den primära marknaden. Som ett resultat kan BTC1 betraktas som den första globalt orienterade Bitcoin-spot-ETP.
- Robust ETP-struktur: BTC1 använder samma betrodda produktstruktur som ETC Groups övriga produkter, inklusive tysk hemvist med primär notering på XETRA, 100 % fysisk uppbackning och full fungibilitet med det underliggande. Dessutom har BTC1 också en oberoende administratör, ett unikt ETP-strukturattribut som först introducerades av ETC Group 2020. Denna administratörsenhet har laglig vetorätt på alla tillgångar eller värdepappersrörelser hos ETP-utgivaren, övervakar depåbalanser och lägger totalt sett till ett extra lager säkerhet för emittentens produktekosystem.
- Säker förvaringslösning: Tillgångar förvaras säkert hos Zodia Custody, en ledande europeisk institutionell leverantör av kylförvaring, med ett ramverk för efterlevnad och styrning av bankklass.
Varför benchmark och likviditet spelar roll
Bitcoins likviditet är enorm men fragmenterad över flera börser, vilket komplicerar prisbestämningen för investerare. CF Benchmarks har utvecklat det mest robusta riktmärket för att fånga och aggregera denna likviditet, BRR-indexet och dess amerikanska och asiatiska varianter – BRRY och BRRAP som tillsammans har blivit det mest använda riktmärket som används av reglerat institutionellt kapital, inklusive majoriteten av amerikanska spot-ETFer och CME Futures. BTC1 utnyttjar alla tre regionala varianter av detta riktmärke, vilket gör att institutionella investerare kan spåra Bitcoins rättvisa pris exakt och säkert. I slutändan, ger tillgång till tre likviditetspooler/värderingspoäng under 14 timmar (jämfört med värderingspunkt och ett 8-timmarsfönster för alla andra ETFer och ETPer globalt).
BTC1 tar itu med de likviditetsutmaningar som institutionella investerare står inför med befintliga Bitcoin ETPer, som är begränsade till traditionella börstider. Med Bitcoin-handel dygnet runt och Bitcoin Futures-handel 23/5, erbjuder BTC1 institutionella investerare en global och reglerad spot Bitcoin ETP, med för närvarande den bredaste primära marknadslikviditeten för Bitcoin ETPer globalt. Detta utökade likviditetsfönster förbättrar pristransparens och riskhanteringsförmåga för institutionella investerare.
Chanchal Samadder, produktchef på ETC Group, kommenterade, BTC1 representerar en betydande milstolpe i utvecklingen av Bitcoin-investeringsprodukter. Designad med benchmarkmedvetna och långsiktiga investerare i åtanke, erbjuder BTC1 en unik blandning av kostnadseffektivitet, noggrannhet och utökad primärmarknadslikviditet, vilket sätter en ny standard på Bitcoin ETP-marknaden.
Banar kontinuerligt vägen som Tysklands första Crypto ETP-utgivare
Tim Bevan, VD kommenterade: På ETC Group vill vi driva kryptoinvesteringsbranschen framåt och lanseringen av BTC1 representerar ett unikt förslag. Med BTC1 tar vi ut den första globalt orienterade Bitcoin ETP på marknaden, med de utökade funktioner för likviditet och riskhantering som våra kunder behöver. Vi är stolta över att lansera ännu en marknad först och vi tror att BTC1 har potentialen att unikt betjäna institutionella investerare med klassens bästa egenskaper.
BTC1 kommer att kunna handlas på XETRA och många andra plattformar och kommer att läggas till HANetfs paneuropeiska ETP-distributionsplattform.
Nya tillägg till ETC Groups institutionella produktsortiment inkluderar ET32, den unika totalavkastningen Ethereum-satsning ETP kopplad till ett transparent insatsriktmärke, och DA20, den enda breda marknaden Crypto Basket ETP som spårar ett MSCI-riktmärke för digitala tillgångar bland de 20 bästa kryptovalutorna som det går att investera i.

iShares Lithium & Battery Producers UCITS ETF USD (Acc) (LITM ETF) med ISIN IE000WDG5795, försöker följa STOXX Global Lithium and Battery Producers-index. STOXX Global Lithium and Battery Producers index spårar de största företagen i världen som är aktiva inom prospektering och brytning av litium eller produktion av litiumbatterier.
Den börshandlade fondens TER (total cost ratio) uppgår till 0,55 procent p.a. iShares Lithium & Battery Producers UCITS ETF USD (Acc) är den enda ETF som följer STOXX Global Lithium and Battery Producers index. ETFen replikerar det underliggande indexets prestanda genom samplingsteknik (köper ett urval av de mest relevanta indexbeståndsdelarna). Utdelningarna i ETFen ackumuleras och återinvesteras.
Denna ETF lanserades den 31 oktober 2023 och har sin hemvist i Irland.
Varför LITM?
- Ger exponering för litiumindustrins tema genom litiumgruvarbetare, tillverkare av föreningar och tillverkare av litiumbatterier”
- Exponering för aktierelaterade värdepapper från kvalificerade utvecklade och tillväxtmarknader litiumindustrin temaföretag
- Syftar till att utesluta företag som klassificerats som icke-kompatibla av Sustainalytics Global Standards Screening (”GSS”), som tillhandahåller en bedömning av ett företags påverkan på intressenter och i vilken utsträckning ett företag orsakar, bidrar till eller är kopplat till brott mot internationella normer och standarder.
Investeringsmål
Fondens mål är att ge investerare en totalavkastning, med hänsyn till både kapital- och inkomstavkastning, vilket återspeglar avkastningen från STOXX Global Lithium and Battery Producers Index.
Handla LITM ETF
iShares Lithium & Battery Producers UCITS ETF USD (Acc) (LITM ETF) är en börshandlad fond (ETF) som handlas på Euronext Amsterdam.
Euronext Amsterdam är en marknad som få svenska banker och nätmäklare erbjuder access till, men DEGIRO gör det.
Börsnoteringar
| Börs | Valuta | Kortnamn |
| Euronext Amsterdam | USD | LITM |
Största innehav
| Kortnamn | Namn | Sektor | Vikt (%) | ISIN | Valuta |
| 6762 | TDK CORP | Informationsteknologi | 12.74 | JP3538800008 | JPY |
| ALB | ALBEMARLE CORP | Materials | 8.09 | US0126531013 | USD |
| PLS | PILBARA MINERALS LTD | Materials | 6.81 | AU000000PLS0 | AUD |
| 300750 | CONTEMPORARY AMPEREX TECHNOLOGY LT | Industri | 6.49 | CNE100003662 | CNY |
| 6758 | SONY GROUP CORP | Sällansköpsvaror | 5.95 | JP3435000009 | JPY |
| 6752 | PANASONIC HOLDINGS CORP | Sällansköpsvaror | 5.28 | JP3866800000 | JPY |
| 373220 | LG ENERGY SOLUTION LTD | Industri | 5.15 | KR7373220003 | KRW |
| 006400 | SAMSUNG SDI LTD | Informationsteknologi | 4.68 | KR7006400006 | KRW |
| SQM | SOCIEDAD QUIMICA Y MINERA DE CHILE | Industri | 4.13 | US8336351056 | USD |
| AKE | ALLKEM LTD | Materials | 3.35 |
Innehav kan komma att förändras

Regulatory Crackdowns and Ethereum’s Most Anticipated Application

ETC Group lanserar BTC1, En unik Core Bitcoin ETP

LITM ETF ger exponering mot litium och batterier

Ombalansering av Valour Digital Asset Basket 10 (VDAB10) inkluderar Toncoin och Shiba Inu Coin

Vad är en utdelnings-ETF?

ETFmarknaden i Europa firar sitt 24-årsjubileum med tillgångar på två biljoner USD

Tillgång till obligationsmarknaden för företagsobligationer från utvecklade marknader

FUIG ETF investerar i hållbara företagsobligationer som följer Parisavtalet

Vilken är den bästa fond som följer Nasdaq-100?

Försvarsfond når förvaltad volym på 500 MUSD
Populära
-

 Nyheter2 veckor sedan
ETFmarknaden i Europa firar sitt 24-årsjubileum med tillgångar på två biljoner USD
-

 Nyheter2 veckor sedan
Tillgång till obligationsmarknaden för företagsobligationer från utvecklade marknader
-

 Nyheter4 veckor sedan
FUIG ETF investerar i hållbara företagsobligationer som följer Parisavtalet
-

 Nyheter3 dagar sedan
Vilken är den bästa fond som följer Nasdaq-100?
-

 Nyheter3 veckor sedan
Försvarsfond når förvaltad volym på 500 MUSD
-
 Nyheter4 veckor sedan
Vad händer härnäst för Bitcoin?
-

 Nyheter4 veckor sedan
Ny börshandlad fond från Deka ger tillgång till S&P 500-index
-

 Nyheter3 dagar sedan
De mest populära börshandlade fonderna april 2024


