
Nyheter
ETC Group Crypto Market Compass #8 2024
• Last week, cryptoassets outperformed traditional assets by a very wide margin as Bitcoin reclaimed 50k USD in price and 1 trn USD in market cap again
• Our in-house “Cryptoasset Sentiment Index” has also continued to increase and still signals bullish sentiment
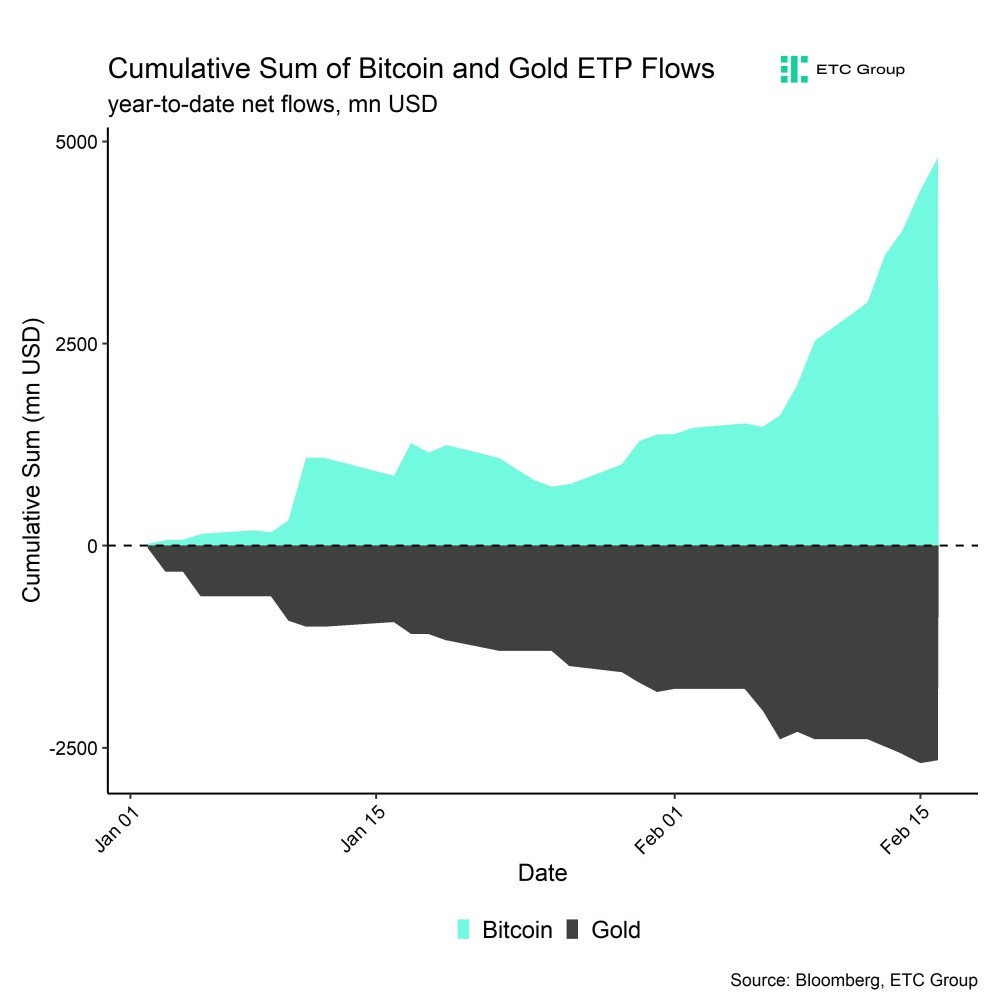
• There is an increasing divergence between global Bitcoin ETP inflows and Gold ETP outflows which might be an early sign for bitcoin stealing gold’s crown as the prime store-of-value
Chart of the Week
Performance
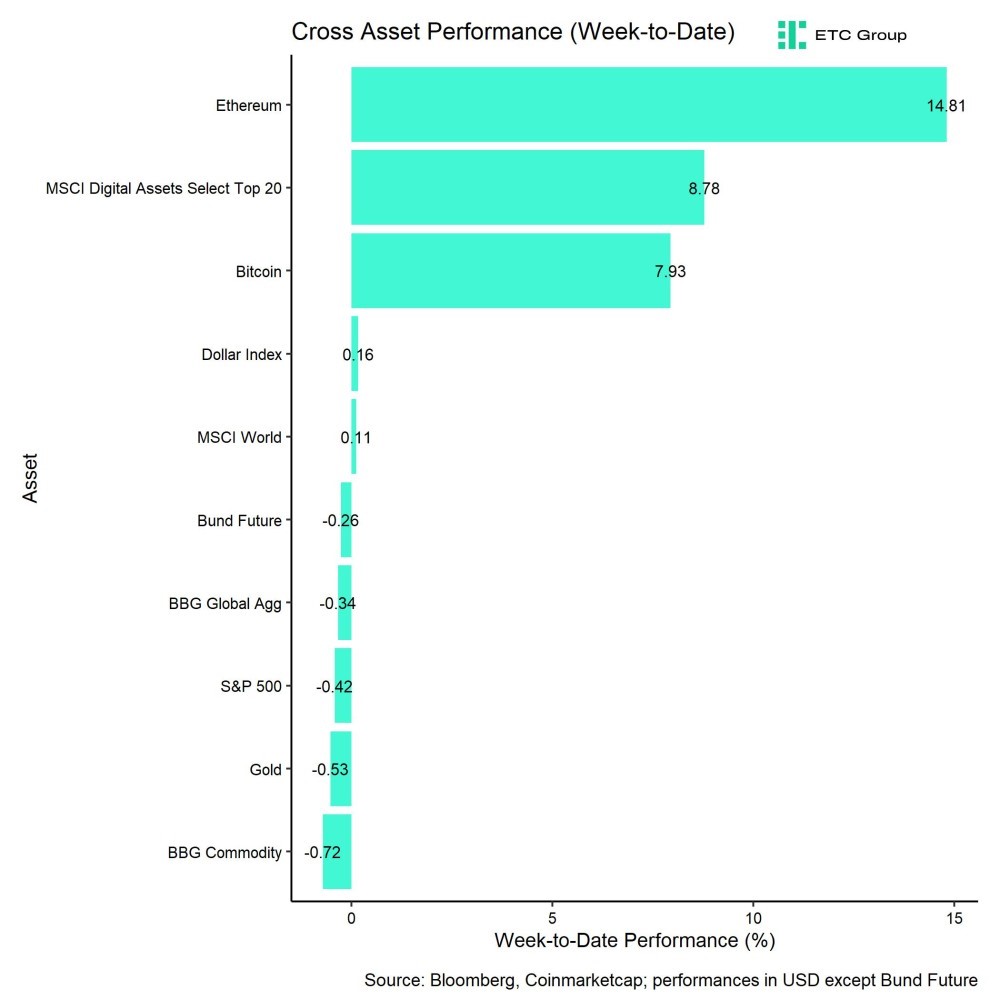
Last week, cryptoassets outperformed traditional assets like US equities or commodities by a very wide margin. In fact, while most major asset classes showed a negative performance last week, some major cryptoassets like Ethereum even posted double-digit returns. It appears as if cryptoassets are increasingly starting to decouple from the performance of traditional assets.
In this context, we are also observing an increasing divergence between global fund flows into Bitcoin ETPs and fund flows into global Gold ETPs (Chart-of-the-Week). While global Gold ETPs have seen net outflows or approximately -2.6 bn USD, global Bitcoin ETPs have attracted around +4.8 bn USD year-to-date, according to our own calculations based on Bloomberg data.
In general, we also expect this trend to continue, as our medium- to long-term expectation is that Bitcoin will ultimately disrupt Gold as the prime store-of-value. If that were the case, i.e. if Bitcoin had a similar market cap than Gold today (~13 trn USD), one single bitcoin would cost around ~600k USD which implies significant upside potential if this scenario continues to materialize.
What is more is that net inflows into Bitcoin ETPs have started to accelerate, as both outflows from Grayscale Bitcoin Trust (GBTC) have slowed down and inflows into other products have accelerated. According to a recent study by CryptoQuant, the large majority of new investments overall into Bitcoin appears to be related to investments into US ETFs. So, there is an increasing importance of those new ETF flows for Bitcoin’s performance.
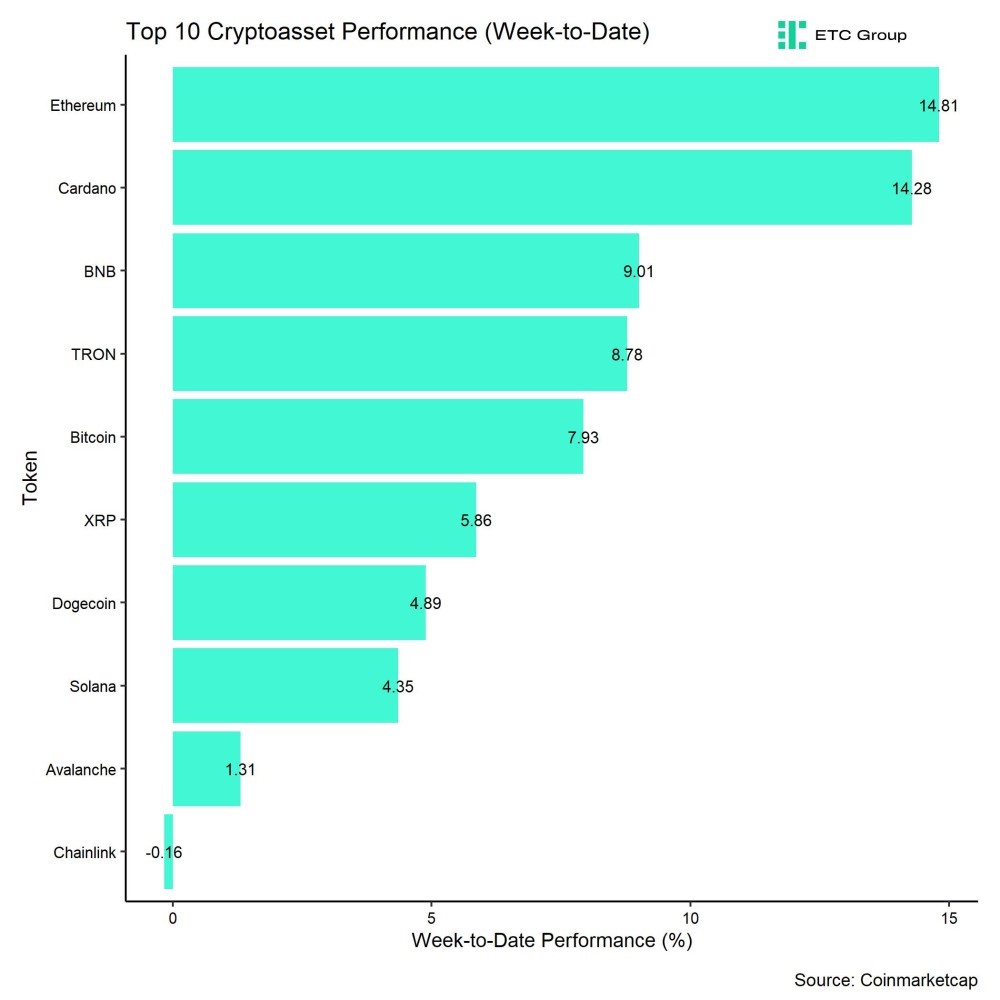
In general, among the top 10 crypto assets, Ethereum, Cardano, and Binance’s BNB token were the relative outperformers.
Overall altcoin outperformance vis-à-vis Bitcoin also picked up compared to the week prior, with 40% of our tracked altcoins managing to outperform Bitcoin on a weekly basis.
Sentiment
Our in-house “Cryptoasset Sentiment Index” has also continued to increase and still signals bullish sentiment.
At the moment, 13 out of 15 indicators are above their short-term trend.
High momentum in global crypto ETP flows as well as low BTC exchange inflows remain very supportive at the moment.
The Crypto Fear & Greed Index remains in ”Greed” territory as of this morning.
Meanwhile, our own measure of Cross Asset Risk Appetite (CARA) has also continued to increase as throughout the week which is signalling a positive sentiment in traditional financial markets.
Besides, performance dispersion among cryptoassets has increased again and remains relatively high.
In general, high performance dispersion among cryptoassets implies that correlations among cryptoassets are low, which means that cryptoassets are trading more on coin-specific factors.
At the same time, altcoin outperformance vis-à-vis Bitcoin has also increased, with a clear outperformance of Ethereum vis-à-vis Bitcoin last week. Viewed more broadly, around 40% of our tracked altcoins have outperformed Bitcoin on a weekly basis.
In general, increasing altcoin outperformance tends to be a sign of increasing risk appetite within cryptoasset markets.
Fund Flows
Overall, we saw very significant net fund inflows in the amount of +2292.1 mn USD (week ending Friday) based on Bloomberg data across all types of cryptoassets. In fact, we saw the highest weekly net inflows into cryptoasset ETPs year-to-date last week.
Global Bitcoin ETPs continued to see significant net inflows of +2261.1 mn USD of which +2273.4 mn (net) were related to US spot Bitcoin ETFs alone. The ETC Group Physical Bitcoin ETP (BTCE) saw net inflows equivalent to +12.1 mn USD last week.
The Grayscale Bitcoin Trust (GBTC) continued to see net outflows of around -624 mn USD last week albeit at a steady pace. This was more than offset by net inflows into other US spot Bitcoin ETFs.
Note that some fund flows data for US major issuers are still lacking in the abovementioned numbers due to T+2 settlement.
Apart from Bitcoin, we saw comparatively small flows into other cryptoassets last week again.
Inflows into global Ethereum ETPs picked up last week to around +27.2 mn USD. The ETC Group Physical Ethereum ETP (ZETH) attracted +1.3 mn USD in inflows. Besides, Altcoin ETPs ex Ethereum that managed to attract +4.7 mn USD last week.
In contrast, thematic & basket crypto ETPs continued to experience net outflows of -1.9 mn USD, based on our calculations. The ETC Group MSCI Digital Assets Select 20 ETP (DA20) did neither see in- nor outflows last week. (+/- 0 mn USD).
Besides, the beta of global crypto hedge funds to Bitcoin over the last 20 trading increased to around 1.0 which implies that global crypto hedge funds are currently positioned neutral to Bitcoin market risks.
On-Chain Data
On-Chain developments continue to support the positive performance at the moment. Global aggregate BTC exchange balances continue to drift lower and have just recently reached a new multi-year low.
In fact, we saw a very significant BTC exchange outflow today between 3:00 am and 4:00 am UTC during the Asian session when around -17,119 BTC were transferred out of exchange, most of which happened on Coinbase. Coinbase BTC exchange balances reached their lowest level since July 2015. These large downward spikes in exchange balances usually indicate institutional buying activity, as institutional investors usually keep their coins off the general exchange in so-called “cold storage”.
This is also supported by the observation that we saw net exchange outflows of -34.1k BTC last week only within the wallet cohort between 1 mn USD and 10 mn USD, so larger investors.
Another piece of evidence that also supports this is the fact that the overall number of BTC whales have skyrocketed recently and is now at the highest level in 3 years. In this context, whales are defined as the number of unique entities holding at least 1k bitcoins.
Whales continue to withdraw bitcoins from exchanges on a net basis. Based on our calculations, whales have been withdrawing around -5.8k BTC on average per day over the past week.
At the same time, some BTC on-chain analysts have pointed towards the fact that long-term holders have started distributing their supply already. In fact, long-term holder supply has been falling from 14.956 mn BTC at the beginning of the year to 14.659 mn BTC yesterday (-297k BTC net decline).
That being said, short-term holder supply has been increasing by around +366k BTC during the same period which implies a demand overhang by short-term holders.
Although this distribution by long-term holders is worth watching, it could simply be related to GBTC’s distributions of bitcoins while other new ETFs have started accumulating BTC.
Meanwhile, aggregate Ethereum (ETH) exchange balances also continued to drift downwards and are now near their multi-year lows as well.
Futures, Options & Perpetuals
Aggregate BTC futures open interest has remained fairly stable last week while CME futures open interest has increased only slightly by around +4k BTC.
Meanwhile, BTC perpetual open interest has even declined by around -12k BTC. This maybe related to the fact that we saw a significant increase in future short liquidations on Wednesday last week as bitcoin surpassed the 50k USD mark. Short liquidations were generally supportive of the latest increase in prices.
Besides, the 3-months annualized BTC futures basis continued to increase to around 14.4% p.a. and the BTC perpetual funding rate increased to the highest level since January 2nd across major derivatives exchanges.
BTC options’ open interest also increased last week by around +18k BTC. At the same time, the Put-call open interest also increased throughout the week implying that option traders continued to build up downside protections throughout the week. Put-call volume ratios were also somewhat elevated.
This observation seems to be supported by the fact that the 25-delta BTC option skew for 1 week expiries increased last week, albeit from low levels, which implies a relatively higher demand for put options. However, the skew for other expiries was mostly flat.
Option implied volatilities also increased again as realized volatility picked up with Bitcoin reaching multi-year highs. At the time of writing, BTC 1-month ATM implied volatilities are at around 55% on Deribit.
Bottom Line
• Last week, cryptoassets outperformed traditional assets by a very wide margin as Bitcoin reclaimed 50k USD in price and 1 trn USD in market cap again
• Our in-house “Cryptoasset Sentiment Index” has also continued to increase and still signals bullish sentiment
• There is an increasing divergence between global Bitcoin ETP inflows and Gold ETP outflows which might be an early sign for bitcoin stealing gold’s crown as the prime store-of-value
Disclaimer
Important Information
The information provided in this material is for informative purposes only and does not constitute investment advice, a recommendation or solicitation to conclude a transaction. This document (which may be in the form of a blogpost, research article, marketing brochure, press release, social media post, blog post, broadcast communication or similar instrument – we refer to this category of communications generally as a “document” for purposes of this disclaimer) is issued by ETC Issuance GmbH (the “issuer”), a limited company incorporated under the laws of Germany, having its corporate domicile in Germany. This document has been prepared in accordance with applicable laws and regulations (including those relating to financial promotions). If you are considering investing in any securities issued by ETC Group, including any securities described in this document, you should check with your broker or bank that securities issued by ETC Group are available in your jurisdiction and suitable for your investment profile.
Exchange-traded commodities/cryptocurrencies, or ETPs, are a highly volatile asset and performance is unpredictable. Past performance is not a reliable indicator of future performance. The market price of ETPs will vary and they do not offer a fixed income. The value of any investment in ETPs may be affected by exchange rate and underlying price movements. This document may contain forward-looking statements including statements regarding ETC Group’s belief or current expectations with regards to the performance of certain asset classes. Forward-looking statements are subject to certain risks, uncertainties and assumptions, and there can be no assurance that such statements will be accurate and actual results could differ materially. Therefore, you must not place undue reliance on forward-looking statements. This document does not constitute investment advice nor an offer for sale nor a solicitation of an offer to buy any product or make any investment. An investment in an ETC that is linked to cryptocurrency, such as those offered by ETC Group, is dependent on the performance of the underlying cryptocurrency, less costs, but it is not expected to match that performance precisely. ETPs involve numerous risks including, among others, general market risks relating to underlying adverse price movements and currency, liquidity, operational, legal, and regulatory risks.
For more details and the full disclaimer


India’s vibrant economy and structural growth opportunities continue to be the envy of many emerging markets. But somewhat unique to this market are tax implications that investors should be aware of. Our Franklin Templeton Global ETF team examines these structural issues in Asia’s third-largest economy.
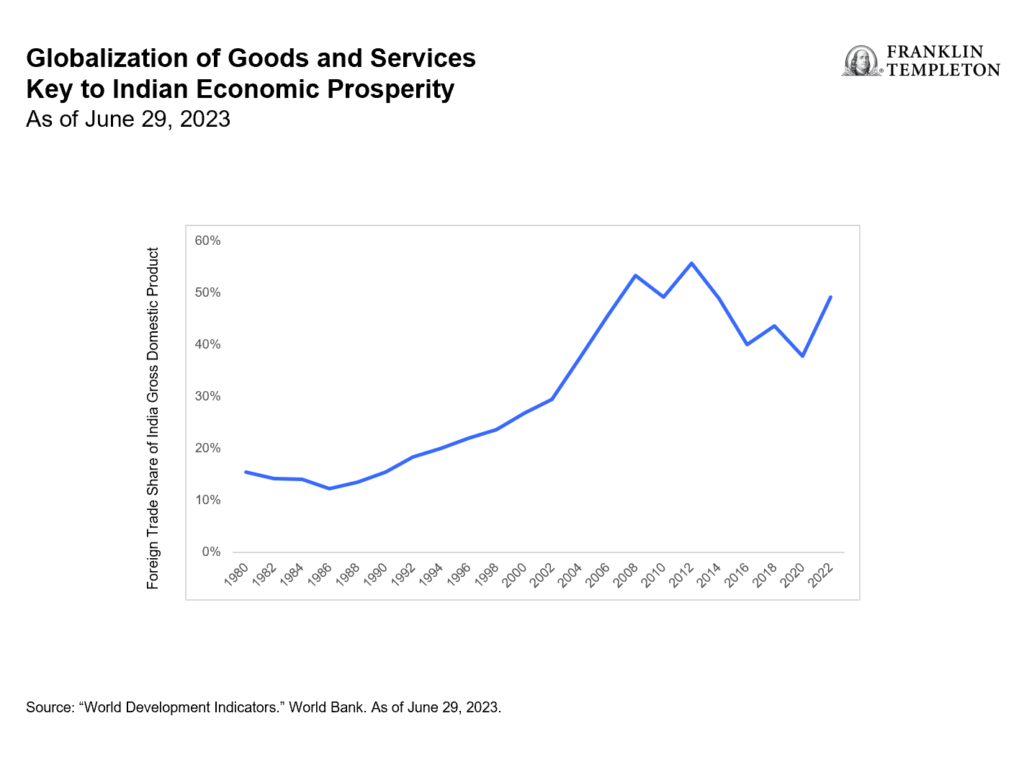
In merely a decade, India has taken a quantum leap from the world’s 11th largest economy to become its fifth largest. By many accounts, it is expected to remain one of the world’s fastest-growing major economies over the coming years. And even after a banner 2023 during which the country’s benchmark indexes surged and Indian Prime Minister Narendra Modi celebrated high-profile successes—from historic technological and space exploration achievements to rising global diplomatic clout—this election year has already marked more progress in supporting Modi’s pro-growth, pro-jobs efforts.
The world’s most populous nation has advanced ties with Western countries over free trade. In addition to agreements with Australia and the United Arab Emirates, it has worked to better integrate the “Global South’s” development needs and ambitions with that of the G20. Modi has touted innovative partnerships for a new multilateral rail and sea corridor to connect India with the Middle East and the European Union (EU)—seen as a counterweight to China’s vast Belt-and-Road infrastructure corridor.
India reached its latest notable trade pact, nearly 16 years in the making, in March with the European Free Trade Association—Iceland, Liechtenstein, Norway and Switzerland. The agreement lifts Indian tariffs to secure US$100 billion in foreign direct investment commitments from the non-EU markets to India across multiple sectors.
With India still an enviable investment powerhouse, it seems important to clarify a few aspects of this dynamic equity market.
How exchange-traded funds (ETFs) treat India capital gains tax (CGT)
Foreign investors should be aware that CGT is an integral part of investing in Indian equities that cannot be circumvented. Investors in India funds are subject to CGT implications regardless of fund provider, and CGT is based and calculated on a fund as a whole, not an individual investor’s position.
The details: Foreign investors owning local Indian stocks are subject to taxation on capital gains at a short-term rate of 15% for positions held for less than one year and at a long-term rate of 10% for positions held over one year.
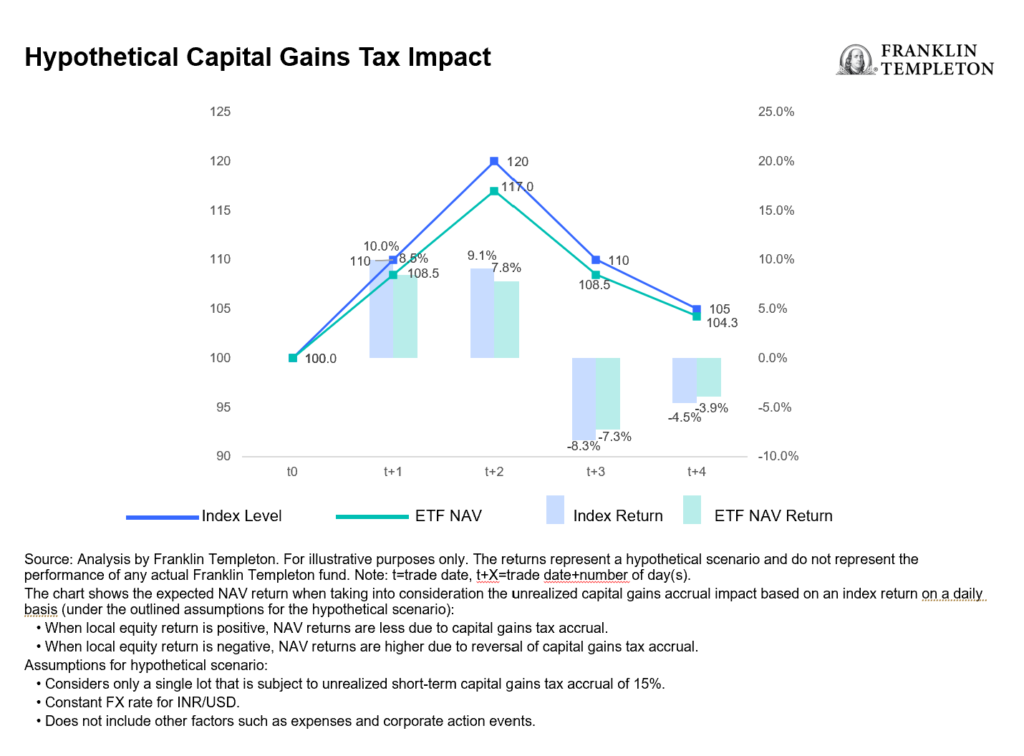
To accrue or not to accrue: Consistent with market practice for US-listed India ETF providers, Franklin Templeton accrues unrealized CGT in its daily net asset value (NAV). This can lead to differences in performance relative to the benchmark, which does not include CGT. As a result, rising markets will typically lead to fund underperformance against a benchmark, while weaker market environments will typically generate outperformance (provided the fund is in an unrealized capital gain position where the current market value of fund holdings is above their historical book cost). See chart below.
For UCITS-listed India funds, there is a divergence in methods utilized by fund providers in accruing and reporting CGT. Some do not accrue unrealized CGT in the NAV, but will charge CGT to investors directly at redemption, which we believe leaves investors with a level of opaqueness and uncertainty over their ultimate proceeds. This method also creates an elevated NAV compared to what investors will actually experience. While Franklin Templeton’s approach to CGT may at times lead to a higher tracking difference,1 we believe investors benefit from increased transparency and a more reflective experience.
The magnitude and impact of CGT for a specific fund is heavily dependent on several variables, such as the timing of purchases and sales, performance of the holdings and their volatility, and the size of flows in and out of the fund relative to its assets under management (AUM).
Understanding the impact: The CGT impact to fund performance is driven by the path of returns, timing of individual lots and price points. Very broadly speaking, in rising markets, an NAV-accruing fund will likely underperform its benchmark and vice versa.
Consideration of comparability: Because different providers handle CGT differently, the comparability of fund performance metrics may be affected. As investors, it’s prudent to consider how these nuances may influence investment decisions within the broader context of your financial strategy.
The bigger picture: While CGT considerations are important, they should be viewed within the broader spectrum of investment objectives and risk tolerance. Taking a long-term perspective and being mindful of other important characteristics of the investment vehicle of choice may aid in the decision-making process.
In summary, India remains an attractive investment destination with compelling growth prospects for its equity markets. Investors seeking India allocation through an ETF should be aware of the current tax regime and what varying methods of accounting methodologies really mean for fund valuation.


Vilken är den bästa fond som följer Nasdaq-100?

Inevitable in India: Crowds, cricket and capital gains tax

XB33 ETF köper företagsobligationer i euro som förfaller 2033

Ny ETF från Franklin Templeton investerar med katolska värderingar

Playing the AI revolution through commodities and gold’s curious rally

ETFmarknaden i Europa firar sitt 24-årsjubileum med tillgångar på två biljoner USD

De mest populära börshandlade fonderna mars 2024

Tillgång till obligationsmarknaden för företagsobligationer från utvecklade marknader

FUIG ETF investerar i hållbara företagsobligationer som följer Parisavtalet

Försvarsfond når förvaltad volym på 500 MUSD
-
 Nyheter2 veckor sedan
ETFmarknaden i Europa firar sitt 24-årsjubileum med tillgångar på två biljoner USD
-
 Nyheter4 veckor sedan
De mest populära börshandlade fonderna mars 2024
-
 Nyheter2 veckor sedan
Tillgång till obligationsmarknaden för företagsobligationer från utvecklade marknader
-
 Nyheter4 veckor sedan
FUIG ETF investerar i hållbara företagsobligationer som följer Parisavtalet
-
 Nyheter2 veckor sedan
Försvarsfond når förvaltad volym på 500 MUSD
-

 Nyheter4 veckor sedan
Vad händer härnäst för Bitcoin?
-
 Nyheter13 timmar sedan
Vilken är den bästa fond som följer Nasdaq-100?
-

 Nyheter3 veckor sedan
Ny börshandlad fond från Deka ger tillgång till S&P 500-index