
Nyheter
ETC Group Crypto Market Compass #13 2024
• Cryptoassets continued to be under pressure amid record outflows from global crypto ETPs
• Our in-house “Cryptoasset Sentiment Indicator” had declined significantly before reversing some of the declines more recently; The index is currently signalling neutral sentiment again
• Global crypto ETPs experienced the largest weekly net outflows ever recorded mainly driven by significant outflows from the Grayscale Bitcoin Trust (GBTC)
Chart of the Week
Performance
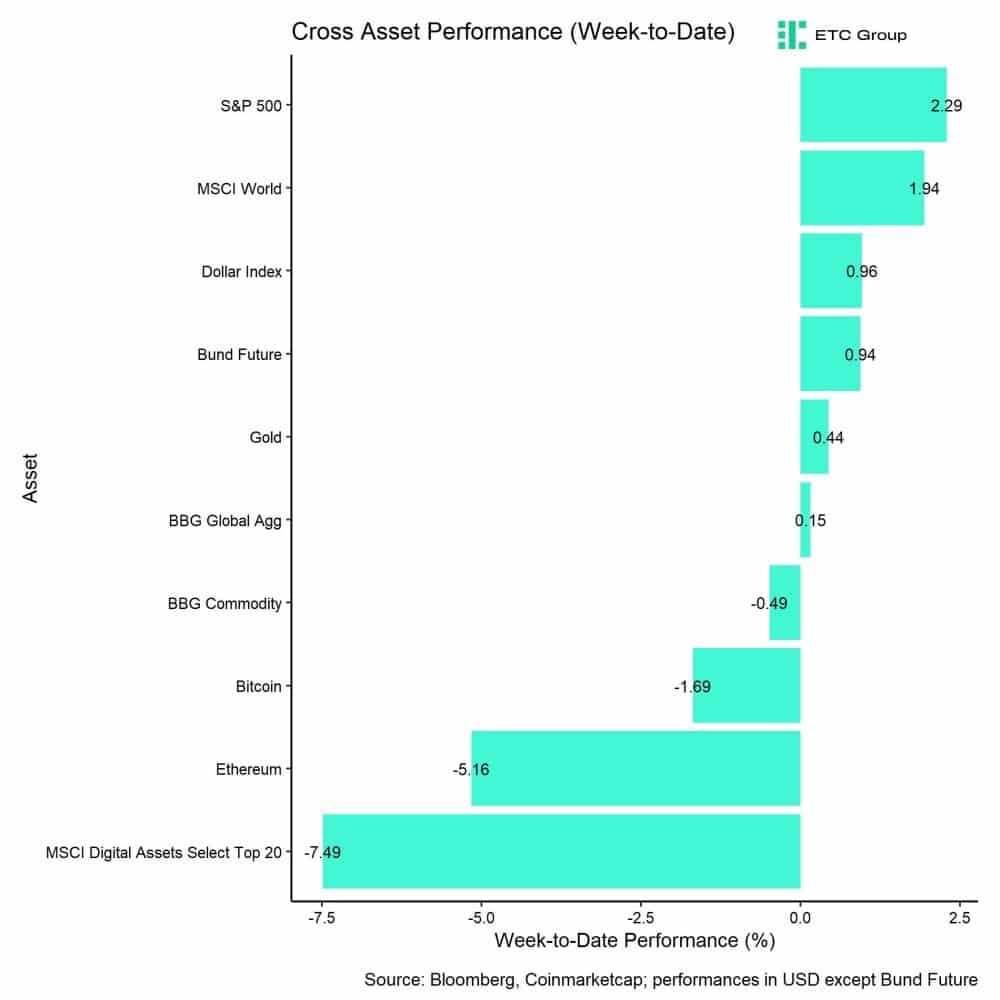
Last week, cryptoassets underperformed on account of increased net outflows from global Bitcoin ETPs. Last week, saw the highest weekly net outflows ever recorded and the steepest net outflows from US spot Bitcoin ETFs since trading launch.
However, most of these net outflows were concentrated in the Grayscale Bitcoin Trust (GBTC) in the US which saw more than -2 bn USD in net outflows last week while other US spot Bitcoin ETFs saw continued net inflows. Accelerating outflows from GBTC could be related to ongoing FTX or Genesis bankruptcy sales that are likely going to last only temporary.
Accelerating outflows from GBTC have clearly darkened market sentiment which had fallen to the lowest levels since January 2024 when outflows from GBTC had also worsened market sentiment.
Another factor that has contributed to a worsening sentiment in crypto markets were reports that the SEC is waging a campaign to classify Ethereum as a security.
This comes at a time when the final deadline for the approval of a spot Ethereum ETF by one of the issuers is approaching fast (23rd of May). The odds for an earlier approval by the end of May 2024 have plummeted to around 22% following these reports according to the betting website Polymarket.
The recent assessment of Ethereum by the SEC seems to be inconsistent with earlier regulatory action. The mere fact that the SEC had allowed Ethereum futures to trade on regulated exchanges was explicitly an acknowledgement that ETH is a non-security.
However, the fact that even the approval of the Bitcoin spot ETFs was a close call within the SEC (3 yea vs 2 nay) still induces a lot of uncertainty regarding the approval of the Ethereum spot ETF.
On a positive note, BlackRock has recently launched a digital asset fund (called “BUIDL”) based on the Ethereum blockchain that intends to invest into tokenized assets. This seems to be a major endorsement amid the ongoing investigations by the SEC.
Besides, the Fed decided to keep interest rates unchanged at its latest FOMC meeting which was generally interpreted as dovish forward guidance as the Fed still telegraphed around 3 rate cuts à 25 bps this year.
Meanwhile, some major central banks such as the SNB in Switzerland and the Banco de México in Mexico have already delivered their first rate cut in what appears to be an early start to a global rate cutting cycle which would be a significant tailwind for cryptoassets going forward.
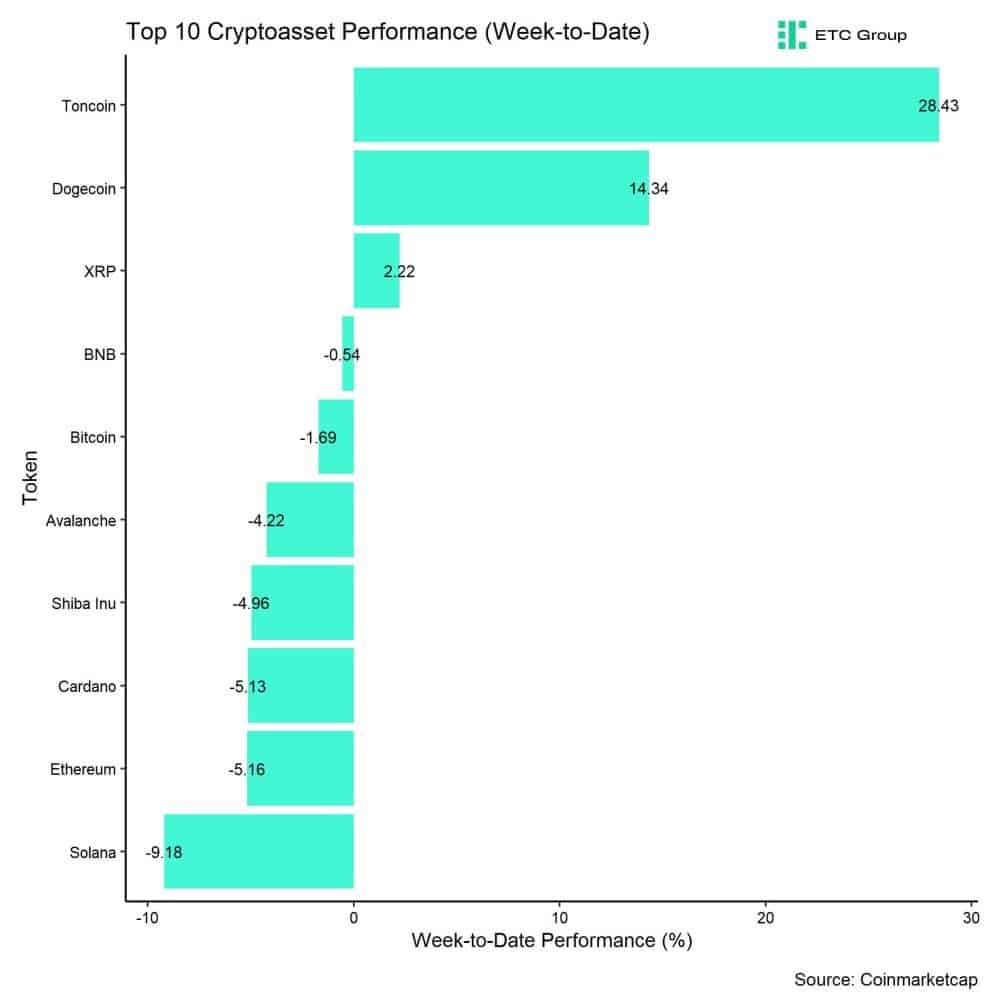
In general, among the top 10 crypto assets, Toncoin, Dogecoin, and XRP were the relative outperformers.
Overall altcoin outperformance vis-à-vis Bitcoin also picked up compared to the week prior, with around 60% of our tracked altcoins managing to outperform Bitcoin on a weekly basis.
Sentiment
Our in-house “Cryptoasset Sentiment Index” had declined significantly before reversing some of the declines more recently. The index is currently signalling neutral sentiment again.
At the moment, 10 out of 15 indicators are above their short-term trend.
There were significant reversals to the upside in BTC long futures liquidation dominance and the Altseason Index.
The Crypto Fear & Greed Index remains in ”Greed” territory as of this morning.
Besides, our own measure of Cross Asset Risk Appetite (CARA) has decreased throughout the week which signals diminishing bullish sentiment in traditional financial markets.
Performance dispersion among cryptoassets has continued to decline further amid the recent correction. However, overall performance dispersion still remains slightly elevated.
In general, high performance dispersion among cryptoassets implies that correlations among cryptoassets are low, which means that cryptoassets are trading more on coin-specific factors and that cryptoassets are increasingly decoupling from the performance of Bitcoin.
At the same time, altcoin outperformance vis-à-vis Bitcoin has recently picked up compared to the week prior, with around 60% of our tracked altcoins that have outperformed Bitcoin on a weekly basis. At the same time, there was a significant underperformance of Ethereum vis-à-vis Bitcoin last week.
In general, increasing altcoin outperformance tends to be a sign of increasing risk appetite within cryptoasset markets.
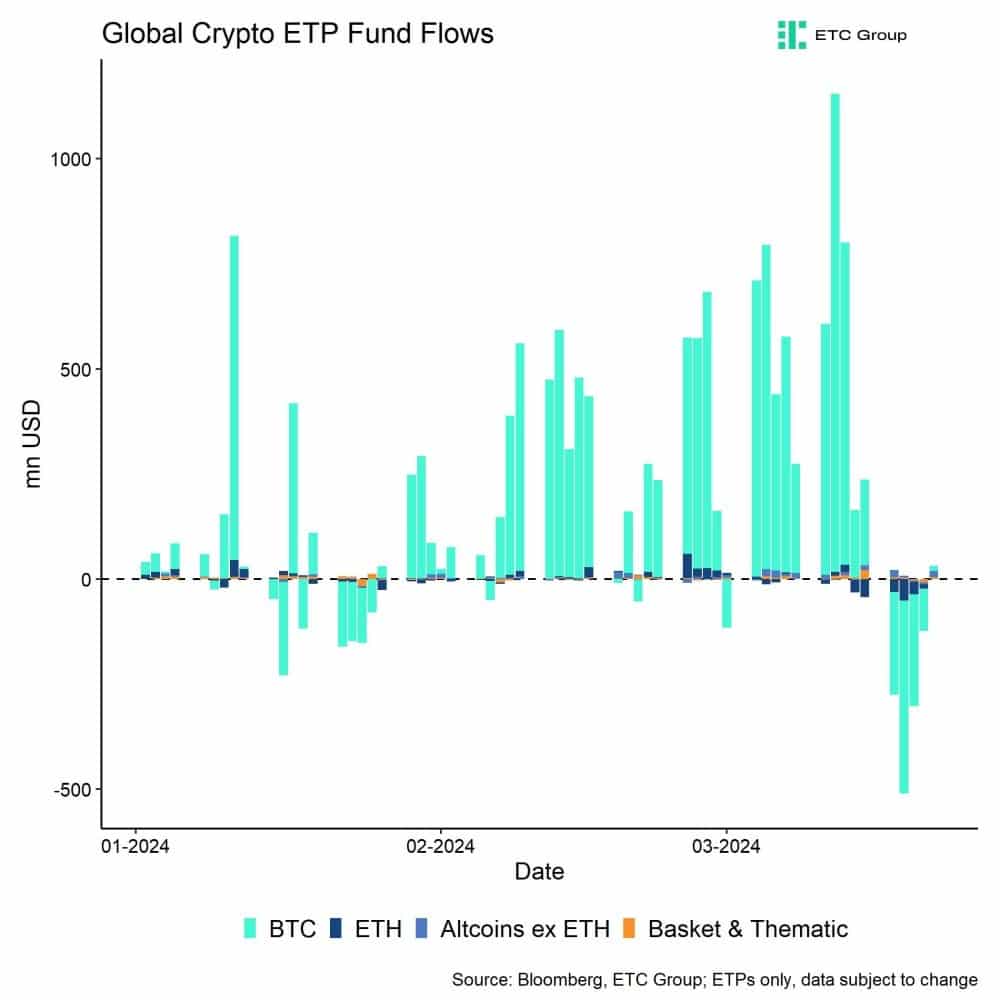
Fund Flows
Last week, we saw the highest weekly net outflows ever recorded across all types of products of around -1,153.3 mn USD (week ending Friday) based on Bloomberg data.
Global Bitcoin ETPs dominated with net outflows of -1,058.3 mn USD of which -887.7 mn (net) were related to US spot Bitcoin ETFs alone. In contrast, the ETC Group Physical Bitcoin ETP (BTCE) saw net inflows equivalent to +6.6 mn USD last week.
The Grayscale Bitcoin Trust (GBTC) experienced record net outflows of approximately -2,001.4 mn USD last week. However, other US spot Bitcoin ETFs even managed to attract +1,113 mn USD (ex GBTC).
Global Ethereum ETPs also saw significant net outflows last week of around -123.6 mn USD, which represents an acceleration of outflows compared to the week prior. Meanwhile, the ETC Group Physical Ethereum ETP (ZETH) had -3.9 mn USD in net outflows, while the ETC Group Ethereum Staking ETP (ET32) also experienced some net outflows (-3.3 mn USD) last week.
Besides, Altcoin ETPs ex Ethereum again managed to attract net inflows of around +29.9 mn USD last week.
In contrast, Thematic & basket crypto ETPs experienced minor net outflows of -1.3 mn USD, based on our calculations. The ETC Group MSCI Digital Assets Select 20 ETP (DA20) defied negative market trends with minor net inflows of around +0.4 mn USD last week.
Besides, the beta of global crypto hedge funds to Bitcoin over the last 20 trading remained at around 1.03 which implies that global crypto hedge funds have currently a neutral market exposure and are neither overweight nor underweight relative to the market.
On-Chain Data
Despite the recent consolidation below 70k USD in Bitcoin, coins continue to be taken off exchanges on a net basis as BTC exchange balances have recently reached a new multiyear low.
In contrast, Ethereum has seen a steady increase in exchange balances since the beginning of March which has exerted more downside pressure more recently.
We have recently observed some bearish BTC net transfers to exchanges from very large holders (> 10 mn USD wallet size) but mid-sized ($100k-$1M) to large holders ($1M-$10M) have continued to take coins off exchanges over the past week.
However, whale transfers to exchanges have recently turned slightly positive implying net sales by whales (entities that control at least 1,000 BTC) over the past week.
The cumulative volume delta (CVD), which measures the net difference between buying and selling trade volumes, was negative with around -910 mn USD in net selling volumes over the past week. Negative US spot Bitcoin ETF fund flows were certainly a major driver of this selling volume.
Ongoing consolidation appears to be relatively likely in the short term despite the upcoming Bitcoin Halving in April. The reason is that the positive effects from the Halving only become visible around 100 days after the Halving according to our latest analyses.
If the market was trading lower, we should find support in Bitcoin near 55.4k USD as the short-term holder’s cost basis is around that price level. Short-term holders tended to capitulate whenever the price dipped below their cost basis which should provide a solid basis for a continuation of the bull market.
Futures, Options & Perpetuals
Bitcoin futures traders reduced somewhat reduced their exposure during last week while perpetual open interest was mostly flat in BTC-terms. Futures open interest on the CME also decreased last week.
Futures long liquidations spiked last week on Tuesday above 100 mn USD according to data provided by Glassnode as Bitcoin dipped below 60k USD for a short period of time. Liquidations have levelled off significantly since then.
The Bitcoin futures basis also continued to decline from the recent highs observed at the beginning of March and was at around 21.2% p.a., at the time of writing this report.
The perpetual funding rate also mostly decreased last week and has only yesterday spiked as perpetual futures traders seem to have increased their exposure somewhat over the weekend.
In contrast, Bitcoin options’ open interest increased slightly last week. The Put-call open interest continued to decline compared to last week and is now at around 0.56 as option traders seem to unwind some of their downside hedges.
Put-call volume ratios spiked only briefly last week on Thursday in a sign of increased short-term risk aversion. For every BTC call traded, there were around 0.98 in puts traded on Thursday last week.
The 25-delta BTC 1-month option skew remained elevated but generally trended down as delta-equivalent calls were trading at a higher implied volatility than puts.
However, BTC option implied volatilities continued to come off the highs recorded at the beginning of March. Implied volatilities of 1-month ATM Bitcoin options are currently at around 70.9% p.a.
Bottom Line
• Cryptoassets continued to be under pressure amid record outflows from global crypto ETPs
• Our in-house “Cryptoasset Sentiment Indicator” had declined significantly before reversing some of the declines more recently; The index is currently signalling neutral sentiment again
• Global crypto ETPs experienced the largest weekly net outflows ever recorded mainly driven by significant outflows from the Grayscale Bitcoin Trust (GBTC)
Disclaimer
Important Information
The information provided in this material is for informative purposes only and does not constitute investment advice, a recommendation or solicitation to conclude a transaction. This document (which may be in the form of a blogpost, research article, marketing brochure, press release, social media post, blog post, broadcast communication or similar instrument – we refer to this category of communications generally as a “document” for purposes of this disclaimer) is issued by ETC Issuance GmbH (the “issuer”), a limited company incorporated under the laws of Germany, having its corporate domicile in Germany. This document has been prepared in accordance with applicable laws and regulations (including those relating to financial promotions). If you are considering investing in any securities issued by ETC Group, including any securities described in this document, you should check with your broker or bank that securities issued by ETC Group are available in your jurisdiction and suitable for your investment profile.
Exchange-traded commodities/cryptocurrencies, or ETPs, are a highly volatile asset and performance is unpredictable. Past performance is not a reliable indicator of future performance. The market price of ETPs will vary and they do not offer a fixed income. The value of any investment in ETPs may be affected by exchange rate and underlying price movements. This document may contain forward-looking statements including statements regarding ETC Group’s belief or current expectations with regards to the performance of certain asset classes. Forward-looking statements are subject to certain risks, uncertainties and assumptions, and there can be no assurance that such statements will be accurate and actual results could differ materially. Therefore, you must not place undue reliance on forward-looking statements. This document does not constitute investment advice nor an offer for sale nor a solicitation of an offer to buy any product or make any investment. An investment in an ETC that is linked to cryptocurrency, such as those offered by ETC Group, is dependent on the performance of the underlying cryptocurrency, less costs, but it is not expected to match that performance precisely. ETPs involve numerous risks including, among others, general market risks relating to underlying adverse price movements and currency, liquidity, operational, legal, and regulatory risks.


• Global crypto asset adoption rates are significantly higher than previously estimated.
• The data generally suggest that both the US and Europe may be at the cusp of mass retail adoption – a situation often referred to as “Hyperbitcoinization” in the context of Bitcoin.
• Chances are that the growth of adoption will surprise to the upside due to the fact that we are most likely at the inflection point from ”Early Adopters” to ”Early Majority”.
Trump recently made a public statement implying that 50 million Americans already held ”crypto”. The most recent surveys among US consumers seem to support this number.
It is no surprise that cryptoassets have become a major topic during the US presidential election as the parties have become increasingly aware that cryptoasset users could play a significant role at the ballot.
Both Trump and Robert Kennedy Jr. are scheduled to deliver a pro-Bitcoin speech at the upcoming Bitcoin conference in Nashville over the weekend.
It seems as if cryptoasset users are not a small minority anymore that can be ignored.
Here are some recent US bitcoin and crypto adoption surveys for comparison (% of total population in brackets):
• Security.org: 93 mn (28%)
• Unchained: 86 mn (26%)
• Statista: 53.6 mn (16%)
• Morning Consult: 44.2 mn (13%)
• Finder: 38.4 mn (11%)
In general, cryptoasset adoption has been on the rise globally.
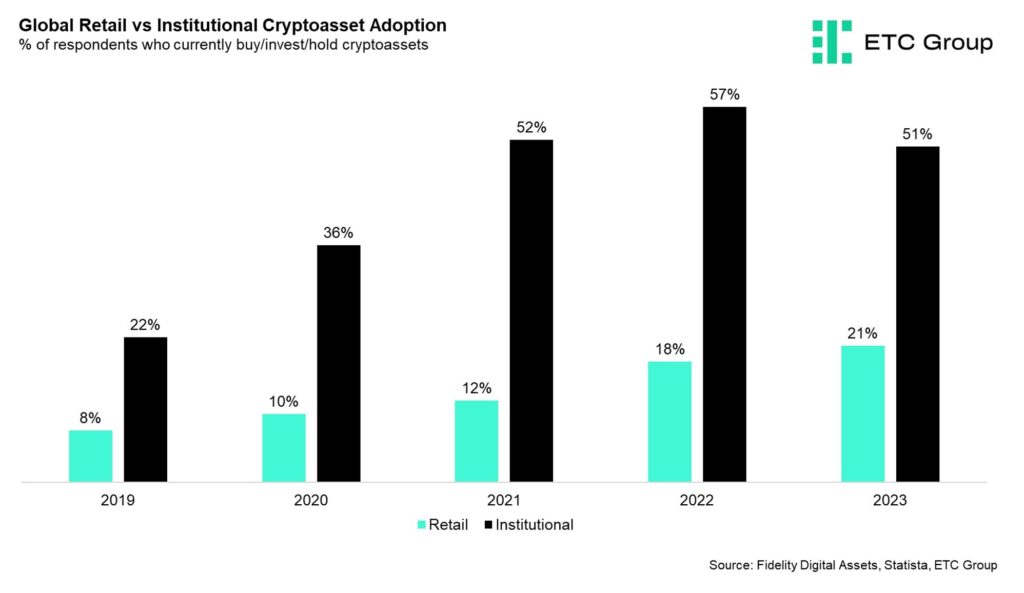
A recent global survey among institutional investors conducted by Fidelity even implies that 51% of surveyed institutional investors have already invested into cryptoassets such as Bitcoin.
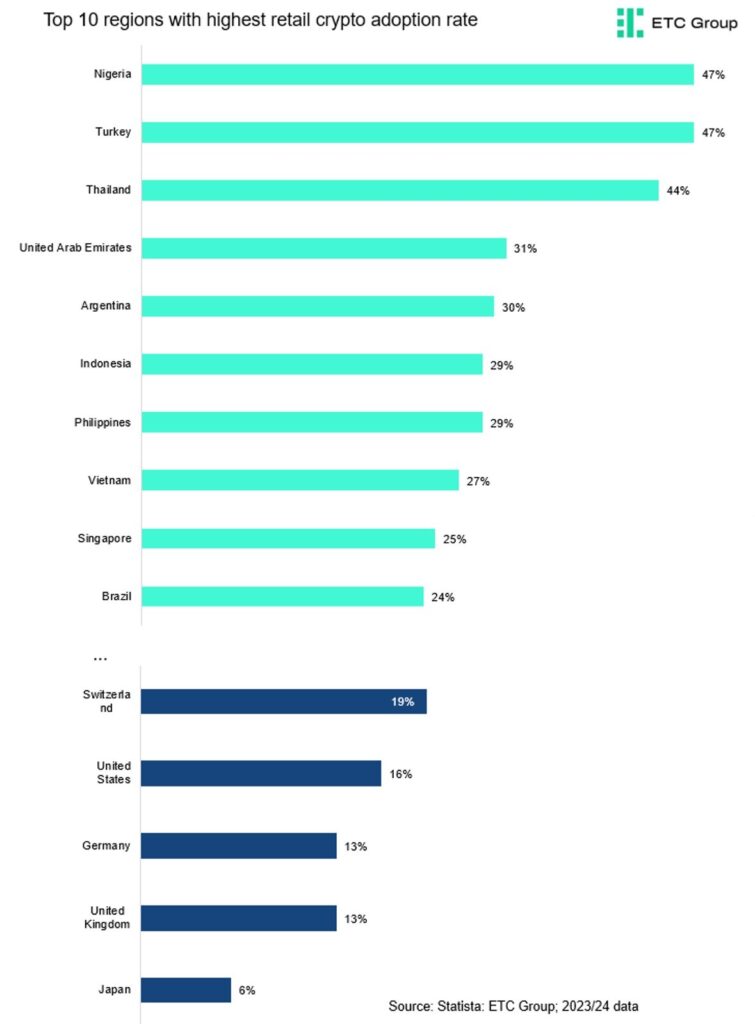
Another recent consumer survey by Statista implies that approximately every 5th person (21%) worldwide has already invested into cryptoassets.
However, it’s important to highlight that among the top 10 regions with the highest adoption rates, 8 regions are developing countries.
So, cryptoasset adoption rates are even significantly higher among developing countries than in developed countries that often suffer from chronically high inflation rates and weak domestic currencies.
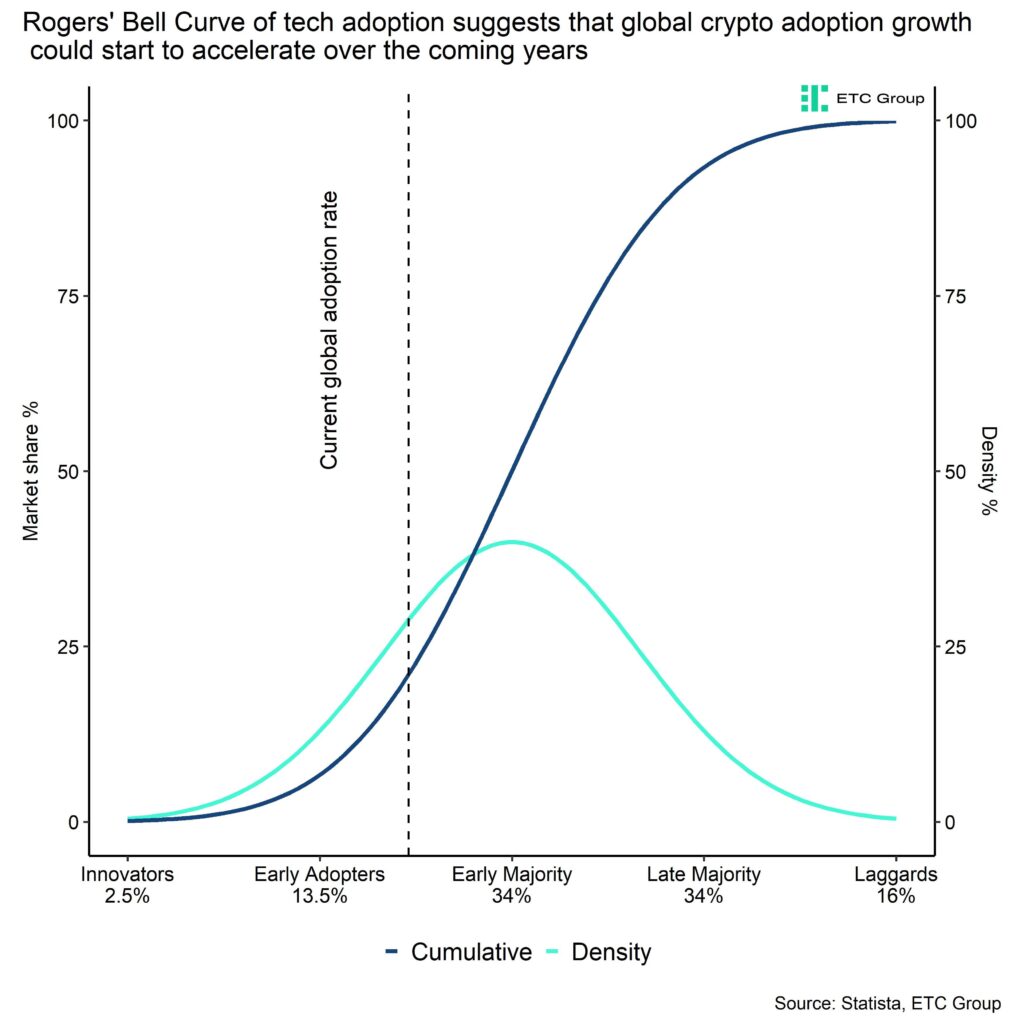
That being said, the data generally suggest that both the US and Europe may be at the cusp of mass retail adoption – a situation often referred to as “Hyperbitcoinization” in the context of Bitcoin.
The reason is that technological adoption in general tends to accelerate at the threshold from the so-called “early adopters” to the “early majority” which is around 16% adoption rate based on the model of technological adoption famously put forth by Rogers (1962).
Global adoption rates are already at 21% while adoption rates in the US and Europe are at around 16% and 14%, respectively. So, there is a strong case for an acceleration of adoption rates in these regions and globally over the coming years.
Recent political developments in the US also imply that Bitcoin and cryptoassets are gradually becoming mainstream.
Trump has recently endorsed domestic Bitcoin mining in the US and both Democrats and Republicans have started accepting crypto payments for campaign financing.
The big success of the spot Bitcoin ETFs this year and the fact that additional types of spot crypto ETFs are being launched marks a significant shift in sentiment among US regulators in this regard.
In short, chances are that the growth of adoption will surprise to the upside due to the fact that we are most-likely at the inflection point from ”Early Adopters” to ”Early Majority”.
Bottom Line
• Global crypto asset adoption rates are significantly higher than previously estimated.
• The data generally suggest that both the US and Europe may be at the cusp of mass retail adoption – a situation often referred to as “Hyperbitcoinization” in the context of Bitcoin.
• Chances are that the growth of adoption will surprise to the upside due to the fact that we are most likely at the inflection point from ”Early Adopters” to ”Early Majority”.
To read more about suitable investment solutions by ETC Group, please click the button below:

This is not investment advice. Capital at risk. Read the full disclaimer
© ETC Group 2019-2024 | All rights reserved


Are we about to enter “Hyperbitcoinization”?

Investera i Optimism med en börshandlad produkt

JPGH ETF investerar i amerikanska tillväxtaktier

Bitcoin as a hedge against geopolitical risks?

DFND ETF investerar i flyg- och försvarsindustrin

Vilka var juni månads populäraste EFTer?

Harwood Capital Management samarbetar med HANetf för att lansera sin första UCITS ETF

Att tajma marknaden är en förlorande strategi

Börshandlade fonder ser inflöden på mer än en halv miljon troy ounce platina

The Bitcoin Macro Investor
-
 Nyheter4 veckor sedan
Vilka var juni månads populäraste EFTer?
-
 Nyheter1 vecka sedan
Harwood Capital Management samarbetar med HANetf för att lansera sin första UCITS ETF
-
 Nyheter2 veckor sedan
Att tajma marknaden är en förlorande strategi
-
 Nyheter3 veckor sedan
Börshandlade fonder ser inflöden på mer än en halv miljon troy ounce platina
-
 Nyheter3 veckor sedan
The Bitcoin Macro Investor
-

 Nyheter4 veckor sedan
Investera i koppar med hjälp av börshandlade produkter
-
 Nyheter3 veckor sedan
CETH ETP en börshandlad produkt på Ethereum som ger staking intäkter
-

 Nyheter4 veckor sedan
Syntetiska börshandlade fonder: Vad det är, hur det fungerar