
Nyheter
Bitcoin Survives Bear Trap
Bitcoin has witnessed some heavy price turbulence after breaking the $71K mark in early June. Since then, it lost almost 21% in value scraping the key level of $55K in the first week of July.
Figure 1 – Bitcoin Price
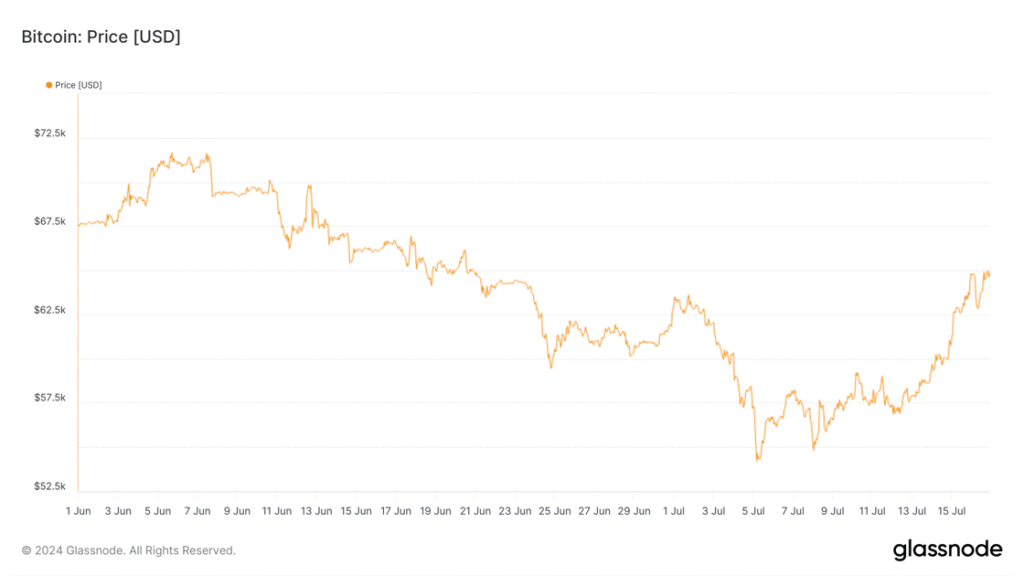
Source: Glassnode
However, since last Friday, Bitcoin has gained $7K and is now trading around the $64K mark. But why has it been such a turbulent time for Bitcoin?
Factors Contributing to the Selling Pressure
• Bitcoin Miner Activity
• German Government Sell-Offs
• Mt. Gox Repayment Program & Bitcoin Exchange Liquidity
Bitcoin Miner Activity
The BTC selling pressure was earmarked by miner activity, after selling 30K BTC in June. This sell-off marked miners’ BTC reserves at the lowest in a decade, just over 1.8K BTC.
Figure 2 – Bitcoin Miner Balance’
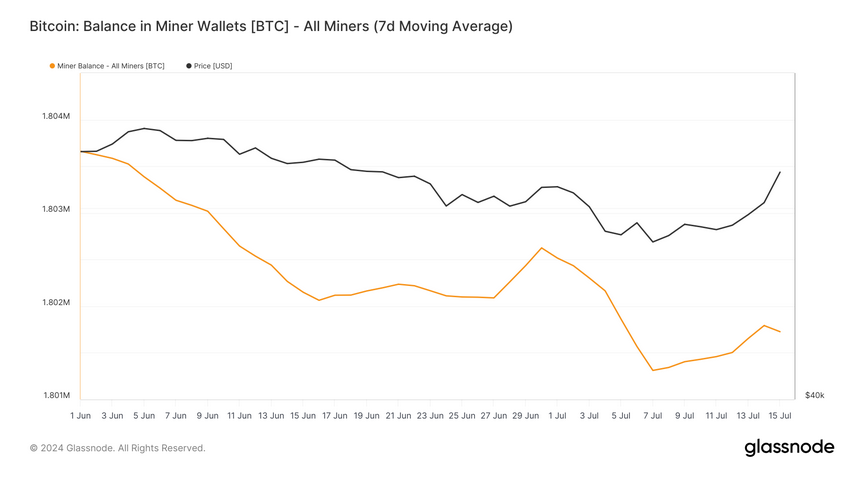
Source: Glassnode
Miners have however reduced their activity on-exchange, which should calm fears further. In June, miners were moving an average of around 50 BTC or just under $3M per day to exchanges, which has now slowed down, as shown below.
Figure 3 – Bitcoin Transfer Volume from Miners to Exchanges
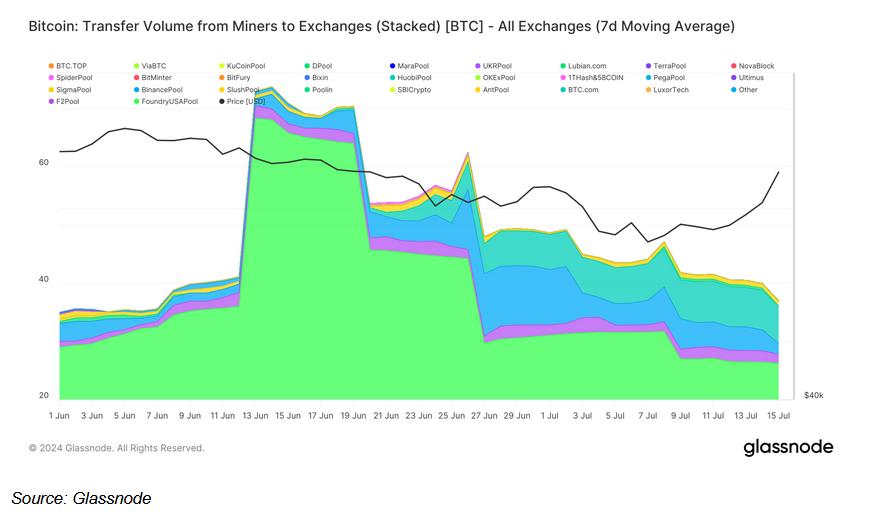
Source: Glassnode
On top of that, on-chain data shows the 30-day moving average of Bitcoin’s hash rate is starting to close the gap with the 60-day moving average, for the first time since May. This indicates miners are experiencing lower income stress, which typically signals a market bottom.
Figure 4 – Bitcoin’s Hash Ribbon Indicator
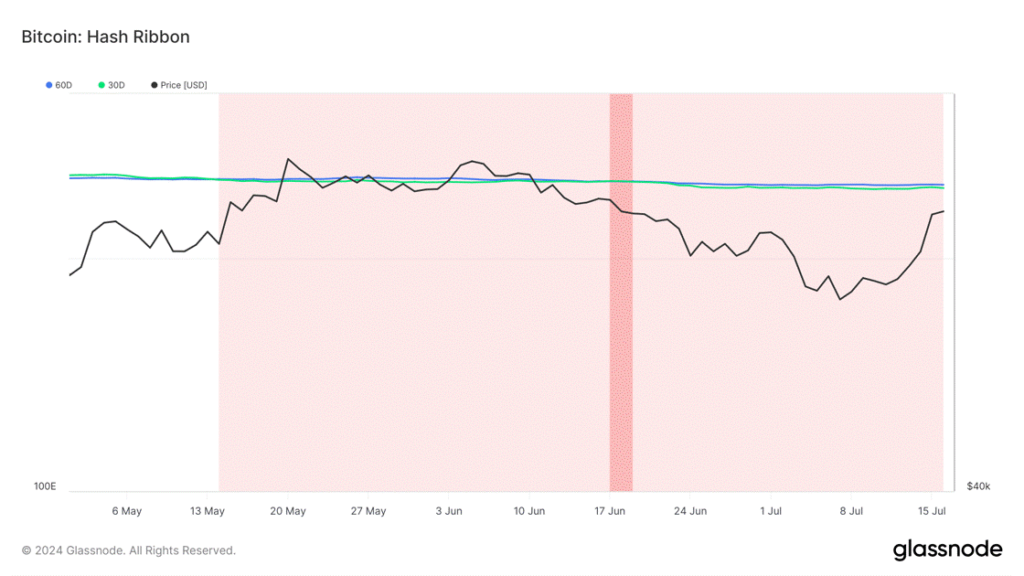
Source: Glassnode
As a result, miner reserves have slowly started to pick back up, as shown in the first figure. This could indicate that the miner sell-offs post-halving, due to reduced profitability, have tapered off which is another reason to be cautiously positive.
German Government Sell-Offs
The German Goverment had been in the process of completing the sale of 50K BTC seized from a pirating website, Movie2k, which was worth approximately $3B when the sell-offs started.
Figure 5 – German Government Holdings
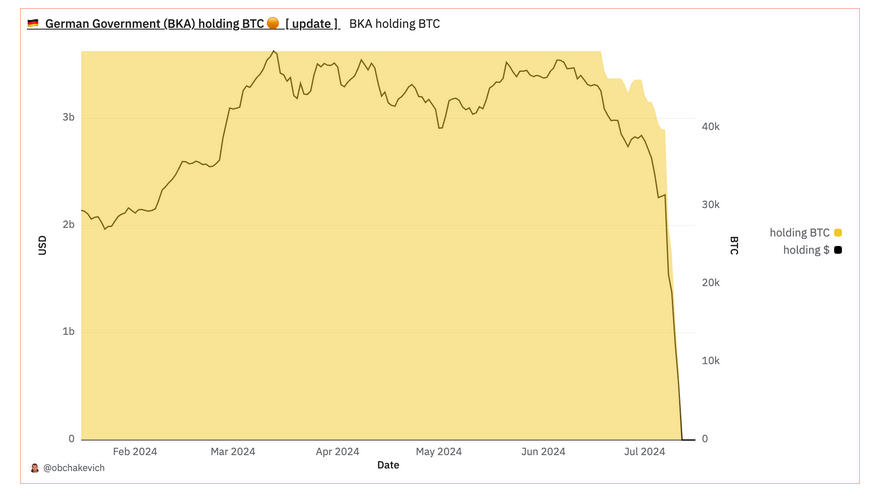
Source: @obchakevich on Dune Analytics
Bitcoin had a shaky June and July. However, in the week Germany sold almost 80% of their holdings, 40K BTC or $2.2B worth, Bitcoin’s price remained fairly resilient, a testament to its strength in adverse market conditions. That being said, according to data from Arkham Intelligence, the German Government engaged via OTC trades, to minimize potential slippage and market impact.
Figure 6 – Bitcoin Price (7 July – 14 July)
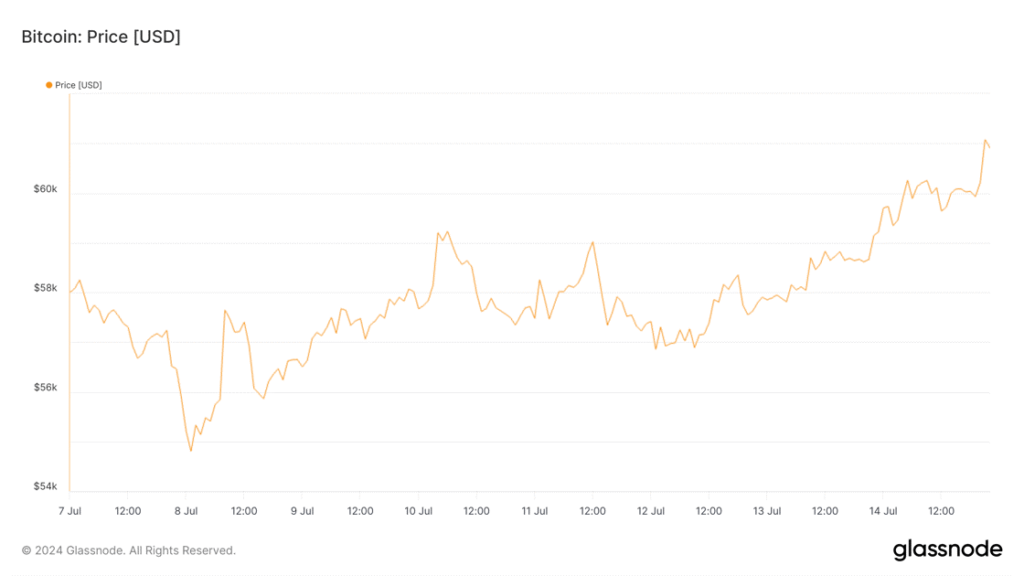
Source: Glassnode
Nevertheless, the conclusion of these sell-offs is positive for Bitcoin, as it removes a significant dark cloud from the market, and demonstrates the asset’s resilience.
Mt. Gox Repayment Program
However, Bitcoin faces selling pressure due to the upcoming Mt. Gox repayment program. Starting in July 2024, Mt. Gox began repaying approximately $9B worth of assets to its creditors, who have been waiting for over a decade since the exchange’s collapse in 2014.
Figure 7 – Mt. Gox Holdings
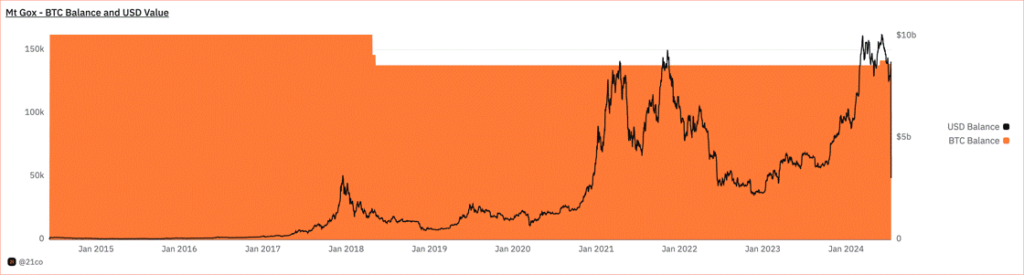
Source: @21co on Dune Analytics
Of the approximate 142K BTC held by Mt. Gox, 139K BTC is left to be reimbursed, equating to approximately 2% being paid back as of today, indicating a slow sale rate. However, yesterday Mt. Gox shuffled almost 96K BTC between their wallets, which contributed to the renewed FUD, as they prepare to distribute the reimbursements. While the repayment sum is very large, it is unlikely that these creditors will sell off their BTC immediately, given their long-term belief in the crypto industry given their involvement a decade ago, and the potential capital gains tax implications associated with the asset. The selling pressure is further diluted by the fact that reimbursements will likely occur on different days across different exchanges.
Bitcoin Exchange Liquidity
Despite, Bitcoin’s apparent survival. Let’s take a closer look at how the remaining BTC could affect the market. 139K BTC or $8.93B worth remains for Mt. Gox to restore to creditors, who may end up selling their assets. To gauge the market impact of this, it may help to look at Bitcoin’s liquidity on exchange. Presuming they aim to sell their BTC, the sell-offs will likely occur by trading with a fiat pair (BTC/USD) or a stablecoin pair (BTC/USDT or BTC/USDC). The top 5 most liquid exchanges are listed below, with their respective liquidity depths in dollar and BTC terms (assuming July’s average price of $59K).
Figure 8 – Centralized Exchange % Depth
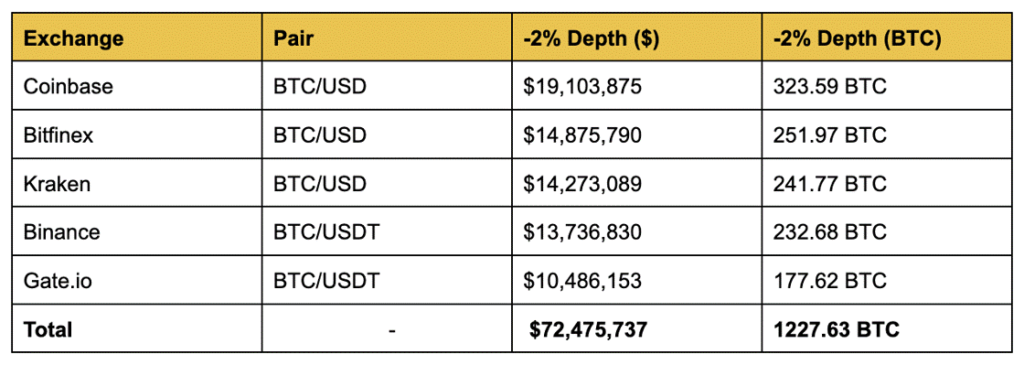
Source: Coingecko
As to not mitigate the market impact, the sell-offs are likely to occur across several exchanges. The five most liquid exchanges need around $72M outflows, on a given day to have a 2% downward price swing. The potential sell-offs are contingent on creditors finally receiving their assets from Mt. Gox, which is happening very slowly. Furthermore, it is doubtful that once received, they will sell all their BTC immediately, and as such any price action is largely resulting from the negative market sentiment associated with this event.
On-Chain Metrics
Despite the negativity surrounding the market, looking on-chain could help uncover dynamics that might make investors feel positive, and we propose 3 different indicators to look at.
The Market Value to Realized Value Ratio (MVRV) is a metric that assesses Bitcoin’s market valuation relative to its realized value, helping identify market tops and bottoms.
A high MVRV indicates overvaluation and a potential market top, while a low score indicates undervaluation and a potential market bottom.
Figure 9 – Bitcoin MVRV Score
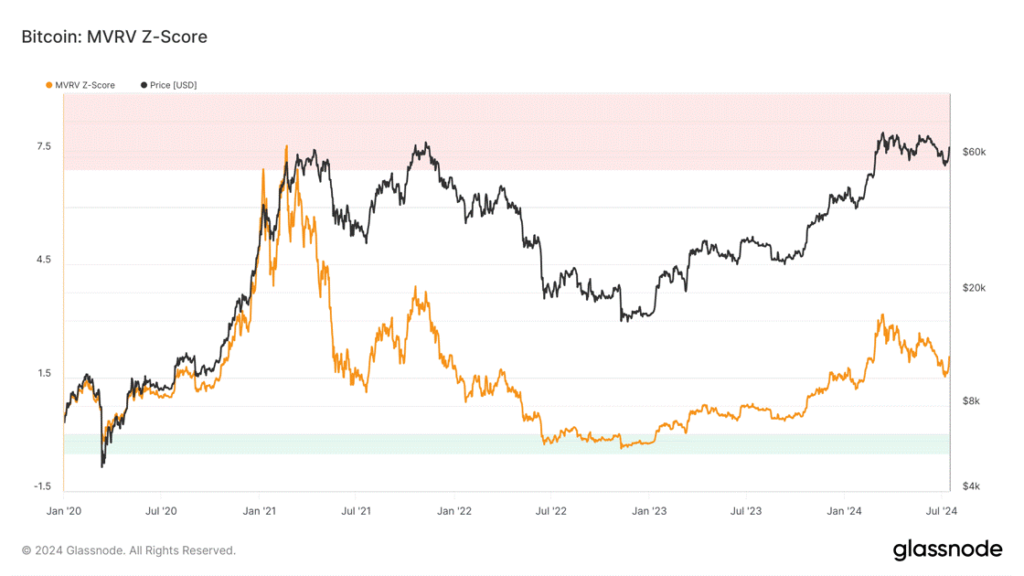
Source: Glassnode
The current MVRV is around levels seen at the end of December 2020, just before Bitcoin rallied from $11K to around the $60K mark. This is also similar to the levels seen towards the end of last year, before the ETF craze which drove Bitcoin to a new all-time high of $75K in early March. Given these historical precedents, this MVRV level suggests a potential for significant upside, making it an opportune time for investors to consider entering the market.
Net Unrealized Profit/Loss (NUPL) indicates the difference between investors’ unrealized profits and losses to assess market sentiment, with positive values suggesting profit-dominant sentiment and negative values indicating loss-dominant sentiment.
This metric is another reason for positivity. Currently, Bitcoin’s NUPL is in the optimism/denial phase, indicating moderate unrealized profits among investors. This suggests that market sentiment is cautiously optimistic, after recent price stagnations led NUPL to drop, and belief to be wiped away. That being said, this is a healthy consolidation for the asset and potentially allows it to spur on.
Figure 10 – Bitcoin Net Unrealized Profit/Loss
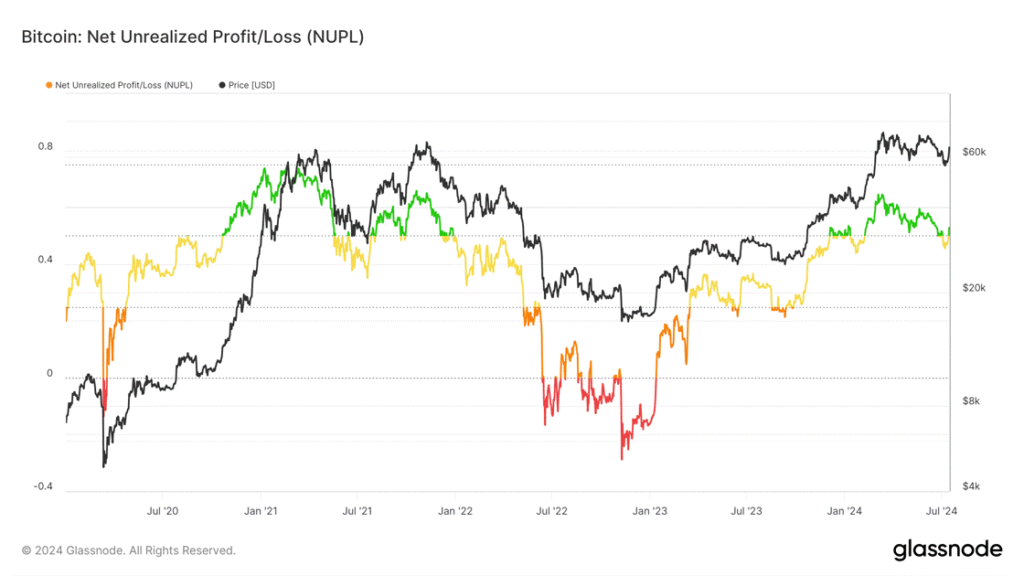
Source: Glassnode
- Fear and Greed Index measures market sentiment, with values ranging from 0 (extreme fear) to 100 (extreme greed). It helps investors gauge whether the market is overly bearish or bullish, indicating potential buying or selling opportunities.
Figure 11 – Bitcoin Fear and Greed Index
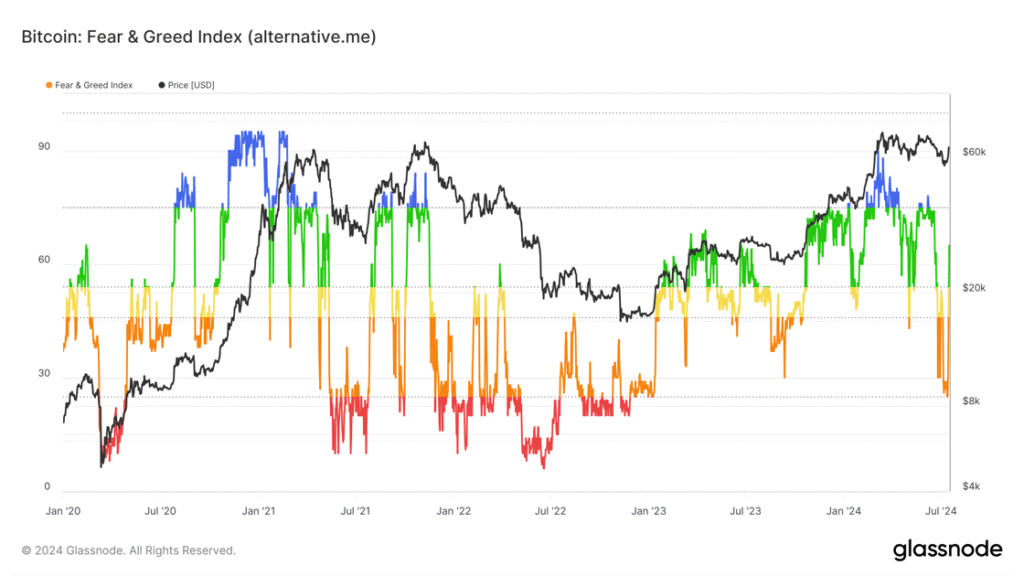
Source: Glassnode
The Bitcoin Fear and Greed Index was often in the ‘Fear’ region during June and early July. However, this was a positive sign, as it was near levels we had not seen since September 2023, when the asset was trading at $26K, which preceded a historical price rally. Over the weekend, the Fear and Greed Index sprung to Greed levels, suggesting we might be on track for another parabolic run.
Conclusions
• Bitcoin’s turbulence has stemmed from significant selling pressures, particularly the Mt. Gox repayment program.
o The impact of these sell-offs is moderated by Bitcoin’s strong exchange liquidity and potential ETF inflows.
• The dark cloud of the German Government sell-offs is out of the way.
• On-chain metrics suggest the potential for a bullish reversal, indicating now might be an opportune time for investors to consider entering the market.
For investors looking to invest in Bitcoin via a regulated investment vehicle, the following ETPs are available on the European market:
Figure 12 – Top 10 European Bitcoin Products by Assets Under Management Product Ticker

Source: Bloomberg, Data as of July 16th, 2024.
Avg. Daily Spread 20D (bps): refers to the best daily average bid/ask spread over the last 20 days across European exchanges.
This Week’s Calendar
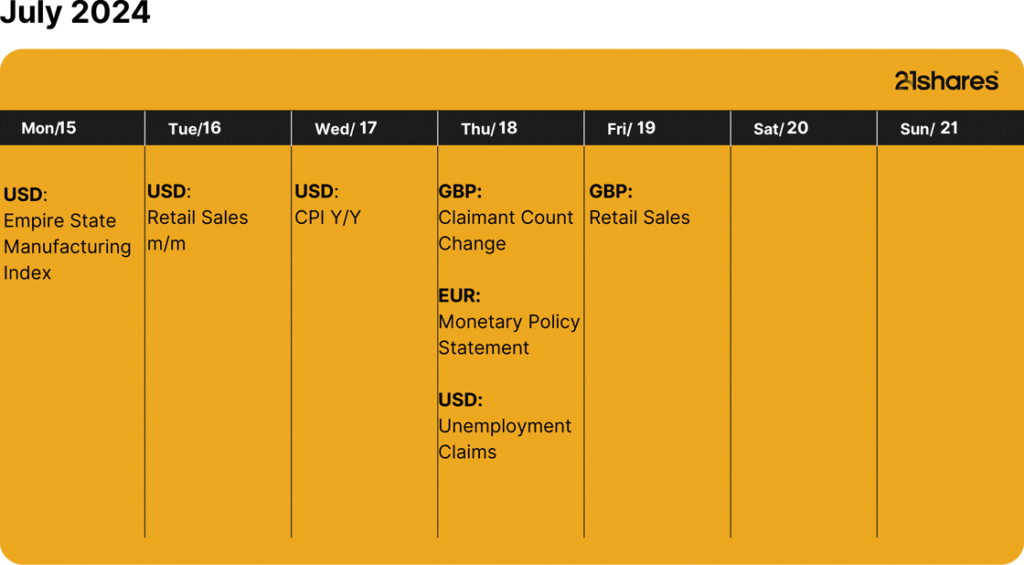
Source: Forex Factory, 21Shares
Research Newsletter
Each week the 21Shares Research team will publish our data-driven insights into the crypto asset world through this newsletter. Please direct any comments, questions, and words of feedback to research@21shares.com
Disclaimer
The information provided does not constitute a prospectus or other offering material and does not contain or constitute an offer to sell or a solicitation of any offer to buy securities in any jurisdiction. Some of the information published herein may contain forward-looking statements. Readers are cautioned that any such forward-looking statements are not guarantees of future performance and involve risks and uncertainties and that actual results may differ materially from those in the forward-looking statements as a result of various factors. The information contained herein may not be considered as economic, legal, tax or other advice and users are cautioned to base investment decisions or other decisions solely on the content hereof.


Nya ETF- och ETP-noteringar den 18 juni 2026 på Deutsche Börse

HYHE ETF följer utvecklingen av högavkastande företagsobligationer

Middlefield ser möjligheter inom kanadensisk energi, fastigheter och finans

WDAF ETF investerar i Asiens försvarsindustri
BlackRock utökar tillgången till systematisk aktiv investering för europeiska investerare

USA satsar 2 miljarder dollar på kvantdatorer – så kan investerare dra nytta av utvecklingen

Extrema skillnader: Varför presterar Europas kvantdator-ETFer så olika?

Fastställd utdelning i MONTDIV maj 2026

QQCC ETF följer företag världen över som är aktiva inom kvantberäkning

Varför Plus500 är en dröm för finans-affiliate
-
 Nyheter4 veckor sedan
USA satsar 2 miljarder dollar på kvantdatorer – så kan investerare dra nytta av utvecklingen
-
 Nyheter2 veckor sedan
Extrema skillnader: Varför presterar Europas kvantdator-ETFer så olika?
-
 Nyheter4 veckor sedan
Fastställd utdelning i MONTDIV maj 2026
-
 Nyheter3 veckor sedan
QQCC ETF följer företag världen över som är aktiva inom kvantberäkning
-
 Nyheter3 veckor sedan
Varför Plus500 är en dröm för finans-affiliate
-

 Nyheter3 veckor sedan
ETFer för fotbolls-VM 2026
-

 Nyheter3 veckor sedan
21shares produkter nu finns tillgängliga hos Revolut
-

 Nyheter5 dagar sedan
Den osynliga flaskhalsen i AI-boomen: Varför elinfrastruktur är nästa stora megatrend