
Nyheter
Is the Bitcoin Halving already priced in?
• We expect the Bitcoin Halving to occur on the 20th April at around 18:20 GMT assuming an average block time of around 10 minutes
• Bitcoin Halvings are best understood as supply shock – historical Halving events were followed by very significant price appreciations in the past
• The quantitative analysis suggests that the performance differences 100 days after the Halving are so significant that it is unlikely to be random; we conclude that the Halving is most likely not “priced in”
The historical track record
The Bitcoin Halving is probably the most anticipated event in Bitcoin and cryptoassets in general.
As the name suggests, the block subsidy, that is the reward miners receive for finding the right hash and secure the blockchain, will be cut in half at that event.
In other words, the supply growth of bitcoins will decline by -50%.
The Halving is an essential feature of the Bitcoin protocol that not only ensures a decreasing disinflationary supply growth schedule but also ultimately ensures that the Bitcoin circulating supply will converge towards a maximum of 21 million coins.
We already had 3 Halvings in the past since the genesis of Bitcoin which happened in 2012, 2016, and 2020, respectively.
These Halvings saw the block subsidy cut in half from initially 50 BTC to 25 BTC, from 25 BTC to 12.5 BTC, and from 12.5 BTC to 6.125 BTC now.
At the time of writing, we expect the Bitcoin Halving to occur around the 20th of April 2024 at around 19:20 GMT, assuming an average block time of 10 minutes.
At that time, the Bitcoin block subsidy will be reduced by -50% again, from 6.25 BTC to 3.125 BTC.
As Bitcoin blocks get mined approximately every 10 minutes, this implies that the daily supply issuance of bitcoins will fall from ~900 BTC to ~450 BTC per day.
The Bitcoin Halving is best thought of as a supply shock.
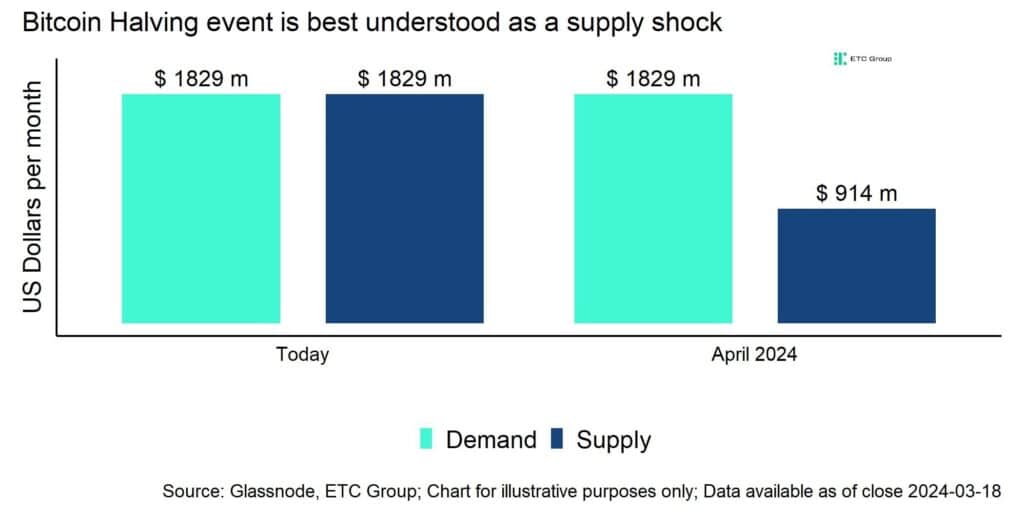
Assuming a constant flow of demand for bitcoins, the reduction in the supply flow of bitcoins should theoretically lead to a higher equilibrium price for bitcoins – prices need to adjust higher to accommodate the lower flow of supply.
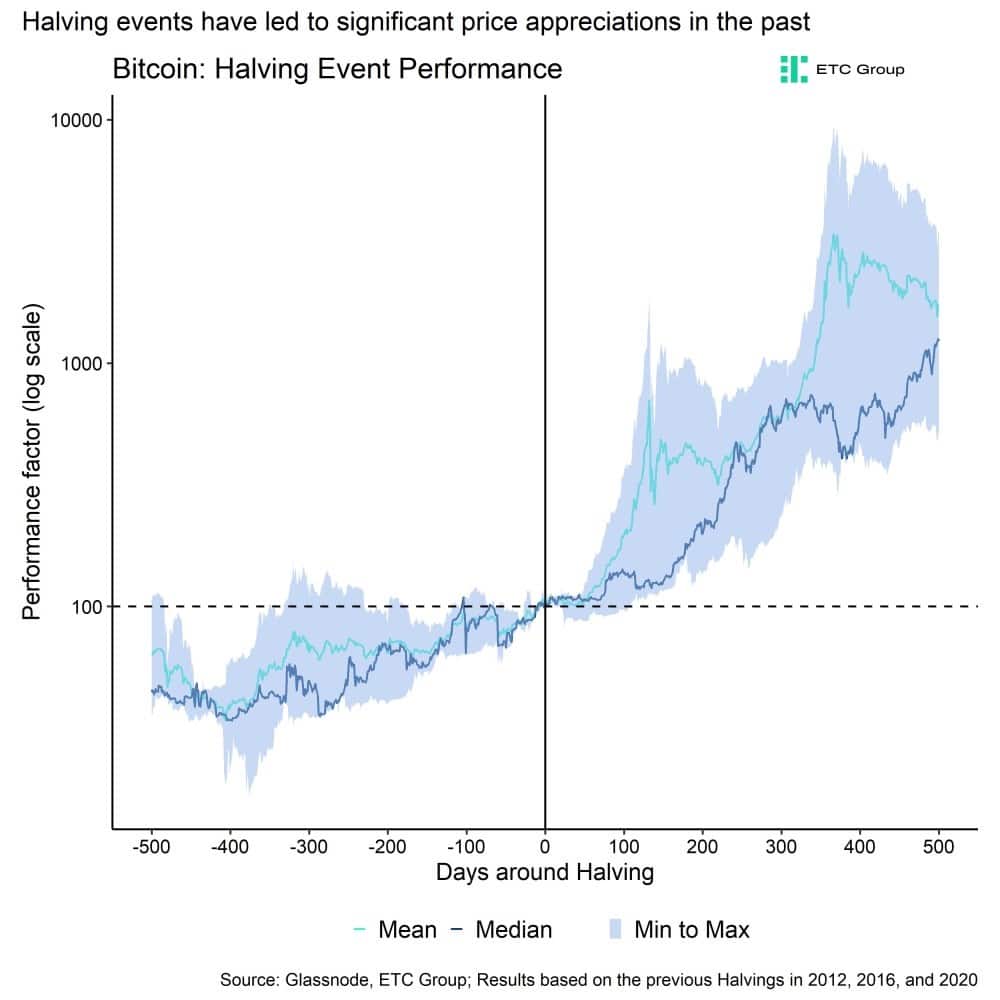
In fact, historical Bitcoin Halvings were followed by a very significant increase in the price of Bitcoin in the months following the event.
More specifically, the post-Halving performance of Bitcoin was around ~17x (~1800%) 500 days after the Halving averaged across the last 3 Halvings.
Is the Bitcoin Halving priced in?
Traditional investors are usually puzzled by the significant post-Halving performance in the past and tend to think that the upcoming Halving is already priced in.
The reason is that the dominant Efficient Market Hypothesis assumes that any public information should be immediately reflected in the price. Since the Halving date and the effect are publicly known, the logic goes that this and subsequent Halving events should already be reflected in the price in advance, i.e. “priced in”.
We tried to analyse this question by asking the following question:
If the Bitcoin Halving was not significant, then there should be no significant performance difference X days after the Halving date relative to X days before the Halving date?
The following bar chart shows the respective performance differences in the upper panel while the lower panel shows the respective T-value of those performance differences.
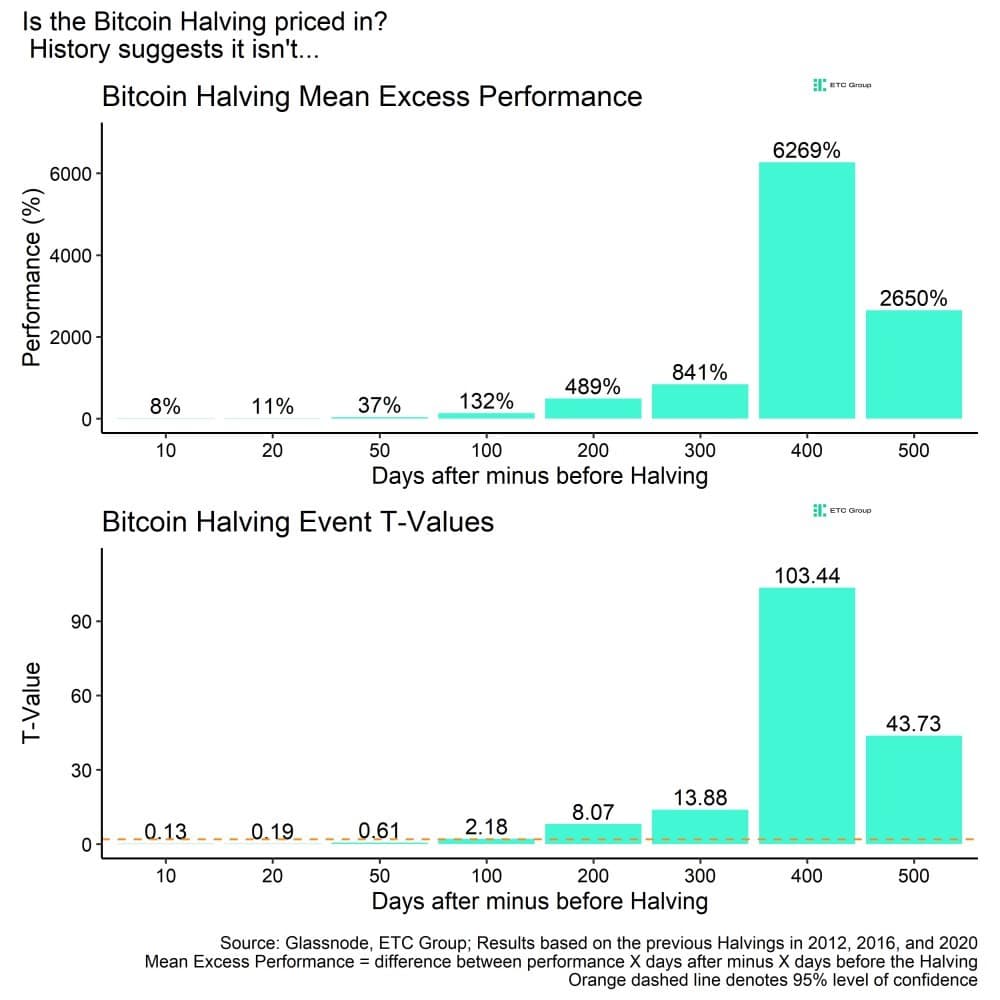
Here are some key observations from the analysis:
• There has been no significant performance difference until around 100 days after the Halving
• After 100 days following the Halving, performance differences become increasingly statistically significant
• The performance effect of the Halving tends to be highest at 400 days after the Halving
The results suggest that the performance difference after 100 days after the Halving has been so significant that it is unlikely to be random and pure coincidence.
These observations are also consistent with the fundamental on-chain mechanics that happen around the Halving.
If the price increased in anticipation of the Halving, Bitcoin miners would start selling more than their daily mined supply which would in turn suppress the price again. After the Halving, Bitcoin miners will be limited to sell more bitcoins by the decrease in block subsidy which is why the price will find a higher equilibrium.
In fact, we tend to see increased selling by miners, i.e. miners selling even more than the mine on a daily basis, whenever prices increased above their average marginal cost of production. However, this amount of selling cannot be sustained after Halving.
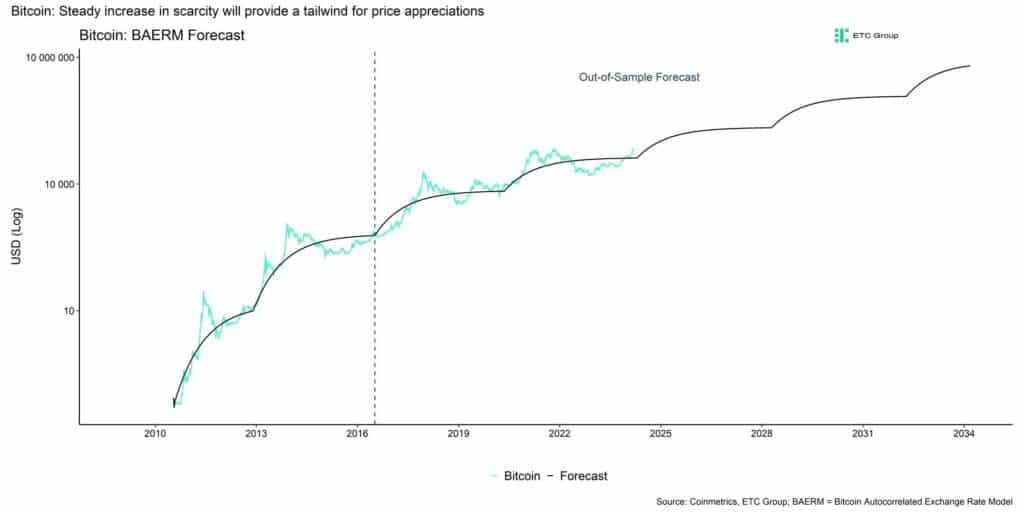
In general, we still expect prices to converge to a higher equilibrium price in 2024 et seqq. due to the positive effect of the Halving and increasing scarcity.
More specifically, our model suggests that Bitcoin’s equilibrium price could increase to 103k USD by the end of 2024, to 172k USD by the end of 2025 and ultimately to 215k USD by the end of the next Bitcoin epoch in 2028.
–> We therefore conclude that the Bitcoin Halving is most likely not priced in.
This model also assumes that the effect from the Halving will not be visible immediately but will be reflected gradually over time as the supply deficit induced by the Halving itself accumulates only gradually over time.
This model even factors in the fact that the effect from every Halving is bound to marginally decrease over time, unlike the stock-to-flow that assumes that the effect of the Halving is increasing exponentially with every Halving. Thus, the abovementioned estimates are rather conservative.
Bottom Line
• We expect the Bitcoin Halving to occur on the 20th April at around 18:20 GMT assuming an average block time of around 10 minutes
• Bitcoin Halvings are best understood as supply shock – historical Halving events were followed by very significant price appreciations in the past
• The quantitative analysis suggests that the performance differences 100 days after the Halving are so significant that it is unlikely to be random; we conclude that the Halving is most likely not “priced in”
Disclaimer
Important Information
The information provided in this material is for informative purposes only and does not constitute investment advice, a recommendation or solicitation to conclude a transaction. This document (which may be in the form of a blogpost, research article, marketing brochure, press release, social media post, blog post, broadcast communication or similar instrument – we refer to this category of communications generally as a “document” for purposes of this disclaimer) is issued by ETC Issuance GmbH (the “issuer”), a limited company incorporated under the laws of Germany, having its corporate domicile in Germany. This document has been prepared in accordance with applicable laws and regulations (including those relating to financial promotions). If you are considering investing in any securities issued by ETC Group, including any securities described in this document, you should check with your broker or bank that securities issued by ETC Group are available in your jurisdiction and suitable for your investment profile.
Exchange-traded commodities/cryptocurrencies, or ETPs, are a highly volatile asset and performance is unpredictable. Past performance is not a reliable indicator of future performance. The market price of ETPs will vary and they do not offer a fixed income. The value of any investment in ETPs may be affected by exchange rate and underlying price movements. This document may contain forward-looking statements including statements regarding ETC Group’s belief or current expectations with regards to the performance of certain asset classes. Forward-looking statements are subject to certain risks, uncertainties and assumptions, and there can be no assurance that such statements will be accurate and actual results could differ materially. Therefore, you must not place undue reliance on forward-looking statements. This document does not constitute investment advice nor an offer for sale nor a solicitation of an offer to buy any product or make any investment. An investment in an ETC that is linked to cryptocurrency, such as those offered by ETC Group, is dependent on the performance of the underlying cryptocurrency, less costs, but it is not expected to match that performance precisely. ETPs involve numerous risks including, among others, general market risks relating to underlying adverse price movements and currency, liquidity, operational, legal, and regulatory risks.


AFDE ETF ger exponering mot statsobligationer som följer inflationen

Franklin Templeton noterar fyra sektor-ETFer med låg kostnad på Xetra

CBUM ETF följer de största amerikanska företagen som valts ut enligt ESG-kriterier
UBS noterar råvarustrategi som drar nytta av skillnaderna i olika index

B29I ETF är en ackumulerande fond som köper företagsobligationer med förfall 2029

Invesco on Iran war: Prudent response is to stay invested

Boreas satsning på innovativa, tematiska investeringar

Are you quantum ready?

HANetf säger att drönare är den försvarssektor du inte kan ignorera

Månadsutdelande fonder fortsätter att locka investerarna mest
-
 Nyheter4 veckor sedan
Invesco on Iran war: Prudent response is to stay invested
-
 Nyheter2 veckor sedan
Boreas satsning på innovativa, tematiska investeringar
-
 Nyheter4 veckor sedan
Are you quantum ready?
-
 Nyheter3 veckor sedan
HANetf säger att drönare är den försvarssektor du inte kan ignorera
-
 Nyheter2 veckor sedan
Månadsutdelande fonder fortsätter att locka investerarna mest
-

 Nyheter2 veckor sedan
Fastställd utdelning i MONTDIV april 2026
-

 Nyheter2 veckor sedan
Anslut dig till kvantrevolutionen med Lunates nya ETF på Xetra
-

 Nyheter2 veckor sedan
Bitcoin for beginners: 4 things to know before investing