
Nyheter
Playing the AI revolution through commodities and gold’s curious rally


Nyheter
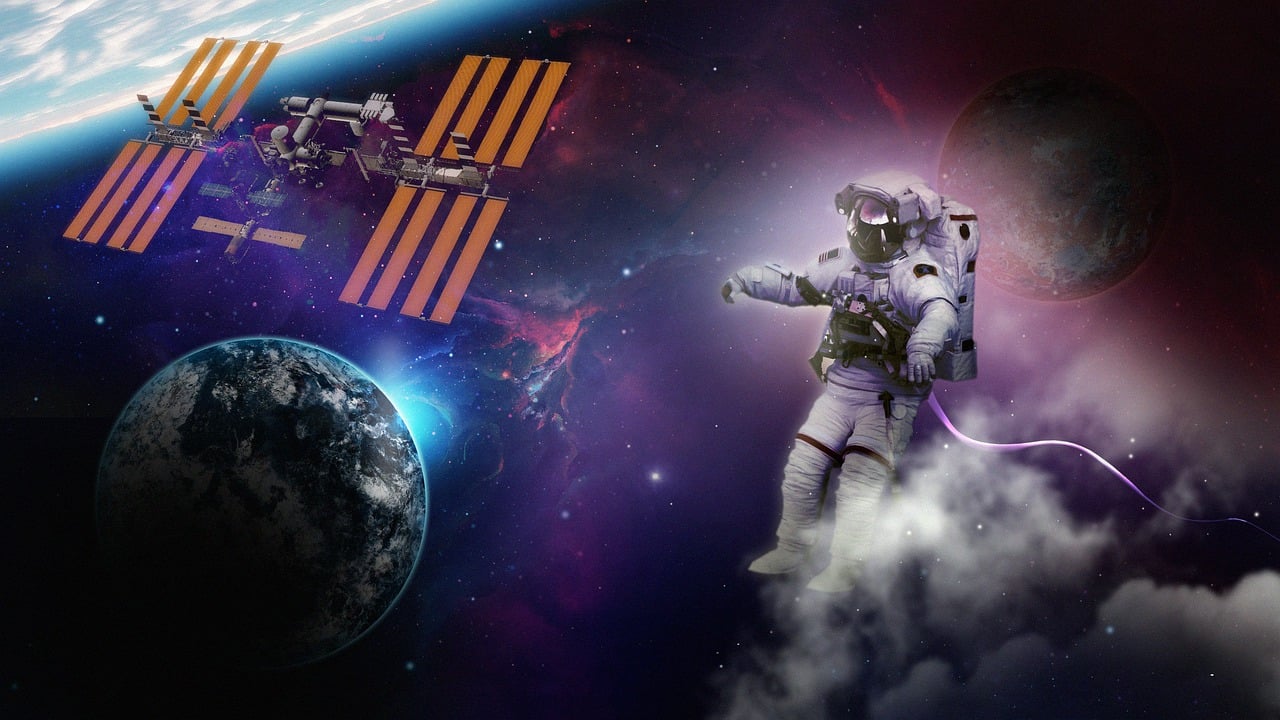
BlackRock lanserar ST4R ETF för att erbjuda snabb tillgång till möjligheter inom rymdekonomin


Nyheter15 timmar sedan
Nya ETF- och ETP-noteringar den 9 juni 2026 på Deutsche Börse

Nyheter16 timmar sedan
UONS ETF spårar den amerikanska dagslåneräntan

Nyheter17 timmar sedan
BlackRock lanserar ST4R ETF för att erbjuda snabb tillgång till möjligheter inom rymdekonomin

Nyheter18 timmar sedan
DJIW ETF investerar i Sharia-kompatibla globala företag utanför USA

Nyheter2 dagar sedan
Nya ETF- och ETP-noteringar den 8 juni 2026 på Deutsche Börse

Nyheter2 veckor sedan
USA satsar 2 miljarder dollar på kvantdatorer – så kan investerare dra nytta av utvecklingen

Nyheter3 veckor sedan
De bästa ETFerna för att investera i emerging markets

Nyheter3 veckor sedan
Fastställd utdelning i MONTDIV maj 2026

Nyheter1 vecka sedan
Varför Plus500 är en dröm för finans-affiliate

Nyheter1 vecka sedan
Extrema skillnader: Varför presterar Europas kvantdator-ETFer så olika?
-
 Nyheter2 veckor sedan
USA satsar 2 miljarder dollar på kvantdatorer – så kan investerare dra nytta av utvecklingen
-
 Nyheter3 veckor sedan
De bästa ETFerna för att investera i emerging markets
-
 Nyheter3 veckor sedan
Fastställd utdelning i MONTDIV maj 2026
-
 Nyheter1 vecka sedan
Varför Plus500 är en dröm för finans-affiliate
-
 Nyheter1 vecka sedan
Extrema skillnader: Varför presterar Europas kvantdator-ETFer så olika?
-

 Nyheter3 veckor sedan
ASWF ETF är en aktivt förvaltad fond som investerar i Kanada
-

 Nyheter2 veckor sedan
21shares produkter nu finns tillgängliga hos Revolut
-

 Nyheter2 veckor sedan
Olja och Hormuzsundet fick flest sökningar i maj 2026