
Nyheter
Silver – Ripe for Recovery
ETF Securities – Silver – Ripe for Recovery
Converging trends point to a higher silver price
- The silver price has more than halved from its high in 2011, presenting good value in our view.
- With industrial demand turning up, supply falling, inventories declining, the gold price stable and volatility at a near decade low, we believe conditions are building for a silver price rally.
- Chinese silver imports have increased 17% YOY in 2014.
- Silver fabrication demand increased 6% in 2013 – the largest increase since 2000.
- Speculative shorts in the futures market are elevated, indicating scope for a short covering rally.
Silver is brewing for some shine
Silver is the one of the world’s most versatile commodities. Also classified as a currency, silver is one of the world’s best conductors of electricity and heat. Its versatility is exemplified by its use in products ranging from electronics, antiseptics, solar panels, silverware and jewellery. In the commodity ETF world, silver ETF’s have among the lowest expense ratios, notably because silver is a quasi-currency with very low storage costs yet the majority of its demand is for industrial purposes. Demand is increasing rapidly along with increasing global per-capita incomes and rapid electronization.
Total silver supply has been stagnant the past few years and, unlike gold, total silver bullion inventories have been declining for years. Often viewed by investors as a leveraged play on gold, silver is an attractive longer term portfolio diversifier in our view, with a low correlation to most other major asset classes yet offering protection from currency debasement risk and inflation.
History indicates the recent decline in silver price volatility to the lowest levels in over a decade (at the beginning of May), as measured by 30-day volatility, may be a precursor to a strong price move. In our view, downside risk is limited with industrial demand picking up and supply in decline. With the silver price less than half its 2011 peak and futures shorts already elevated, we believe the next strong trend price move is likely to be up.

Very low silver volatility indicates a brewing trend
Chinese silver imports have been strong in 2014
Demand is increasing rapidly. Q1 data on China demand showed a 22% YOY increase in silver imports, the largest quarterly gain since Q2 2010. China demand through April showed a 17% increase YOY. Every major area of silver demand is expected to increase in 2014, with the exception of photography.
In 2014, the amount of demand for silver used in solar PV panels is expected to equal the demand for photography for the first time. Exemplifying the changing demand landscape for solar, in some parts of the world, solar power is near parity on a cost-per-watt basis with conventional forms of electricity production. This trend is likely to accelerate in our view, and more so as electricity storage technology improves, notably with potential help from people like Elon Musk and his plans for battery giga factories. Silver for solar will likely consume about 78 million ounces of silver in 2014, or 8% of total demand including investment, up from less than 1% in 2007 (CPM Group estimates).
Electronization is rapidly changing our lives, notably for the the 4 billion people identified by the World Bank from roughly 70 countries in the rapidly growing US $4,000 to $11,000 per-capita income category, where consumer product consumption often increases more rapidly than per capita income enough to make it impractical to recycle, thus most silver used in electronics is removed from the market permanently, unless prices reach such levels to make such recycling economical. In 2013, about 288 million ounces of silver was used for electronics and solar; about 1/3 of total demand. In 1999, only about 11% of total silver demand was for electronics and solar.
Silver fabrication demand has shifted towards electronics

Silver futures trading in China has soared. In 2013, silver traded on the Shanghai Futures Exchange (SHFE) exceeded COMEX/CME traded silver futures in terms of total trading volume. Only open since 2012, SHFE traded silver futures were responsible for 49% of total futures trading in 2013, which was about 84 billion ounces.
Fabrication demand in 2013 increased the most since 2000. The single largest category of demand for silver is for jewelry and & silverware, making up about 31% of fabrication demand and 27% of total demand and investment in 2013. Total fabrication demand increased 6.3% in 2013 to 866 million ounces, led by jewelry, silverware and solar. It was the largest percentage increase in fabrication demand since the year 2000. Compare this to mining supply of 741 million ounces, which increased 4.1% in 2013. Recycling and inventory depletion are therefore necessary to meet the supply and demand imbalance in the silver market. A key question is, was 2013 a one-off or is it potentially the beginning of a trend? In our view, the longer-term demand trend is likely to accelerate, based notably on global per capita income and GDP growth, rapid electronization and more recent investment trends in silver. The CPM Group expects fabrication demand to increase about 3% in 2014.
Investment demand continues to grow. At the end of 2013, the total holdings of silver in ETPs (exchange traded products) stood at 623 million ounces, which although was down about 2% from the peak, was the greatest year-end amount ever for silver ETP’s holdings. Although gold ETP holdings have declined about one-third from the peak at the end of 2012, silver investors in coins, ETP’s and jewelry have been much more resilient. At the end of April 2014, silver ETP holdings increased 1.4% from the end of 2013 to 632 million ounces.
Silver ETF holdings have been steady

Led by India, identifiable investment in silver leaped 75% in 2013 to a new high of 246 million ounces. Demand for silver was boosted in 2013 in India, notably due to the sharp price decline and gold market restrictions.
Global demand for silver coins increased to a record 136 million ounces in 2013. The US mint alone sold 43 million ounces of silver coins in 2013. It was record year, with sales increasing 27% from the previous year, likely supplemented by the sharp decline in the silver price but the amount of demand exceeded the total of 35 million ounces of silver mined in the US in 2013. Although many of the coins sold by the US Mint are to non-US citizens, the Mint must purchase silver from only US miners. Currently, the US Mint alone is consuming over 100% of all silver mined in the US. As of the end of April 2014, US mint silver coin sales were on pace to match the record year of 2013, whereas gold coin sales were down about 80%.
Demand must be offset by recycling and inventory depletion

Total supply has been stagnant. A key factor holding back silver prices the past few years in our view has been increasing mining supply. The majority of silver is produced as a by-product of gold, zinc, lead and copper.
About 25% of silver was from primary silver mines in 2013. Global mining supply increased 4% in 2013 to 741 million ounces but total supplies actually declined about 2.5% to 971 million ounces due to a sharp reduction in recycling. Secondary supply, notably recycling, in 2013 was the lowest since 1999 indicating the second most significant source of supply, next to mining, is not likely to increase unless the silver price increases. Total silver supply is expected to increase only about 0.7% in 2014 unless higher prices spur increased recycling.
The total market supply of silver in 2013 was essentially the same as in 2009; only 2% above the 952 million ounces of 2009 total market supply. Unlike gold, there is not a massive amount of stored silver to call upon when demand is strong, or supplies constrained. Silver is notably a demand story.
The 2013 year was the first that total silver demand and investment demand exceeded total supply including recycling since 2010. In 2014, the supply/demand deficit is expected to widen.
2014 supply is likely to be unchanged from 2010

Inventories are quite low relative to history. In 1990, estimated total silver bullion inventories were about 2.8-billion ounces, roughly equal to about 7 times global annual mining supply. A the end of 2013, estimated total silver bullion inventories were about 890-million ounces, which is only about 1.2-times global annual mining supply. Compared to the end of the year 2000, total silver bullion inventories at the end of 2013 were down 28%.
70% of silver inventories are in ETP’s
At the end of 2013, silver ETP holdings accounted for about 70% of estimated readily available silver bullion inventories, compared to a fractional amount in the year 2000. Due to their transparency, efficiency and cost effectiveness, ETPs are increasingly becoming a larger part of the silver market, yet as 2013 proved, ETP silver holdings may be more sticky than previously expected. Governments have sold off most of their silver reserves and much of the silver has been used for industrial purposes, unlikely to ever re-enter the marketplace.
Silver inventories have been depleted by 2/3’s since 1990

The silver price is the lowest vs the cost of production since 2005. Due to the nature of silver mining, most of it is produced as by-product from the production of other metals, it is difficult to estimate total all-in production costs but we can properly measure the cash costs of the primary miners.
For the first year since 2002, primary silver cash mining costs declined in 2013, to approximately US $9.7/oz. according to the CMP Silver 2014 Handbook. The Silver Institute World Silver Survey 2014, indicated a lower cash cost amount of US $9.27/oz. Cash mining costs declined in 2013 notably due to reduced research and exploration expenditures which has negative implications for future supplies. Partly because cash costs are only a portion of total all-in costs, the silver price has historically traded a fair amount above this cost measure. At the end of 2013, the silver price was 145% above the primary miner cash cost average, which was the lowest percentage since 110% at the end of 2005.
Silver price has declined sharply relative to production costs

Silver appears cheap relative to gold. Just prior to the big silver move beginning in 2009 near US $20/oz. and ending at US $48/oz. in 2011, the gold/silver ratio was about 70, which is near current levels. This period was also preceded by a sharp decline in 30-day silver volatility similar to levels reached at the end of April this year. For the few years prior the 2008 crisis, the gold/silver ratio hovered around 50. Since 2008, the ratio has reached a peak near 85 and low near 32. With a median near 59, as the global economy continues to recover, the 50 area in the gold/silver is an area that is likely to be revisited in our view, with silver price upside the key driver.
Gold vs silver has reached the highest level since 2010

Silver – a leveraged play on gold. Silver prices have a history of moving with a higher volatility than gold but with a high correlation. Among all precious metals prices, the correlation between silver and gold is the highest. From January 2000 to April 2014, the gold silver correlation was .75. Gold’s average annual volatility was 17.5% compared to 32% for silver (measured on a monthly basis). On a volatility weighted basis, silver has moved approximately 1.8 times gold, thus it has offered a similar exposure as gold but with more return (and loss) for a given level of investment. From 1971 to 2013, the beta of silver to US CPI was 9 compared to about 5 for gold (measured annually). When gold is the main price driver, as measured during the top 20% and bottom 20% of gold return months from Jan 2000 to April 2014, silver has moved on average 1.4 times gold. When silver is the driving force, it has moved about 2.4 times the price of gold, as measured by the top 20% and bottom 20% of silver months (see table).
Due to its larger industrial demand base, silver has a higher correlation to global GDP growth and the S&P 500 than gold, but the overall correlation to both remains quite low. During positive months in the S&P 500 coinciding with global PMI above 50, silver has increased on average about 3% per month, compared to 1.4% for gold and 3% for copper. During negative S&P 500 months coinciding with global PMI below 50, silver has on average declined 0.3% per month compared to an increase of 0.6% for gold and a 1.0% decline for copper.
Summary
In our view, the silver price is potentially poised for a strong upward move. Supply and demand indicators are turning price positive. Increasing demand from China, increasing investor demand and strong fabrication demand are being met with falling supply and dwindling inventories. The gold price decline last year weighed heavily on silver due to its high correlation to the metal and its much higher volatility. However, we believe the gold price has found a bottom and this weight should be removed from silver’s performance in 2014. Unlike gold, above ground available supplies of silver have been declining for years as fabrication demand has increased. The recent rise in US and China industrial indicators, a clearing of silver longs in the futures markets and elevated shorts increases the likelihood of a short covering rally that potentially sparks a more sustained upward rise of the silver price.
Monthly performance table

Table note – End of month data is from Jan. 2000 thru April 2014. Gold and silver are spot changes. Copper is the COMEX/CME front futures change. Storage costs are not included. Total return is used for the S&P 500. The JPM Global PMI measure was used for global PMI.
Source: ETF Securities, Bloomberg.
Important Information
This communication has been issued and approved for the purpose of section 21 of the Financial Services and Markets Act 2000 by ETF Securities (UK) Limited (”ETFS UK”) which is authorised and regulated by the United Kingdom Financial Conduct Authority (”FCA”).


KBC Asset Management utökar sitt europeiska ETF-utbud i trippellansering, med säkringsalternativ för ungerska forinter (HUF) och tjeckiska korunor (CZK).
- KBC Asset Management har utökat sitt europeiska ETF-utbud med lanseringen av bluesphere US Equity UCITS ETF (ticker: BSUE), bluesphere European Equity UCITS ETF (ticker: BSEU) och bluesphere US Technology UCITS ETF (ticker: BSTE).
- Var och en av ETFerna finns också tillgängliga i både HUF- och CZK-säkrade andelsklasser, vilket gör dem till ett unikt erbjudande i ETF-landskapet.
- HANetf har byggt upp en exklusiv ICAV för KBC för sina produkter.
- ETFerna är noterade på Euronext Amsterdam.
HANetf, Europas första och ledande white-label UCITS ETF och ETC-plattform, [1] är glada att kunna meddela att KBC Asset Management har utökat sitt europeiska ETF-utbud:
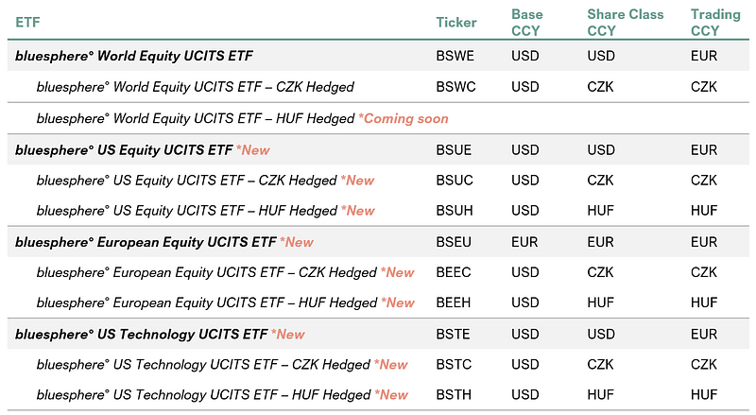
- bluesphere° US Equity UCITS ETF (ticker: BSUE)
- bluesphere° European Equity UCITS ETF (ticker: BSEU)
- bluesphere° US Technology UCITS ETF (ticker: BSTE)
Var och en av de tre nya ETFerna finns även tillgängliga med säkringsalternativ för ungerska forinter (HUF) och tjeckiska korunor (CZK). Hela utbudet och tillgängliga säkringsalternativ finns nedan:
KBC Group är en integrerad bank- och försäkringsgrupp som bildades 1998 genom sammanslagningen av två belgiska banker, Kredietbank och CERA Bank, och det belgiska försäkringsbolaget ABB Insurance. Idag betjänar KBC cirka 13 miljoner kunder och fokuserar på sina kärnmarknader i Belgien, Tjeckien, Slovakien, Ungern och Bulgarien, samtidigt som de upprätthåller en mer begränsad närvaro i utvalda andra länder.
Koncernen driver ett omfattande distributionsnätverk med cirka 1 090 bankkontor, kompletterat med försäkringsförsäljning via egna ombud och andra kanaler, samt ett brett utbud av digitala och elektroniska plattformar. Med cirka 40 000 anställda kombinerar KBC bank- och försäkringsexpertis för att förse kunderna med integrerade finansiella tjänster skräddarsydda efter deras behov.
De nya ETFerna är utformade för att ge investerare en rad globala exponeringar, förstärkta av en mycket eftertraktad funktion i lokal valuta. Varje ETF finns tillgänglig i en CZK-säkrad andelsklass, med ett växande antal även tillgängliga i HUF-säkrade andelsklasser, vilket skapar ett differentierat erbjudande inom ETF-marknaden och skräddarsytt för tjeckiska och ungerska investerares behov.
ETFerna är byggda kring transparenta och disciplinerade regelbaserade metoder, vilket ger tydlig insyn i portföljsammansättning och marknadsexponering utan onödig komplexitet. Genom att följa etablerade index syftar ETFerna till att ge en pålitlig grund för investerare som vill fortsätta investera på aktiemarknaderna på lång sikt.
KBC anser att det finns en tydlig möjlighet att differentiera sig på den globala aktie-ETF-marknaden genom en stark lokal fördel. Djup marknadsinsikt, regulatorisk expertis och långvariga kundrelationer kan alla spela en viktig roll för att stödja investerare vid sidan av det breda universum av standard ETF-erbjudanden som redan finns tillgängliga på marknaden.
Viktiga risker
- ETFernas resultat kan påverkas av förändringar i ekonomiska och marknadsmässiga förhållanden.
- ETFerna kan också påverkas av osäkerheter såsom politisk utveckling, förändringar i regeringens politik, införandet av restriktioner för kapitalöverföring och i juridiska, regulatoriska och skattemässiga krav.
- Sekundärmarknader kan vara föremål för oregelbunden handelsaktivitet, breda köp-/säljspreadar och förlängda avvecklingsperioder i tider av marknadsstress.
Johan Lema, VD på KBC Asset Management, säger: ”Den mycket framgångsrika lanseringen av vår globala CZK-säkrade ETF bekräftade ett starkt kundintresse för erbjudanden från aktörer som verkligen förstår den lokala marknadsdynamiken. Detta gav oss förtroendet att fortsätta genomföra våra ambitiösa planer. Dessa nya ETF:er markerar nästa steg i vår resa för att få alla investerade, hela tiden. Genom att utnyttja vår starka närvaro på våra kärnmarknader fortsätter vi att erbjuda enkla, värdefulla och pålitliga investeringslösningar till både befintliga och nya KBC-kunder.”
Hector McNeil, medgrundare och VD för HANetf, kommenterade: ”Vi är glada över att KBC Asset Management utökar sitt utbud av europeiska UCITS-ETFer. Som ett av Belgiens ledande finansinstitut, med djupa rötter i sina europeiska kärnmarknader, bidrar KBC Group med betydande skala, trovärdighet och distributionsstyrka till lanseringarna.”
[1] Som visas i ETF-databasen.


EDEY ETF investerar i ledande japanska aktier
AMY1 ETP spårar Applied Materials och ger utdelning varje månad

KBC Asset Management utökar sitt europeiska ETF-utbud i trippellansering

HEDL ETF använder en covered call strategi för att ge månadsvisa utdelningar

Sprott ser starka långsiktiga silverutsikter trots den senaste tidens prisvolatilitet

QQCC ETF följer företag världen över som är aktiva inom kvantberäkning

Extrema skillnader: Varför presterar Europas kvantdator-ETFer så olika?

Den osynliga flaskhalsen i AI-boomen: Varför elinfrastruktur är nästa stora megatrend

Varför Plus500 är en dröm för finans-affiliate

ETFer för fotbolls-VM 2026
-
 Nyheter4 veckor sedan
QQCC ETF följer företag världen över som är aktiva inom kvantberäkning
-
 Nyheter4 veckor sedan
Extrema skillnader: Varför presterar Europas kvantdator-ETFer så olika?
-
 Nyheter2 veckor sedan
Den osynliga flaskhalsen i AI-boomen: Varför elinfrastruktur är nästa stora megatrend
-
 Nyheter4 veckor sedan
Varför Plus500 är en dröm för finans-affiliate
-
 Nyheter4 veckor sedan
ETFer för fotbolls-VM 2026
-

 Nyheter4 veckor sedan
Olja och Hormuzsundet fick flest sökningar i maj 2026
-

 Nyheter4 veckor sedan
ETFerna som ger exponering mot STOXX Europe 600
-

 Nyheter3 veckor sedan
Är tokeniserade ETFer framtiden?