
Nyheter
ETFmarknaden i Europa firar sitt 24-årsjubileum med tillgångar på två biljoner USD

ETFGI, ett ledande oberoende forsknings- och konsultföretag som täcker trender i det globala ETF-ekosystemet, rapporterar att ETFmarknaden i Europa firar sitt 24-årsjubileum med rekordtillgångar på nästan 2 biljoner US-dollar. De första europanoterade ETF:erna gjorde sin debut den 11 april 2000. Dessa två ETFer var baserade på Euro Stoxx 50– och Stoxx Europe 50-indexen, och de var noterade på Deutsche Boerse i Tyskland.
Tillgångar som investerats i ETF-branschen i Europa nådde rekordhöga 1,96 biljoner USD i slutet av mars. Under mars samlade ETF-branschen i Europa nettoinflöden på 11,02 miljarder USD, vilket ger årets nettoinflöden till 49,52 miljarder USD, enligt ETFGIs mars 2024 europeiska ETFer och ETPers industrilandskapsrapport, den månatliga rapporten som är en del av en årlig betald forskningsprenumerationstjänst. (Alla dollarvärden i USD om inget annat anges.)
Höjdpunkter
- Tillgångar som investerats på ETFmarknaden i Europa nådde ett rekord på 1,96 Tn i slutet av mars och slog det tidigare rekordet på 1,90 Tn i slutet av februari 2024.
- Tillgångarna ökade med 7,8 % YTD 2024, från 1,82 Tn USD i slutet av 2023 till 1,96 Tn USD.
- Nettoinflöden på 11,02 miljarder USD i mars 2024.
- YTD nettoinflöden på 49,52 miljarder USD är tredje högsta någonsin efter YTD nettoinflöden på 59,30 miljarder USD 2021 och YTD nettoinflöden på 49,73 miljarder USD 2022.
- Artonde månaden med på varandra följande nettoinflöden.
”S&P 500-indexet ökade med 3,22 % i mars och är upp 10,56 % YTD 2024. De utvecklade marknaderna exklusive det amerikanska indexet ökade med 3,62 % i mars och steg 5,26 % YTD 2024. Spanien (upp 10,72 %) och Italien (upp 6,34 %) såg de största ökningarna bland de utvecklade marknaderna i mars. Emerging markets-indexet ökade med 1,50 % under mars och steg 2,08 % YTD 2024. Peru (upp 10,27 %) och Columbia (upp 8,19 %) såg de största ökningarna bland tillväxtmarknaderna i mars”, enligt Deborah Fuhr, managing partner, grundare och ägare av ETFGI.
Tillgångstillväxt i ETF-branschen i slutet av mars
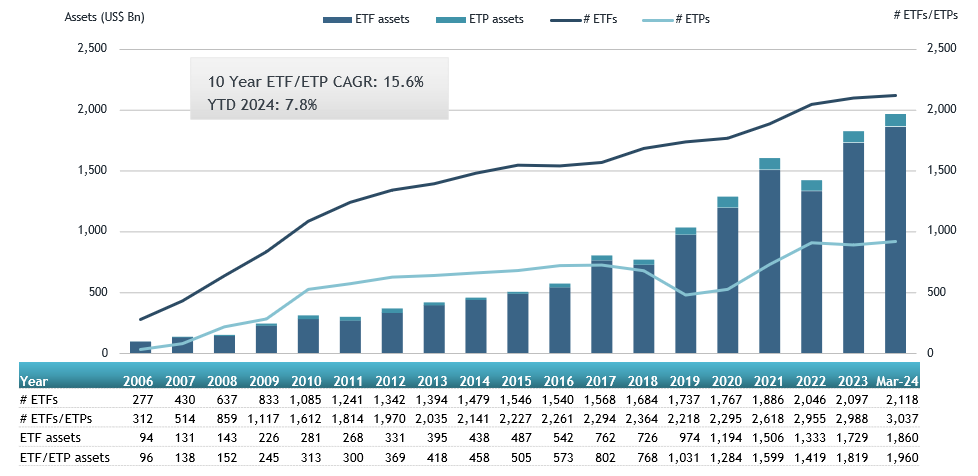
Källa: ETFGI
I slutet av mars hade ETFmarknaden i Europa 3 037 produkter, med 12 209 noteringar, tillgångar på $1,96 Tn, från 99 leverantörer listade på 29 börser i 24 länder.
Under mars samlade ETFer nettoinflöden till 11,02 miljarder USD. Aktie-ETFer samlade nettoinflöden på 9,81 miljarder USD under mars, vilket förde YTD nettoinflöden till 39,30 miljarder USD, högre än 19,38 miljarder USD i nettoinflöden av eget kapital YTD 2023. Ränte-ETFer rapporterade nettoinflöden på 719,00 USD YTD under 1 mars, vilket gav 25 USD nettoinflöden. miljarder, lägre än 15,49 miljarder USD i nettoinflöden YTD år 2023. Råvaru-ETFer rapporterade nettoutflöden på 75,35 miljoner USD under mars, vilket förde YTD nettoutflöden till 2,32 miljarder USD, lägre än 1,67 miljarder USD i nettoinflöden YTD 2023. på 670,27 miljoner USD under månaden, vilket samlade ett nettoinflöde för året i Europa på 2,33 miljarder USD, högre än 2,17 miljarder USD i nettoinflöden YTD 2023.
Betydande inflöden kan tillskrivas de 20 bästa ETFerna av nya nettotillgångar, som samlat in 9,63 miljarder USD under mars. iShares Core S&P 500 UCITS ETF – Acc (CSSPX SW) samlade in 918,91 miljoner USD, det största enskilda nettoinflödet.
Topp 20 ETFer efter nettoinflöden i mars 2024: Europa
| Namn | Kortnamn | Assets ($ Mn) Mar-24 | NNA ($ Mn) YTD-24 | NNA ($ Mn) Mar-24 |
| iShares Core S&P 500 UCITS ETF – Acc | CSSPX SW | 84,308.60 | 4,744.81 | 918.91 |
| UBS ETF (LU) MSCI United Kingdom UCITS ETF (GBP) A-acc – Acc | UC64 | 2,485.72 | 653.33 | 753.94 |
| Invesco MSCI USA ESG Universal Screened UCITS ETF – Acc | ESGU | 2,188.25 | 792.66 | 741.48 |
| Xtrackers II EUR Overnight Rate Swap UCITS ETF – 1C – Acc | DBXT | 7,281.96 | 2,089.43 | 596.35 |
| HSBC S&P 500 UCITS ETF | H4ZF | 6,756.08 | 661.46 | 562.23 |
| iShares MSCI EM ESG Enhanced UCITS ETF | EEDM | 5,000.88 | 886.95 | 556.22 |
| Vanguard FTSE All-World UCITS ETF | VGWL | 24,771.34 | 1,410.78 | 545.51 |
| Invesco S&P 500 UCITS ETF – Acc | P500 | 25,176.99 | 939.08 | 497.72 |
| iShares MSCI ACWI UCITS ETF – Acc | IUSQ | 12,806.01 | 1,453.06 | 469.35 |
| iShares USD Treasury Bond 0-1yr UCITS ETF | IBCC | 14,990.95 | 1,433.49 | 431.07 |
| iShares € High Yield Corp Bond UCITS ETF | EUNW | 7,694.75 | 1,427.77 | 413.53 |
| SPDR S&P 500 UCITS ETF | SPY5 | 12,491.17 | 3,418.58 | 388.74 |
| iShares Core MSCI World UCITS ETF – Acc | EUNL | 75,051.88 | 3,236.70 | 382.75 |
| Amundi Bloomberg Equal-weight Commodity ex-Agriculture UCITS ETF – Acc | LYTR | 1,668.95 | 367.30 | 378.26 |
| iShares STOXX Europe Small 200 UCITS ETF (DE) | SCXPEX | 916.86 | 401.43 | 357.42 |
| Amundi MSCI Japan UCITS ETF – Acc | LCUJ | 4,400.85 | 158.96 | 343.86 |
| UBS ETF (CH) – MSCI Switzerland (CHF) A-dis – Acc | SWICHA | 1,126.17 | 354.69 | 335.87 |
| SPDR MSCI World UCITS ETF – Acc | SPPW | 5,653.51 | 715.38 | 324.95 |
| Amundi S&P 500 Climate Net Zero Ambition PAB UCITS ETF | ZPA5 | 3,965.66 | 925.46 | 320.42 |
| JPMorgan US Research Enhanced Index Equity ESG UCITS ETF – Acc | JREU | 7,047.30 | 1,230.55 | 315.09 |

Källa ETFGI
De 10 bästa ETPerna av nya nettotillgångar samlade ihop 1,69 miljarder USD under mars. WisdomTree Physical Silver – Acc (PHAG LN) samlade in 832,90 miljoner USD, det största enskilda nettoinflödet.
Topp 10 ETPer efter nettoinflöden i mars 2024: Europa
| Namn | Kortnamn | Assets ($ Mn) Mar-24 | NNA ($ Mn) YTD-24 | NNA ($ Mn) Mar-24 |
| WisdomTree Physical Silver – Acc | VZLC | 2,057.21 | 793.35 | 832.90 |
| iShares Physical Silver ETC – Acc | SSLN | 785.65 | 254.30 | 245.97 |
| Xtrackers IE Physical Gold ETC Securities – Acc | XGDU | 3,640.08 | 231.87 | 167.72 |
| AMUNDI PHYSICAL GOLD ETC (C) – Acc | GOLD | 4,575.61 | 307.29 | 127.12 |
| Xtrackers Physical Gold ETC (EUR) – Acc | XAD5 | 2,202.38 | 92.10 | 80.28 |
| WisdomTree Copper – Acc | OD7C | 1,667.78 | 337.85 | 68.51 |
| Xtrackers Physical Gold Euro Hedged ETC – Acc | XAD1 | 1,335.65 | 5.06 | 50.49 |
| SG ETC FTSE MIB -3x Daily Short Collateralized – Acc | MIB3S | 33.07 | 88.10 | 40.49 |
| 21Shares Toncoin Staking ETP | TONN | 40.81 | 39.94 | 39.94 |
| Invesco Physical Gold ETC – EUR Hdg Acc | 8PSE | 564.18 | 59.65 | 33.11 |

Källa: ETFGI
Investerare har tenderat att investera i Equity ETFs under mars.


ESAL ETF använder en systematisk flerfaktorsmetod för att investera globalt

RGSC ETF är en aktivt förvaltad globalfond

Så kan du investera i cybersäkerhet med hjälp av börshandlade fonder

I28X ETF investerar i eurodenominerade företagsobligationer som förfaller 2028
ESAR ETF följer MSCI USA-indexet i euro

Börshandlade fonder för kvantberäkning

Invesco on Iran war: Prudent response is to stay invested

Are you quantum ready?

Boreas satsning på innovativa, tematiska investeringar

21shares korsnoterar nio ETPer på Xetra
-
 Nyheter4 veckor sedan
Börshandlade fonder för kvantberäkning
-
 Nyheter3 veckor sedan
Invesco on Iran war: Prudent response is to stay invested
-
 Nyheter3 veckor sedan
Are you quantum ready?
-
 Nyheter1 vecka sedan
Boreas satsning på innovativa, tematiska investeringar
-
 Nyheter3 veckor sedan
21shares korsnoterar nio ETPer på Xetra
-

 Nyheter2 veckor sedan
HANetf säger att drönare är den försvarssektor du inte kan ignorera
-

 Nyheter5 dagar sedan
Månadsutdelande fonder fortsätter att locka investerarna mest
-
 Nyheter3 veckor sedan
Investera i Eurozonen med börshandlade fonder