
Nyheter
Treasury yields suggest the US economy is approaching a peak

ETF Securities Fixed Income Research – Treasury yields suggest the US economy is approaching a peak
Highlights
- Current low term premium for US Treasury bonds suggests US economic growth is near peak.
- The inflation risk premium is the primary driver of government bond yields, but creditworthiness could become the new directional catalyst in the future.
- Duration risk is best rewarded at short maturities than on long-term bonds.
The yield curve and term premium estimates are useful for the forecasting of future returns from bonds. In addition, identifying the macro drivers of bond returns helps to detect trend reversals in the economic cycle and the bond market.
What does the US yield curve tell us?
The yield curve’s shape is closely related to business, credit and monetary policy cycles. The yield curve’s steepness, as defined by the yield differential between the 10-year and the 3-month Treasury yields, has a negative relationship with the level of short-term rates. In other words, when the short-term rates are low, the steepness of the curve is elevated or the yield curve is steep. The variations in the shape of the yield curve is partly explained by the fact that investors’ expectations of future short-term rates tend to mean-revert at extremely low or high levels of short-term rates.
The graph above exhibits the negative relationship between the steepness spread of the yield curve and the gap between the current short rate and its 10-year average. The wider the gap, the higher the market’s expectation of the Federal Reserve rising interest rates. The compression of this gap in the past two years suggests that investors have now almost fully priced into the Treasury bond market the Fed’s current monetary tightening cycle.
A steep curve generally coincides with a high unemployment rate and strong economic growth. The US Treasury steepness spreads has been falling for the past five with the market’s anticipation of monetary tightening. The steepness spread currently stands at 160bps but we expect it will compress further until becoming negative as the Fed gradually increases interest rates.

(Click to enlarge)
The US unemployment rate is now close to its pre-crisis and structural level of 4.6% while the US economy is growing close to its potential growth rate of 2% annually. This combined with the flattening of the US Treasury yield curve both suggest the US economy is approaching a peak. The variation of the steepness spread is a useful tool to timely anticipate the next recession (i.e. the next recession is imminent if the steepness spread becomes negative).
Negative term premium
The yield curve is also useful to predict near-term bond returns. The long-term bonds yields are a function of two unobservable components: the expected average of future short-term interest rates and the duration or term premium. The latter compensates investors for forgoing their current consumption to invest in uncertain long term yields. A simple term premium proxy can be derived from subtracting market participants’ expectations of future interest rates from long-term bond yields. The major challenge is estimating the markets’ expectations of the future course of short-term rates over a long-term horizon. Most proxies are derived from surveys of professional forecasters or statistical estimates.

(Click to enlarge)
The estimates of the term premium may differ by magnitude but tend to have the same directional trend, they move in tandem with the level of short-term rates. Investors require a high term premium when the economy is near a cycle trough and the yield curve is steep. On the contrary, investors accept low or negative term premiums when the economy is near a peak and the yield curve is flat or inverted.

(Click to enlarge)
Macro drivers of low long-term yields
Inflation risk is the most important secular driver of expected real bond yields2. Improving central bank credibility since the 1980s has contributed to reduce volatility in inflation expectations and thus bond yields. However, we believe the level of indebtedness and creditworthiness of governments will increasingly affect bond premiums. Long-term structural challenges such as debt overhang, aging populations and low productivity growth in developed economies could lead to the fiscal outlook overshadowing inflation as the main driver of government bond yields, as has been the case in Europe since the financial crisis.
The demand for long-term bonds over the past decade has been growing due to structural, regulatory and cyclical factors. In particular, the large-scale asset purchase programmes conducted by major central banks have led to government bonds becoming scarce and have pushed yields lower. The combined effect of the global “saving glut” and stricter regulations also partly explain why the yield curve is typically flat or inverted at long maturities. Investors are willing to accept negative term premiums to comply with their liabilities or regulatory constraints.
As a result, historical average returns show that the risk-reward relation is positive but nonlinear, as it tends to be flat or negative for long-term maturities. The reward for extending duration is highest at short maturities (under 7 years) and diminishes at longer maturities. In other words, investors receive a better risk-adjusted return at shorter maturities.
Hedging with government bonds
Our reading of the US economic data and US treasury yield curve suggest the US economy is approaching a peak. With the US stock market at all-time highs and with a low inflation rate, investors accept negative term premium as a price for hedging against stocks and recession. The current negative relationship between US government bonds and US stocks reinforces this view as US government bonds exhibit diversification properties.

(Click to enlarge)
For more information contact:
ETF Securities Research team
ETF Securities (UK) Limited
T +44 (0) 207 448 4336
E info@etfsecurities.com
Important Information
This communication has been issued and approved for the purpose of section 21 of the Financial Services and Markets Act 2000 by ETF Securities (UK) Limited (“ETFS UK”) which is authorised and regulated by the United Kingdom Financial Conduct Authority (the “FCA”).


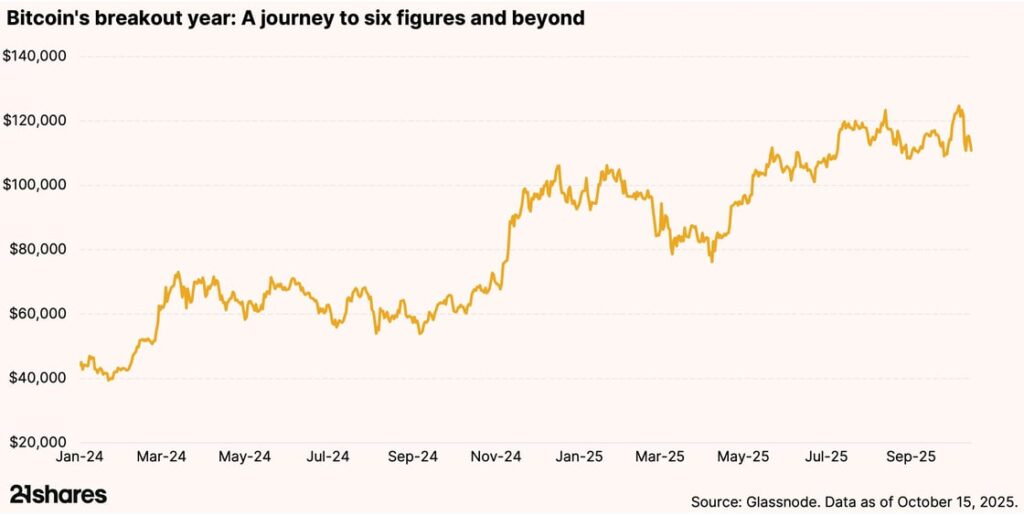
Bitcoin’s record-breaking rally and resilient investor base reveal a maturing market. Despite brief drawdowns, over 90% of holders remain in profit, and institutional inflows continue to absorb volatility. With downside risk compressing, even a modest Bitcoin allocation will meaningfully boost portfolio efficiency across cycles.

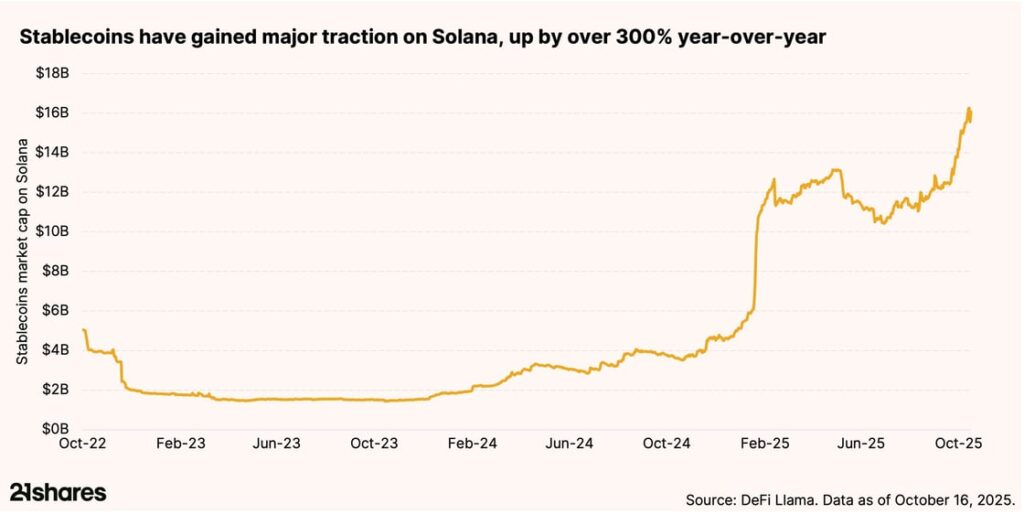
Why is retail finance booming on Solana?
Solana’s low fees and lightning-fast transactions are powering real-world payments. With $16 billion worth of stablecoins traded on the network, Solana is bridging crypto and commerce, driving retail adoption at an unprecedented scale. This is exactly why legacy companies like Shopify and PayPal have chosen to integrate the blockchain into their businesses.


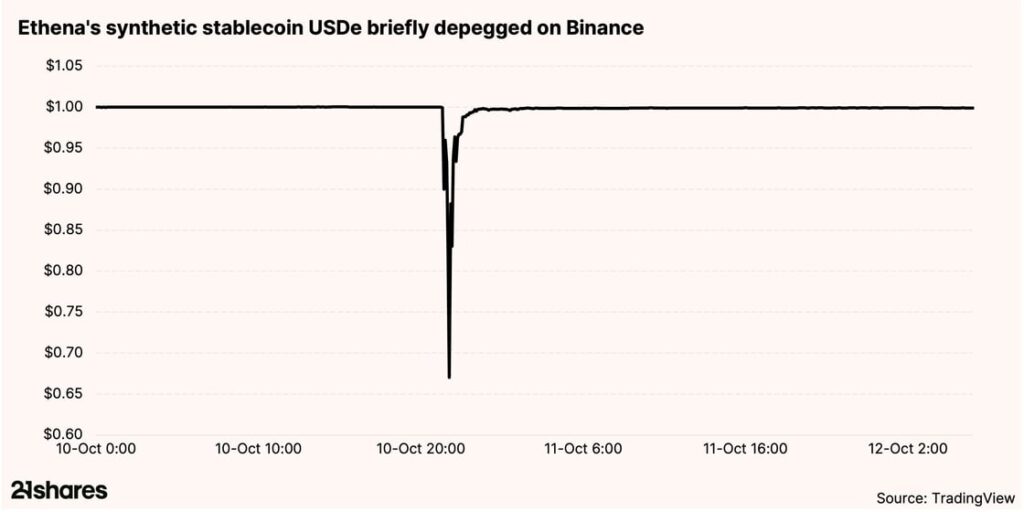
Why did Ethena’s stablecoin remain stable onchain but depegged on Binance?
On October 10, Ethena’s USDe saw a sharp depeg on Binance’s centralized exchange, plunging to $0.65, while staying stable across all decentralized finance platforms. The cause wasn’t a protocol flaw but thin centralized liquidity. The incident highlights how decentralized systems can better withstand volatility, offering transparency and resilience during market stress.

Research Newsletter
Each week the 21Shares Research team will publish our data-driven insights into the crypto asset world through this newsletter. Please direct any comments, questions, and words of feedback to research@21shares.com
Disclaimer
The information provided does not constitute a prospectus or other offering material and does not contain or constitute an offer to sell or a solicitation of any offer to buy securities in any jurisdiction. Some of the information published herein may contain forward-looking statements. Readers are cautioned that any such forward-looking statements are not guarantees of future performance and involve risks and uncertainties and that actual results may differ materially from those in the forward-looking statements as a result of various factors. The information contained herein may not be considered as economic, legal, tax or other advice and users are cautioned to base investment decisions or other decisions solely on the content hereof.


33GI ETF köper bara eurodenominerade företagsobligationer som förfaller 2033

Tre nya börshandlade fonder från Xtrackers

Bitcoin within 15% of its all-time high: Should you still allocate?

HANetfs Hector McNeil förklarar hur ETFer genererar hög avkastning med covered calls

JPEY ETF högavkastande företagsobligationer vautasäkrade till Euro

De bästa lågvolatilitets ETFer på marknaden

Fokus mot en helt ny börshandlad produkt i september 2025

M5TYs senaste utdelningstakt (55 %) belyser covered call-strategins inkomstpotential
Could Bitcoin be the key to your dream house?

Börshandlade fonder för europeiska small caps
-
 Nyheter4 veckor sedan
De bästa lågvolatilitets ETFer på marknaden
-
 Nyheter3 veckor sedan
Fokus mot en helt ny börshandlad produkt i september 2025
-
 Nyheter4 veckor sedan
M5TYs senaste utdelningstakt (55 %) belyser covered call-strategins inkomstpotential
-

 Nyheter4 veckor sedan
Could Bitcoin be the key to your dream house?
-
 Nyheter3 veckor sedan
Börshandlade fonder för europeiska small caps
-

 Nyheter2 veckor sedan
Levler noterar ytterligare fyra börshandlade fonder i Sverige
-

 Nyheter4 veckor sedan
The Investment Case for TLT (Long-Dated Treasury Bonds)
-

 Nyheter3 veckor sedan
Miners Find Their Mojo as Gold Consolidates