
Nyheter
Miners Find Their Mojo as Gold Consolidates

Gold steadies near $3,300; miners soar on strong earnings, discipline, and rising margins, hinting at a potential re-rating and new potential bull cycle for gold equities.
Monthly gold market and economic insights from Imaru Casanova, Portfolio Manager, featuring her distinctive views on mining and gold’s portfolio benefits.
To receive more Gold Investing insights, sign up to our newsletter.
Key Takeaways:
• Gold range-bound near $3,300/oz, with catalysts like Fed turmoil and global risks boosting safe- haven demand
• Gold miners surged in August on strong earnings and capital discipline
• Signs of a sector re-rating suggest gold equities may be entering a new bull cycle
Policy Whiplash, Golden Calm
Gold continues to be supported by heightened uncertainty and volatility stemming from persistent global geopolitical and trade tensions and mixed economic signals. In August, gold itself became entangled in the trade-tariff chaos when news reports suggested that the U.S. had imposed tariffs on 1-kilogram and 100-ounce bars of gold1. The White House and President Trump later reassured markets that gold will not be subject to tariffs2. TACO, indeed! The gold tariff fiasco exemplifies the confusing policy environment in the U.S., with markets trying to re-interpret and price in rapidly changing (and conflicting) information daily.
Gold Holds the Line
The gold price has been range-bound around the $3,300 per ounce level following its strong rally post “liberation” day in April3. This sideways action does not surprise us. In recent years, after significant moves to new highs, the gold price tends to consolidate around a new, higher base before the next catalyst emerges that drives it to the next level. While there are plenty of potential catalysts at present, the timing is impossible to predict, but anything that threatens the stability of the global financial system could lead to a surge in safe-haven demand for gold.
From Tariff Talk to Rally Walk
We had a taste of what some of those catalysts may look like on August 20, when President Trump called for the resignation of – and days later announced he had fired – U.S. Federal Reserve (“Fed”) Governor Lisa Cook4. This escalation in assaults on the Fed by the current administration raised fears that the Fed could lose its independence, threatening the stability and credibility of the world’s most important central bank. Gold rallied in response, also supported by increased probabilities of a Fed cut in September and a weaker dollar, closing at $3,447.95 per ounce on August 29, a $158.02 (4.80%) gain for the month5.
As of 31 August, gold was up 78% over the past five years (31 August 2020 – 31 August 2025). Investors should keep in mind that past performance is not a reliable indicator of future results, and that investment in gold is subject to risks, including volatility, the risk of investing in natural resources, and the possible loss of principal. Investing is subject to risk, including the possible loss of principal.
Returns on this investment may increase or decrease as a result of USD/EUR currency movements.
Calm Metal, Hot Miners
The NYSE Arca Gold Miners Index (GDMNTR) (“GDM”) was up a whopping 21.73% during the month6, while the mid-tier and small cap index, MVIS Global Junior Gold Miners (MVGDXJTR), was up 23.35%7. The gold price increase led to an amplified gain for the gold equities, as expected, reflecting their leverage to the metal price. However, the substantial outperformance suggests other factors, beyond the gold price, supported gold mining shares in August. We believe a key driver was a very strong Q2 2025 earnings season: companies generally reported financial and operating results that met or exceeded expectations, with many companies reporting record revenues and free cash flow. Most companies maintained their yearly guidance, and many larger players reiterated their commitment to higher shareholder returns via dividend payments and share buybacks. Investors seemed reassured that higher gold prices are indeed translating into higher margins, higher profitability, lower debt and enhanced growth prospects for the industry. And while August was not a bad month for broader equities, helped by mega-cap tech dominance and optimistic rate-cut speculation, the S&P 500® Index’s monthly increase of approximately 2%8 paled in comparison to the gold miners’ advance. Richly valued U.S. equities, concerns that growth of mega-cap stocks may be fading and high concentration in AI/tech stocks may also be driving portfolio diversification and rotation of capital that is benefiting gold stocks.
Miners Find Their Mojo
After almost two decades of persistent de-rating, could gold equities finally be getting their mojo back? Our data seems to suggest that it could be the case. We have been tracking the relationship between gold bullion and gold equities (GDM) since 2001 (see chart below) and have identified six clear (strong) trends, indicating a significant and prolonged de-rating of the gold mining sector since 2007. A de-rating occurs when a trendline shifts to the right and/or downward. De-ratings in the past were the result of companies consistently disappointing investors. Examples include massively out- of-the-money hedge books in the 2000’s; over indebtedness and low returns on capital in the 2010’s; and missing production and cost targets in the early 2020’s. Now investors are seeing expanding margins, low debt, capital-allocation discipline, and companies doing what they said they would do this year. While it is too early to tell if a new valuation trend is forming, August data is encouraging and may signal the beginning of a new bull cycle for gold mining stocks. For reference, the bull- market trend of 2001-2007 would imply a GDM value of approximately 6,000 at today’s spot gold price, compared to its present value of around 1,800. A return of those historical sector multiples may seem unrealistic and it’s not part of our outlook, but a significant re-rating of the sector is in the cards, in our view. Investors must keep in mind that past performance is not indicative of future results.
As mentioned above, the chart below maps gold prices against the GDM since 2001, highlighting the six trends—and a potential re-rating with a steeper “new trend” emerging since mid-August 2025.
Gold vs NYSE Arca Gold Miners Index
2001 – 2025 Weekly Close
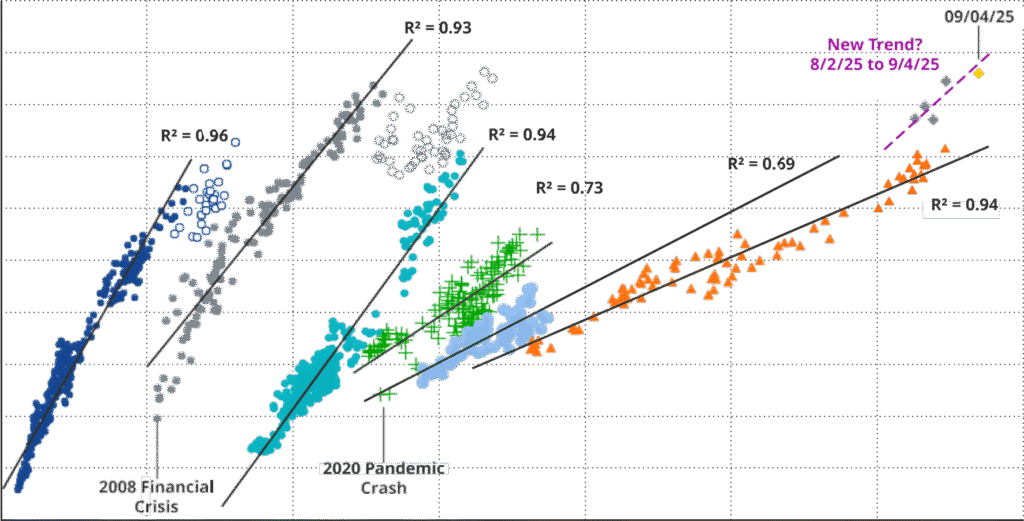
Data as of September 4, 2025. Past performance is no guarantee of future results.
To receive more Gold Investing insights, sign up to our newsletter.
Imaru Casanova
Portfolio Manager,
Gold and Precious Metal
1 Reuters. (07.08.2025)
2 Reuters. (11.08.2025)
3 World Gold Council. (31.08.2025)
4 Reuters, Yahoo Finance. (20.08.2025)
5 World Gold Council. (31.08.2025)
6 FT. (30.08.2025)
7 MarketVector. (31.08.2025)
8 FT. (30.08.2025)
IMPORTANT INFORMATION
This is marketing communication. Please refer to the prospectus of the UCITS and to the KID/KIID before making any final investment decisions. These documents are available in English and the KIDs/KIIDs in local languages and can be obtained free of charge at www.vaneck.com, from VanEck Asset Management B.V. (the “Management Company”) or, where applicable, from the relevant appointed facility agent for your country.


iShares Space Technologies UCITS ETF investera bortom jorden

JIPD ETF delar ut månadsvis

Quantum computers can’t break bitcoin. Yet.

MMAX ETF är en globalfond

SICE ETF köper investment grade företagsobligationer från hela världen

USA satsar 2 miljarder dollar på kvantdatorer – så kan investerare dra nytta av utvecklingen

De bästa ETFerna för att investera i emerging markets

Extrema skillnader: Varför presterar Europas kvantdator-ETFer så olika?

Fastställd utdelning i MONTDIV maj 2026

Varför Plus500 är en dröm för finans-affiliate
-
 Nyheter3 veckor sedan
USA satsar 2 miljarder dollar på kvantdatorer – så kan investerare dra nytta av utvecklingen
-
 Nyheter4 veckor sedan
De bästa ETFerna för att investera i emerging markets
-
 Nyheter2 veckor sedan
Extrema skillnader: Varför presterar Europas kvantdator-ETFer så olika?
-
 Nyheter3 veckor sedan
Fastställd utdelning i MONTDIV maj 2026
-
 Nyheter2 veckor sedan
Varför Plus500 är en dröm för finans-affiliate
-

 Nyheter4 veckor sedan
ASWF ETF är en aktivt förvaltad fond som investerar i Kanada
-

 Nyheter2 veckor sedan
QQCC ETF följer företag världen över som är aktiva inom kvantberäkning
-

 Nyheter2 veckor sedan
21shares produkter nu finns tillgängliga hos Revolut