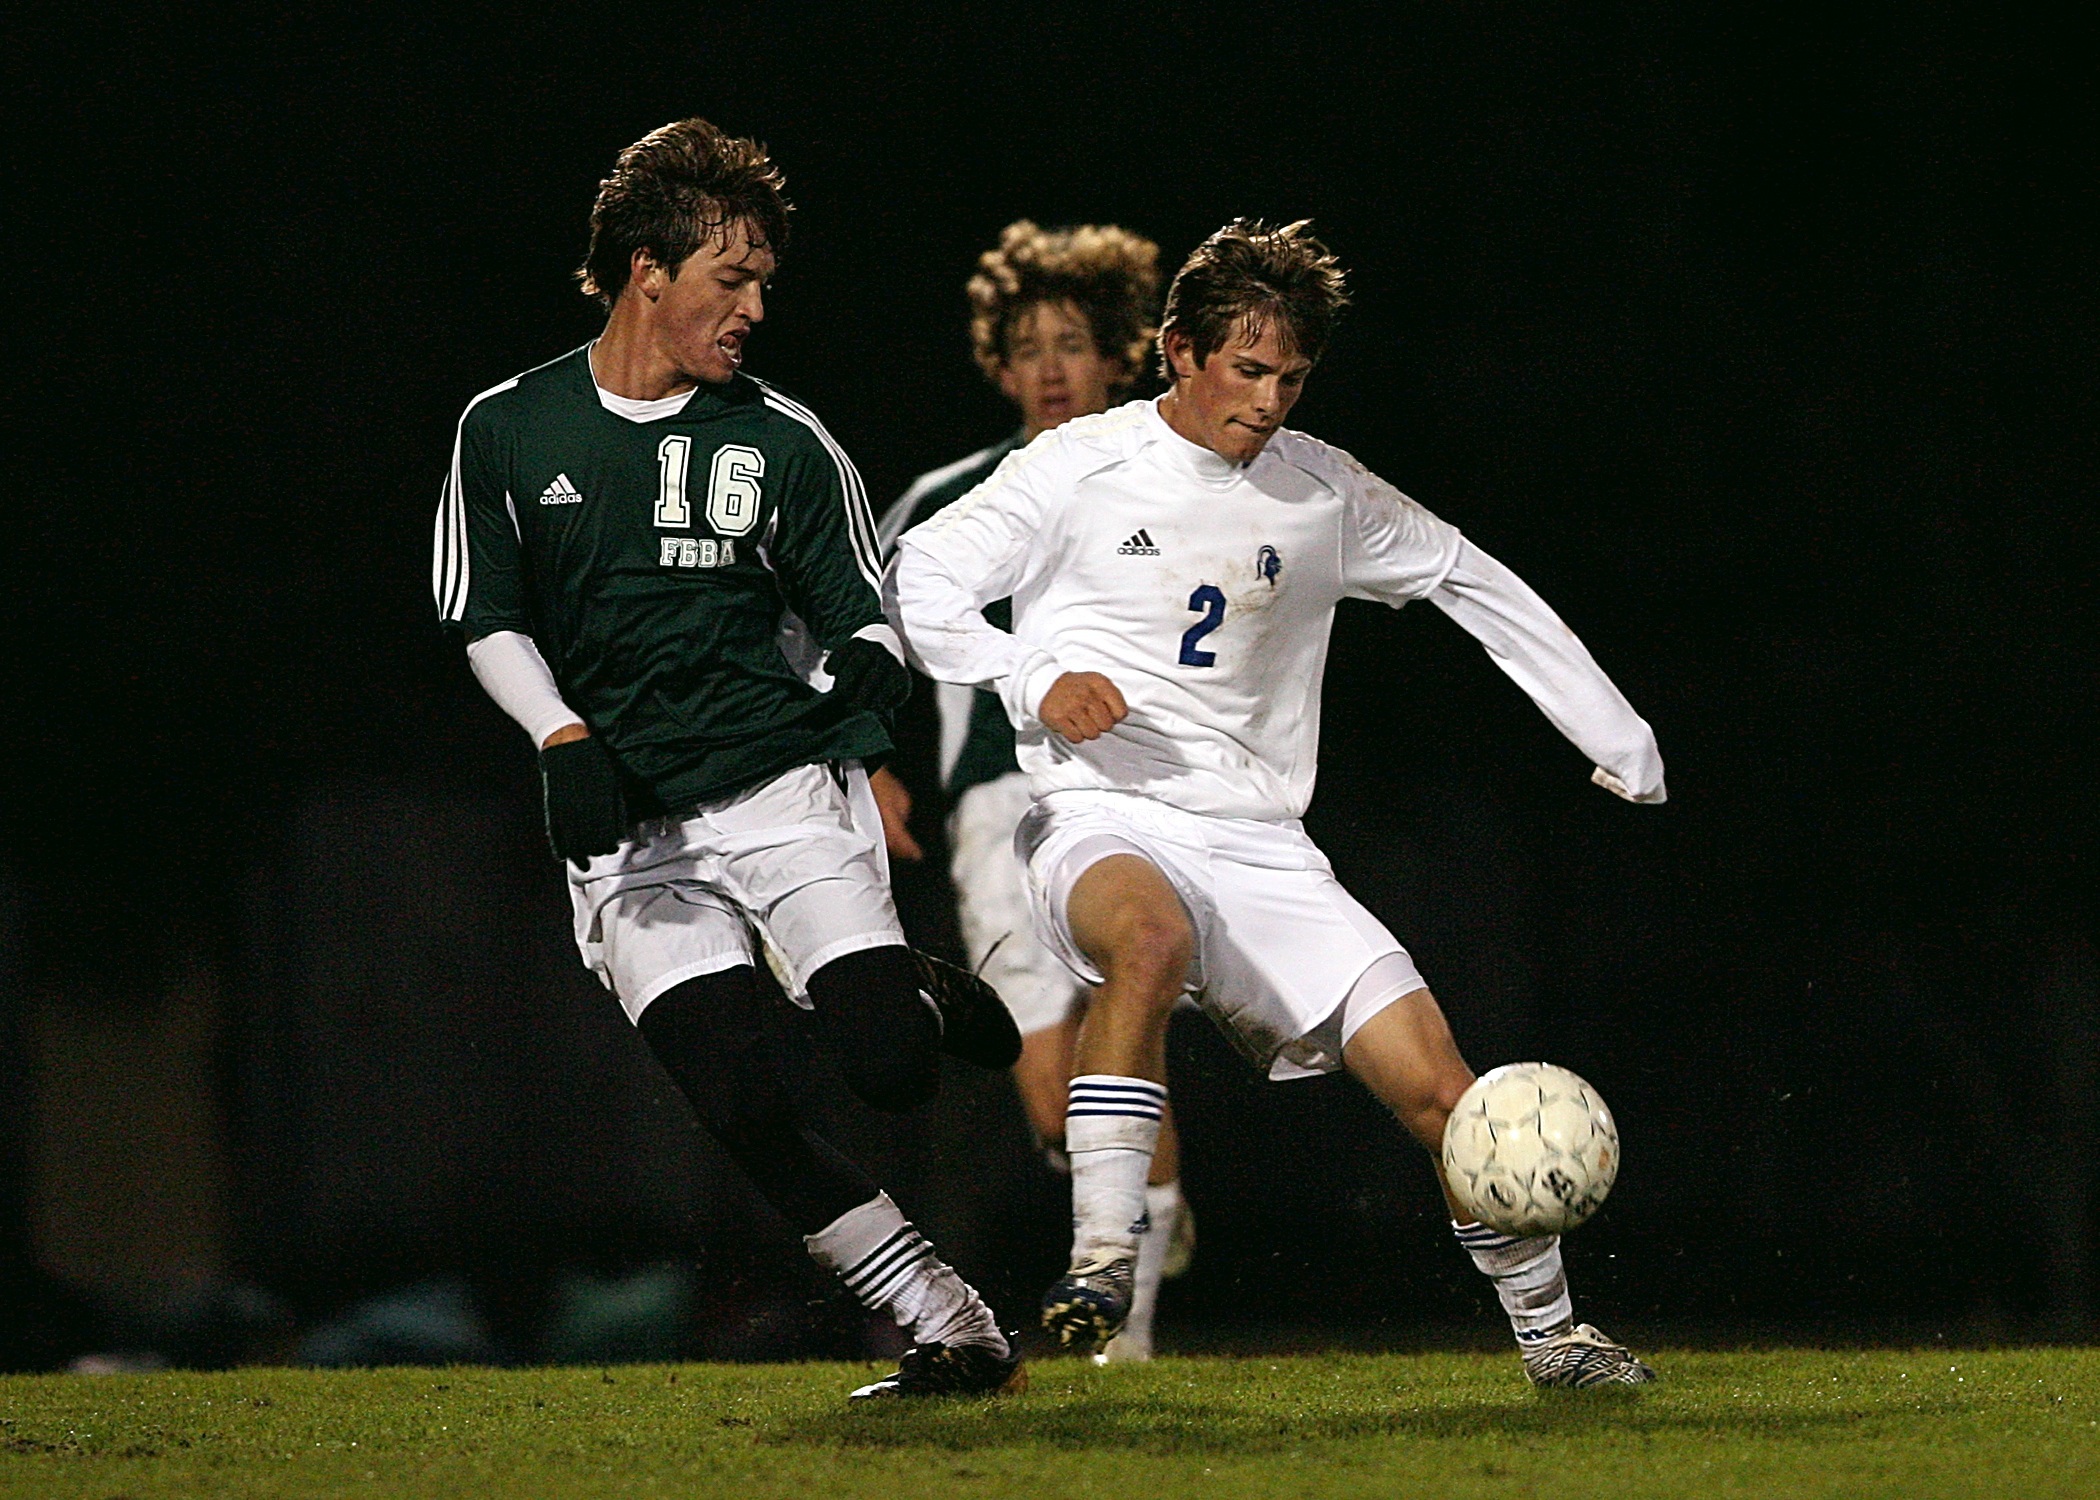
Att det snart börjar ett fotbolls-VM i Nordamerika kan knappast ha undgått någon. Detta har faktiskt fått många placerare att få upp ögonen för helt nya länder och regioner. Vi har sammanställt en kort beskrivning på flera ETFer för fotbolls-VM 2026. Ja det finns en ETF för det också.
Alltså, är det dags att titta på de börshandlade fonderna knutna till de länder som har goda till utmärkta chanser att vinna årets fotbolls-VM. Sammantaget finns det 48 lag i VM vilket gör det till det största någonsin. Flera av dessa har minst en listade landspecifika börshandlad fond och vi nyligen granskade de börshandlade fonderna. Tror det eller ej, det finns några giltiga ETF idéer här.
Vi rekommenderar emellertid inte att någon investerar i ETFer baserat på vad de tror att resultatet i Fotbolls-VM 2026 blir. Denna sammanställning visar att det går att sätta samman en investeringsportfölj baserat på snart sagt alla möjliga idéer. Listan visar och att ETFer är det perfekta instrumentet för att sätta samman en portfölj, oavsett riskprofil eller marknadsinriktning.
Tänk på att volymerna i vissa av dessa börshandlade fonder inte alltid är optimal. Den som köper dessa ETFer tar valutarisker utöver det vanliga då dessa börshandlade fonder primärt listas i Tyskland på Xetra, men kan handlas genom genom de flesta svenska banker och Internetmäklare, till exempel Nordnet, SAVR, DEGIRO och Avanza.
De tre värdländerna är direktkvalificerade, och övriga platser fördelas mellan de sex kontinentala förbunden. Här är de nationer som är klara för turneringen (sorterat efter region):
Värdnationer (Automatiskt kvalificerade)
• USA. Det finns i dag ett stort antal amerikanska börshandlade fonder som ger exponering mot den amerikanska aktiemarknaden. S&P 500® är USAs största aktiemarknadsindex. Detta index spårar de 500 största amerikanska företagen. S&P 500-indexet viktar i sin grundform sina beståndsdelar med fritt flytande marknadsvärde. I denna artikel tittar vi på 26 börshandlade fonder som spårar S&P500.
• Mexiko. Precis som med USA finns det flera emittenter av ETFer som har fastnat för temat Mexiko. Dessa börshandlade fonder finns att handla i Europa. Innan det är dags att köpa aktier, eller börshandlade fonder, så bör den som vill investera i Mexiko, göra sin hemläxa. Mexiko är mer än bara vackra stränder. Landet är den näst största ekonomin i Latinamerika, och endast Brasilien är större. Läs mer om mexikanska ETFer här.
• Kanada är en av värdnationerna, men syns sällan i ETF-sammanhang. Vi gillar den kanadensiska ekonomin och har identifierat ett antal börshandlade fonder som ger exponering mot företag i Kanada. För bara några år sedan var det besvärligt, men framförallt dyrt att investera i kanadensiska aktier. Det är det inte längre. I dag går det att köpa flera olika ETFer med fokus på Kanada.
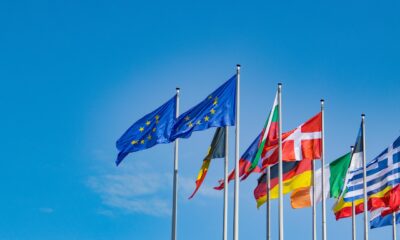
Europa
• Sverige är tillbaka efter att ha missat 2022. Det finns flera börshandlade fonder som ger exponering mot Sverige, den mest kända är XACT Sverige.
• Norge har precis som Sverige en ETF som täcker den egna ekonomin. DNB OBX var den första börshandlade fonden i Norge. Fonden följer OBX-aktieindexet, som består av de 25 mest aktivt handlade aktierna på Oslo Børs (Oslo Börs) under de senaste sex månaderna.
• Frankrikes huvudindex är CAC 40. CAC 40 Index är det viktigaste aktieindexet för franska aktier. Indexet innehåller de 40 största aktierna noterade på den franska börsen Euronext Paris som är särskilt viktiga för den franska ekonomin. Börsvärdet för den fria floaten bestämmer viktningen, i likhet med de flesta andra aktieindex. Läs mer om hur du kan investera på den franska börsen med en ETF.
• Tyskland har vi skrivit om flera gånger. I denna artikel tittar vi på tyska utdelningsaktier. En investering i tyska utdelningsaktier, i alla fall sådana med hög utdelning anses av många vara en solid investering. Utdelning betalas vanligtvis av lönsamma och etablerade företag. För investerare som söker regelbunden inkomst i tider med låga räntor kan tyska utdelningsaktier ge attraktiv avkastning.
• England har inga egna ETFer, men det finns gott om brittiska börshandlade fonder. FTSE 100 är Storbritanniens största aktiemarknadsindex. Den spårar de 100 största brittiska företagen. FTSE 100-indexet väger sina beståndsdelar med fritt flytande marknadsvärde. ETF-investerare kan dra nytta av kursvinster och utdelningar av FTSE 100-beståndsdelarna. För närvarande spåras FTSE 100-indexet av elva olika börshandlade fonder för FTSE 100 som har årliga förvaltningsavgifter på mellan 0,07 och 0,20 procent per år.
• När det gäller Portugal är utbudet av UCITS-fonder betydligt mer begränsat än för de större europeiska marknaderna. Det finns i dagsläget endast en renodlad ETF som följer den portugisiska marknaden, Amundi MSCI Portugal UCITS ETF. Vi hittar emellertid ingen information om en sådan ETF i våra databaser. Det kan vara gamla uppgifter, och att det rär sig om en avnoterad börshandlad fond.
• Nederländerna Det enklaste sättet att investera i Nederländerna är att investera i ett brett marknadsindex. Detta kan göras till låg kostnad genom att använda ETFer. På den nederländska aktiemarknaden hittar du ett index som spåras av tre olika ETFer. Du hittar mer om dessa börshandlade fonder här
• Spanien Det enklaste sättet att investera på den spanska aktiemarknaden är att investera i ett brett marknadsindex. Detta kan göras till låg kostnad genom att använda ETFer. På den spanska aktiemarknaden hittar du tre index som spåras av fyra ETFer.
• Belgien har vi lyckats identifiera en ETF för, men den är svår att handla. Amundi BEL 20 UCITS ETF Dist (BEL ETF) med ISIN FR0000021842, strävar efter att följa BEL20-indexet. BEL20-indexet följer de 20 största belgiska företagen som är noterade på NYSE Euronext-börsen i Bryssel.
• Kroatien har faktiskt en ETF. Expat Croatia CROBEX UCITS ETF (ECDC ETF) är en börshandlad fond som följer utvecklingen av CROBEX Index på Zagreb Stock Exchange, med hjälp av den direkta fysiska replikeringsmetoden. Det är noterat på den bulgariska börsen, på Frankfurtbörsen (XETRA) och på Ljubljanabörsen.
• Italien som är tillbaka efter två missade VM erbjuder flera möjligheter. Det enklaste sättet att investera på den italienska aktiemarknaden är att investera i ett brett marknadsindex. Detta kan göras till låg kostnad genom att använda ETFer, så kallade börshandlade fonder. På den italienska aktiemarknaden hittar du ett index som spåras av ETFer. Du kan välja mellan Amundi FTSE MIB UCITS ETF Dist (MIBX ETF), iShares FTSE MIB UCITS ETF (Acc) (SXRY ETF), iShares FTSE MIB UCITS ETF EUR (Dist) (IMIB ETF) och Xtrackers FTSE MIB UCITS ETF 1D (DBXI ETF).
• Österrike. För den som vill investera i Österrike finns det två börshandlade fonder att välja på, Xtrackers ATX UCITS ETF 1C (XB4A) och iShares ATX UCITS ETF (DE) (EXXX).
• Schweiz På den schweiziska aktiemarknaden hittar du fem index som spåras av nio olika ETFer. Du kan läsa mer om dem under tagen Schweiz.
• Turkiet, eller Türkiye, som landet också kallas, är den nittonde största ekonomin i världen, med en BNP på cirka 906 miljarder dollar. Landet är medlem i OECD och G20 och en allt viktigare givare av officiellt utvecklingsbistånd (ODA). Vill du investera i detta lands aktiemarknad hittar du en sammanställning av börshandlade fonder här
• Tjeckien är kanske inte den mest kända aktiemarknaden, men det finns faktiskt en börshandlad fond som har fokus på detta lands ekonomi, Expat Czech PX UCITS ETF (CZX ETF) är en börshandlad fond som spårar prestanda för PX Index, med hjälp av den direkta fysiska replikeringsmetoden. Det är noterat på den bulgariska börsen och på Frankfurtbörsen (XETRA). Fonden är lämplig för bulgariska och utländska investerare som vill ha en likvid och diversifierad exponering mot den tjeckiska marknaden och regionen som helhet.
• Bosnien och Hercegovina har vi inte lyckats identifiera en ETF för.
Sydamerika
En region som växer snabbt och erbjuder stora möjligheter för den som är intresserad av råvaror, men också hem för Mercado Libre, den latinamerikanska motsvarigheten till Amazon. Att investera är emellertid svårare, det är endast ett enda av de länder som finns med i Fotbolls-VM 2026 som det finns börshandlade fonder anpassade för europeiska investerare.
• Argentina (Regerande mästare) För den argentinska marknaden finns det för närvarande ingen renodlad UCITS-ETF som enbart investerar i landet. Detta beror främst på att den argentinska börsen historiskt har haft utmaningar med likviditet och tillgänglighet för internationella fonder under EU:s regelverk.
• Brasilien Brasiliens ekonomi är historiskt sett den största i Latinamerika och södra halvklotet i nominella termer. Det är en blandekonomi som utvecklar övre medelinkomst. År 2023, enligt Internationella valutafonden (IMF), har Brasilien den nionde största bruttonationalprodukten (BNP) i världen och har den åttonde största köpkraftspariteten i världen. Börshandlade fonder gör det enkelt att kunna investera i Brasilien. Läs mer om ETFer för Brasilien här.
• Uruguay För Uruguay, likt många mindre tillväxtmarknader, finns det i dagsläget ingen renodlad UCITS-ETF som enbart fokuserar på landet.
• Colombia För Colombia är situationen liknande den för Argentina: det saknas för närvarande en renodlad land-ETF som är UCITS-klassad.
• Ecuador För Ecuador finns det i dagsläget ingen renodlad UCITS-ETF som enbart investerar i landets aktiemarknad.
• Paraguay Precis som för många andra mindre marknader i Sydamerika finns det ingen renodlad UCITS-ETF som enbart fokuserar på Paraguay. Landets aktiemarknad är för liten och har inte tillräcklig likviditet för att bära en egen landsfond under EUs regelverk.
Afrika
Den afrikanska kontinenten är svår att investera i, och just därför borde en börshandlad fond utgöra ett bra alternativ. Vi har emellertid endast kunnat identifiera ett enda land där det finns börshandlade fonder, i alla fall UCITS-fonder, och det är Sydafrika.
• Marocko har vi inte lyckats identifiera en ETF för.
• Senegal har vi inte lyckats identifiera en ETF för.
• Egypten har vi inte lyckats identifiera en ETF för.
• Algeriet har vi inte lyckats identifiera en ETF för.
• Nigeria har vi inte lyckats identifiera en ETF för, men det finns en i USA handlad ETF utgiven av Global X.
• Tunisien har vi inte lyckats identifiera en ETF för.
• Elfenbenskusten har vi inte lyckats identifiera en ETF för.
• Sydafrika har en enda börshandlad fond iShares MSCI South Africa UCITS ETF (IBC4 ETF), investerar i aktier med fokus på Sydafrika. Utdelningarna i fonden återinvesteras (ackumuleras). Den totala kostnadskvoten uppgår till 0,65 % per år. Fonden replikerar resultatet för det underliggande indexet genom att köpa alla indexbeståndsdelar (full replikering). iShares MSCI South Africa UCITS ETF är en liten ETF med tillgångar på 80 miljoner GBP under förvaltning. IBC4 ETF är äldre än 5 år och har sin hemvist i Irland.
• Kap Verde har vi inte lyckats identifiera en ETF för.
Asien
• Japan På den japanska aktiemarknaden hittar du sju index som spåras av ETFer. Förutom dessa index kan sex alternativa index för små och medelstora företag eller aktiestrategier övervägas. Läs mer i artikeln Investera i Japan med hjälp av en ETF
• Sydkorea På den sydkoreanska aktiemarknaden finns det tre index som spåras av sex olika ETFer. Ett annat alternativ är att investera i index på Asien-Stillahavsområdet och tillväxtmarknader. Nyfiken på vilka?
• Australien Att investera i Australien kan göras till låg kostnad genom att använda ETFer. Du hittar mer information om hur du kan handla autraliensiska ETFer här.
• Iran har vi inte lyckats identifiera en ETF för.
• Saudiarabien fick för åtta år sedan status som emerging market, och det har lett till att flera ETF-emittenter har skapat sina egna börshandlade produkter på denna marknad. Du hittar mer information om dessa här
• Qatar har vi inte lyckats identifiera en ETF för.
• Uzbekistan har vi inte lyckats identifiera en ETF för.
• Jordanien har vi inte lyckats identifiera en ETF för.
Nord- och Centralamerika
• Panama har vi inte lyckats identifiera en ETF för.
• Haiti har vi inte lyckats identifiera en ETF för.
• Curaçao (Debut!) har vi inte lyckats identifiera en ETF för.
Oceanien
• Nya Zeeland har vi inte lyckats identifiera en ETF för, men det finns en i USA.


 Nyheter6 dagar sedan
 Nyheter2 veckor sedan
 Nyheter4 veckor sedan