ETFS Multi-Asset Weekly – Mixed Jobs Report Keep Investors Guessing
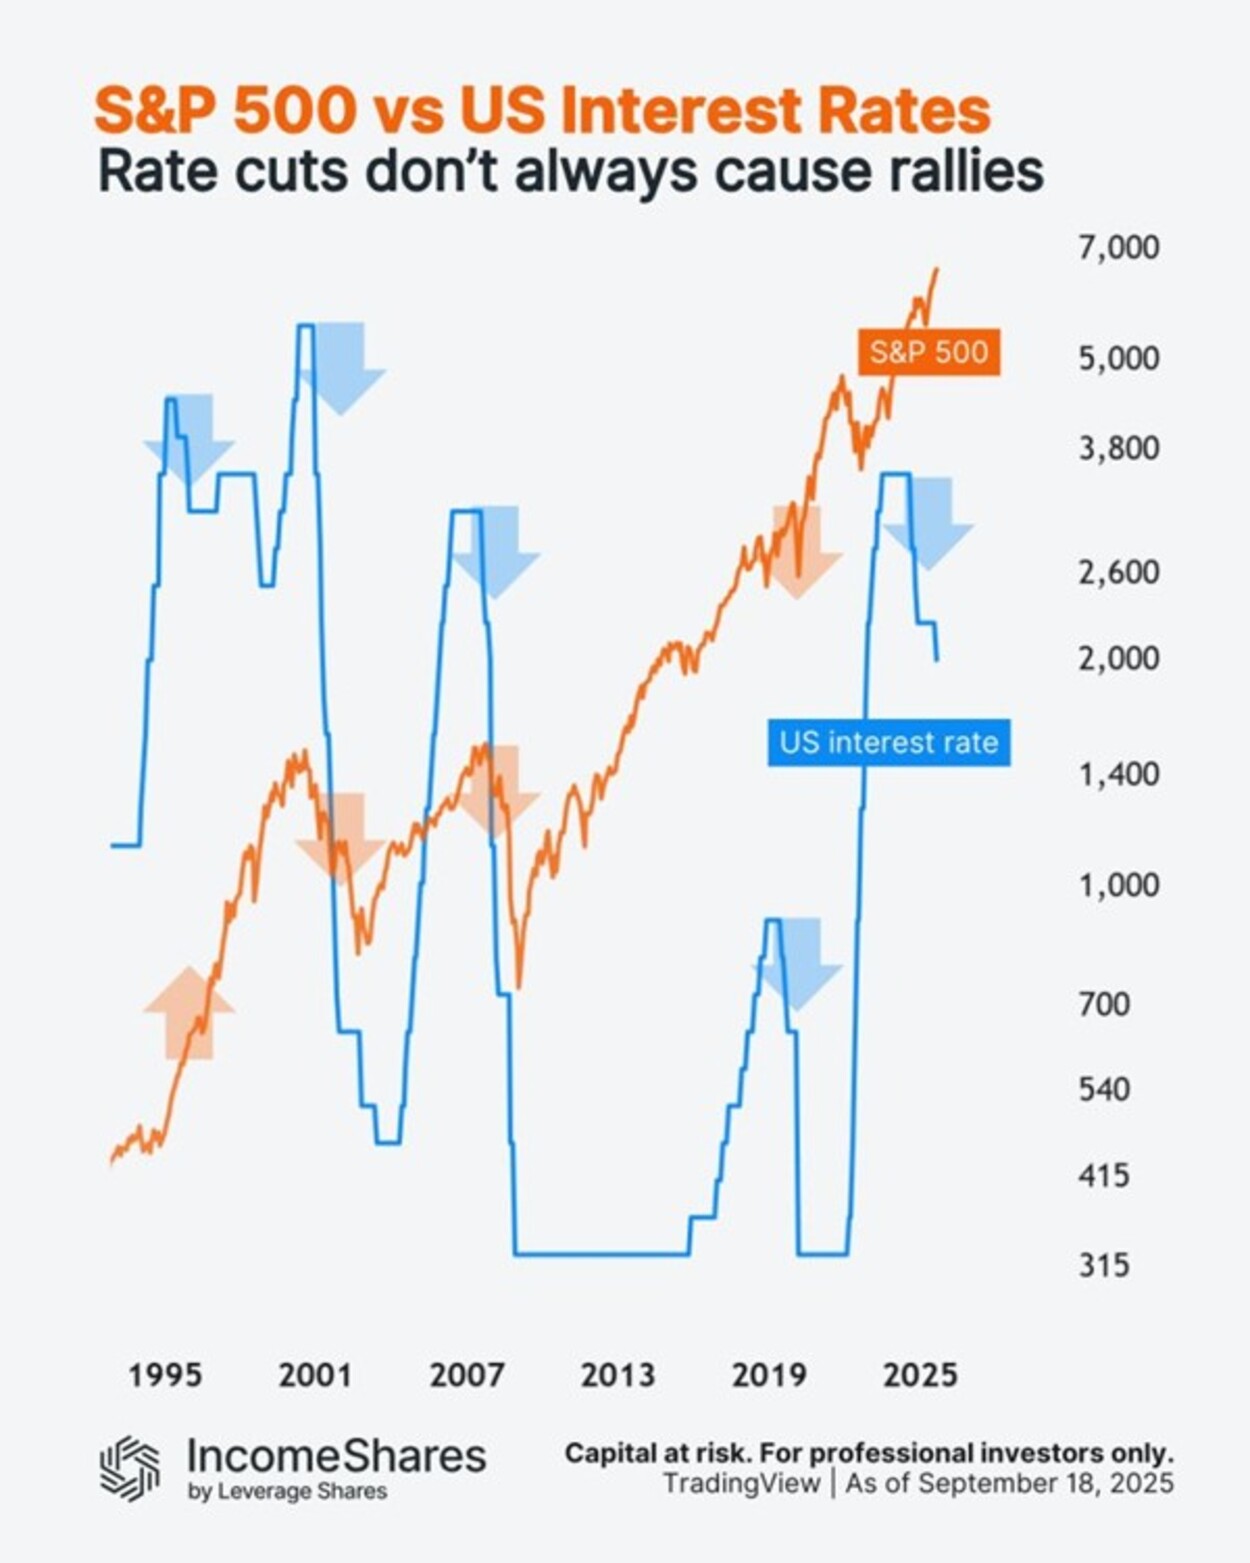
Download the complete report (.pdf)
Highlights
• Commodities: Persistent surplus weighs on oil prices. • Equities: Global equity market sell off continues amid weaker PMI and US payrolls data. • Currencies: Dollar stages a comeback after August jobs report
The European Central Bank revised downwards its growth and inflation forecasts, paving the way for further policy stimulus. The Chinese authorities followed suit, revising their growth expectations down to 7.3% this year from 7.4% earlier. The US Federal Reserve is likely to maintain caution in this environment and hold off raising rates in September despite falling unemployment. A number of central banks meetings this week (Bank of England, Bank of Canada, Reserve Bank of Canada), will shed light on how other policy makers have interpreted the recent volatility.
Commodities
Persistent surplus weighs on oil prices. Oil capped its biggest three day rally in 25 years after the weekly build up in US crude oil stocks rose by 4.7mn barrels. Saudi Arabia reasserted its stance to maintain market share by lowering its official selling prices for October. President Obama clinched sufficient votes in the US Senate to secure the Iranian nuclear deal reinstating the oversupply in oil market. Gold lost its lustre on the back of a strengthening US dollar. Sugar prices were positively impacted by fears of heavy rainfall impacting the Brazilian sugar cane harvest and a sharp rise in Thai sugar exports to China. The negative impact of the stronger US dollar on US exports coupled with ample EU wheat supply extended wheat’s downward trajectory. China’s downward revision of GDP forecasts is likely to can the cap the industrial metal price rally seen last week.
Equities
Global equity market sell off continues amid weaker PMI and US payrolls data. France’s purchasing manufacturers index (PMI) data shrank more than expected while stronger German PMI data helped drive a rebound in the DAX in the second half of the week. UK Services grew at the weakest pace in more than two years in August, weighing on the FTSE 100. A mixed labour market report, showing below-expectations payrolls but a surprising fall in unemployment, helped maintain equity market volatility. Implied S&P volatility (VIX) rose to 27.1 (up 4%), while small-cap equities (Russell 2000) fell 0.7%. Chinese equities responded positively to the interest rate cuts from the prior week, but continued intervention from the government casts doubts as to whether the gains are sustainable.
Currencies
US Dollar stages a comeback after August jobs report. Currencies from commodity exporting nations bore the brunt of the dollar’s gains. While the gain in US jobs were weaker-than-expected, the highest average hourly earnings since March and the lowest jobless rate since April 2008 (considered to be full employment by the Federal Reserve) raised the appeal of dollar denominated holdings. The euro retreated on the back of an increasing likelihood of further easing after the ECB meeting. Sweden’s krona climbed to a six week high versus the euro after the Riksbank kept its repo rate unchanged at 0.35 percent confirming the current stimulus is helping steer the economy out of a deflationary trap. Disappointing second quarter GDP growth and an unexpected decline in retail sales caused the Australian dollar to hit six year lows this week.
For more information contact:
ETF Securities Research team ETF Securities (UK) Limited T +44 (0) 207 448 4336 E info@etfsecurities.com
Important Information
General
This communication has been issued and approved for the purpose of section 21 of the Financial Services and Markets Act 2000 by ETF Securities (UK) Limited (”ETFS UK”) which is authorised and regulated by the United Kingdom Financial Conduct Authority (”FCA”).
Investments may go up or down in value and you may lose some or all of the amount invested. Past performance is not necessarily a guide to future performance. You should consult an independent investment adviser prior to making any investment in order to determine its suitability to your circumstances.
Amid soaring US debt and Gold’s steady gains, Bitcoin has continued to deliver strong returns over the past 15 years. Its scarcity and decentralization make it a hedge that investors can’t ignore, providing new ways to pursue growth, security, and opportunity in an evolving financial landscape.
Investors can’t ignore the corporate world’s big bet on Ethereum
Ethereum is stealing the spotlight, as public companies have accumulated over 4.4 million ETH, worth nearly $19 billion, in the past few months. This treasury boom is outpacing Bitcoin’s early adoption and redefining how Wall Street approaches digital assets.
The rise of Hyperliquid: DeFi’s record-breaking powerhouse
Hyperliquid is making waves in DeFi perpetuals by setting new records, leading trading volumes, and propelling its token to all-time highs. Backed by market volatility, high-performance infrastructure, and concentrated liquidity, the platform continues to draw investors and assert its market dominance.
Research Newsletter
Each week the 21Shares Research team will publish our data-driven insights into the crypto asset world through this newsletter. Please direct any comments, questions, and words of feedback to research@21shares.com
Disclaimer
The information provided does not constitute a prospectus or other offering material and does not contain or constitute an offer to sell or a solicitation of any offer to buy securities in any jurisdiction. Some of the information published herein may contain forward-looking statements. Readers are cautioned that any such forward-looking statements are not guarantees of future performance and involve risks and uncertainties and that actual results may differ materially from those in the forward-looking statements as a result of various factors. The information contained herein may not be considered as economic, legal, tax or other advice and users are cautioned to base investment decisions or other decisions solely on the content hereof.
iShares NASDAQ 100 SwapUCITSETF USD (Acc) (N100 ETF) med ISIN IE0001ZFMLN7, försöker följa Nasdaq 100®-indexet. Nasdaq 100®-indexet spårar ett urval av 100 aktier valda bland icke-finansiella aktier noterade på NASDAQ-börsen.
Den börshandlade fondens TER (total cost ratio) uppgår till 0,20 % p.a. ETFen replikerar det underliggande indexets prestanda syntetiskt med en swap. Utdelningarna i ETFen ackumuleras och återinvesteras.
iShares NASDAQ 100 SwapUCITSETF USD (Acc) är en mycket liten ETF med 4 miljoner euro under förvaltning. Denna ETF lanserades den 3 oktober 2024 och har sin hemvist i Irland.
Varför N100?
Exponering mot 100 av de största amerikanska och internationella icke-finansiella aktierna noterade på NASDAQ-börsen.
Exponering för företag inom stora industrigrupper inklusive hårdvara och mjukvara, telekommunikation, detaljhandel/grossisthandel och bioteknik.
Använd i din portfölj för att söka tillväxt på medellång till lång sikt även om fonden också kan vara lämplig för kortsiktig exponering mot index.
Investeringsmål
Fonden strävar efter att uppnå avkastning på din investering, genom en kombination av kapitaltillväxt och inkomst på fondens tillgångar, vilket återspeglar den totala nettoavkastningen för NASDAQ 100-indexet (”Indexet”).
IncomeShares passed three milestones in August. Assets under management climbed to almost $66 million, cumulative fund flows topped $72 million, and turnover across London and Xetra listings reached over $27 million. Palantir paid the highest annualised distribution yield at 57.11%. The sections below break the numbers down in more detail.
Cumulative fund flows
Fund flows track how much money investors put into or take out of IncomeShares ETPs (exchange-traded products). Positive flows mean more money coming in than going out – a sign of demand for the products.
Flows have risen every month this year. In January, they stood at $13.7 million. By the end of August, they reached $72.4 million. That’s over $8 million of new money added in August alone – the biggest increase since May.
Trading turnover
Turnover is the total dollar value of IncomeShares ETPs bought and sold on the exchanges. Higher turnover means more activity and liquidity for investors.
Turnover reached $27.3 million in August – the highest on record and more than double January’s $13.0 million. London listings (USD and GBP combined) made up $14.2 million, with Xetra listings close behind at $13.1 million. Both exchanges have seen steady increases through 2025, showing rising interest in income options strategies across the board.
Note: Figures use IDC FX rates as of the August month-end to convert GBP and EUR into USD. We apply the same August rates to all prior months to compare turnover on a like-for-like basis.
Assets under management (AUM)
AUM is the total value of assets held across all IncomeShares ETPs. It grows when new investors buy in, or when the underlying assets rise in value.
AUM grew from $13.8 million in January to $65.8 million at the end of August. It was also $8 million more than in July. Steady inflows and consistent income distributions are helping the product range build scale.
Distribution yields
Distribution yields represent the annualised income paid to investors as a percentage of the current NAV (net asset value), based on the latest month’s yield. IncomeShares ETPs aim to generate this income from selling options. Yields change each month depending on strategy performance and market volatility.
Annualised August yields (ranked highest to lowest):
Our Palantir ETP topped the list with an annualised yield of 57.11% for August, up from 30.57% in July. The stock was volatile in August, trading between $142 and $190. That wider range increased option premiums, which boosted the ETP’s yield. The ETP sells put options on Palantir stock and holds shares – the strategy used for all our single stock ETPs and the Magnificent 7 product.
The Nasdaq 100 ETP paid an annualised yield of 46.44% in August, up slightly from 44.52% in July. At the other end, Gold+ and Microsoft stayed below 7%, reflecting relatively calmer conditions in their underlying assets.
The table below shows the annalised distribution yields for all IncomeShares ETPs so far this year. Note that the bottom eight ETPs launched in late June, so they only have yields for July and August.
Key takeaways
• Fund flows climbed to $72.4 million, with August adding more than $8 million.
• Turnover hit a record $27.3 million, split almost evenly between London and Xetra.
• Palantir topped the yield table at 57%, with Nasdaq 100 and Coinbase also paying above 40%.