Följ oss

Nyheter

Gold to outshine gold miners

Publicerad

den

Stronger Q1 2016 earnings coupled with the rising price of gold helped improve sentiment towards gold miners, driving the rally so far. Gold to outshine gold miners
  • Stronger Q1 2016 earnings coupled with the rising price of gold helped improve sentiment towards gold miners, driving the rally so far. Gold to outshine gold miners
  • Lower all-in sustaining costs are reflective of declining capital expenditure. While it boosts current profitability it is detrimental to sustaining the long term growth of gold miners.
  • For the gold miners rally to continue, the current pace of margin expansion will require gold prices to be at $1510 by Q2 2016.
  • Gold will likely reflect deterioration in economic or political uncertainty quicker than gold miners and hence we favour the metal versus the equity.

Gold miners tighten their belts too much too fast

Gold miners have skyrocketed since the start of the year, staging a 81.6% rally. That is the strongest 6-month rally we have seen in the sector. We believe stronger Q1 2016 earnings results coupled with the rising gold price improved sentiment, helping drive inflows towards this beleaguered sector. However, we believe the rally has run out of steam. For the purpose of this report gold miners refer to the constituents of the DAXglobal Gold Miner’s Total Return index.

The greatest success in gold miners’ financial restructuring has been a reduction of excessive debt loads. Gold miners’ debts became hard to service when gold prices were trading at a lower price. They have achieved the debt reduction by selling non-performing assets, rejecting future capital expenditure, reducing their workforce and cutting dividends. The chart below illustrates how record high debt levels dragged the performance of gold miners lower.

ETFS1

While reducing their debt has improved current operating margins and cash flow, it will come at the expense of future profitability. Gold miners’ production has been in decline since 2007. We believe there will come a point, when the aggressive debt reduction via postponement of future exploration projects and sale of non-performing assets will dent future growth prospects.

Lower Capex detrimental to future profitability

In 2013 the World Gold Council (WGC) established a new cost disclosure framework by introducing “all-in sustaining costs” (AISCs) as an extension to cash costs. As the term implies, AISC focuses on all costs incurred in sustaining production for the complete mining lifecycle, from exploration to closure. AISC is currently at $857, well below its 5-year average of US$1019 and has been trending lower over the past four quarters. In response to declining gold prices over past years, capital expenditure has been curtailed extensively – 21% drop over the prior year. We believe the curtailment of capital expenditure is the chief reason behind the consistent decline in AISC. A stronger gold price environment in 2016 has widened the gulf between gold mining costs on an AISC basis and gold prices, boosting gold miner’s profitability by 80% on average over the prior quarter in Q1 2016. While declining capital expenditures translate into lower AISC, improving short term profitability, it comes at a cost to longer term growth.

Where does gold need to be to extend the miners current rally

Despite gold’s stellar performance, returning 19.3% so far in 2016, gold miners’ have clearly outperformed, returning 81.6% over the same time frame. Gold miners’ outperformance reflects the sectors’ inherent profit leverage on gold prices. Based on historic observations, the 55% y-o-y gain in the gold miners’ index implies that Q2 2016 profit margins will rise to 19%, up from 10% in Q1 2016. We are doubtful that profit margins have improved that much because, once again based on historic relationships, it would indicate a gold price of over US$1510/oz by the end of Q2 2016. We believe that gold miners’ prices look over-extended and we expect a pull-back based on fundamentals.

Gold miner’s valuations unfavourable

With a correlation of 0.72, rising gold prices have clearly been a catalyst for the rally in gold miners. Gold miners beta varies across the cycle with the beta at 1.44x (in a rising gold price environment), which is considerably lower than the beta when gold prices are falling.

The price to earnings ratio over Q4 2015 and Q1 2016 were at 60x and 51x respectively and has currently declined to 38x as earnings recovered more than prices rose. We believe more attention needs to be paid to other valuation metrics in this capital intensive industry. The price-to-book ratio (P/B) is a valuable metric as it incorporates the value of assets. P/B has risen in the past quarter as a 53% surge in asset write-downs and impairments have reduced the book value, without a commensurate reduction in the price. The price-to-book ratio increased to 2.4x in Q1 2016 from 1.4x in Q4 2015, which is above the 10-year average at 2.2x, highlighting that gold miners have become more expensive.

ETFS4

Gold miners have cut dividends on average by 38% over the prior year reducing their dividend yield to 0.83%, which is close the sector’s 10-year average of 0.87%. Taking into consideration gold miner’s annualised volatility of 84% is twice that of gold of 42%, we believe gold offers a much better risk adjusted return profile in comparison to gold miners. After posting the sharpest 6-month rally in history, we are of the opinion that the current rate of acceleration in the gold mining sector cannot continue indefinitely.

Mounting risks support gold

We believe that gold will likely reflect deterioration in economic or political uncertainty quicker than gold miners and hence we favour the metal versus the equity. Economic and political uncertainty is elevated with the vote on the EU referendum, the Spanish and US elections and slowing global growth, weighing on investors’ minds. Gold miners are exposed to a number of unknown risks such labour disputes, power outages, political upheavals and adverse currency movements that cannot be discounted. While gold miners have been prudent to reduce their debt, we believe the priority to clean up their balance sheets will come at the cost of future growth opportunity. While rising gold prices and falling AISC have provided the dual benefit of improving gold miner’s profitability. We caution against being too optimistic over falling AISC as it is more reflective of declining capex which will likely to impact future profitability. From a valuation perspective, we believe gold miners are moderately valued and don’t favour a compelling reason to buy at this point in time.

Important Information

General

This communication has been issued and approved for the purpose of section 21 of the Financial Services and Markets Act 2000 by ETF Securities (UK) Limited (“ETFS UK”) which is authorised and regulated by the United Kingdom Financial Conduct Authority (the “FCA”).

The information contained in this communication is for your general information only and is neither an offer for sale nor a solicitation of an offer to buy securities.
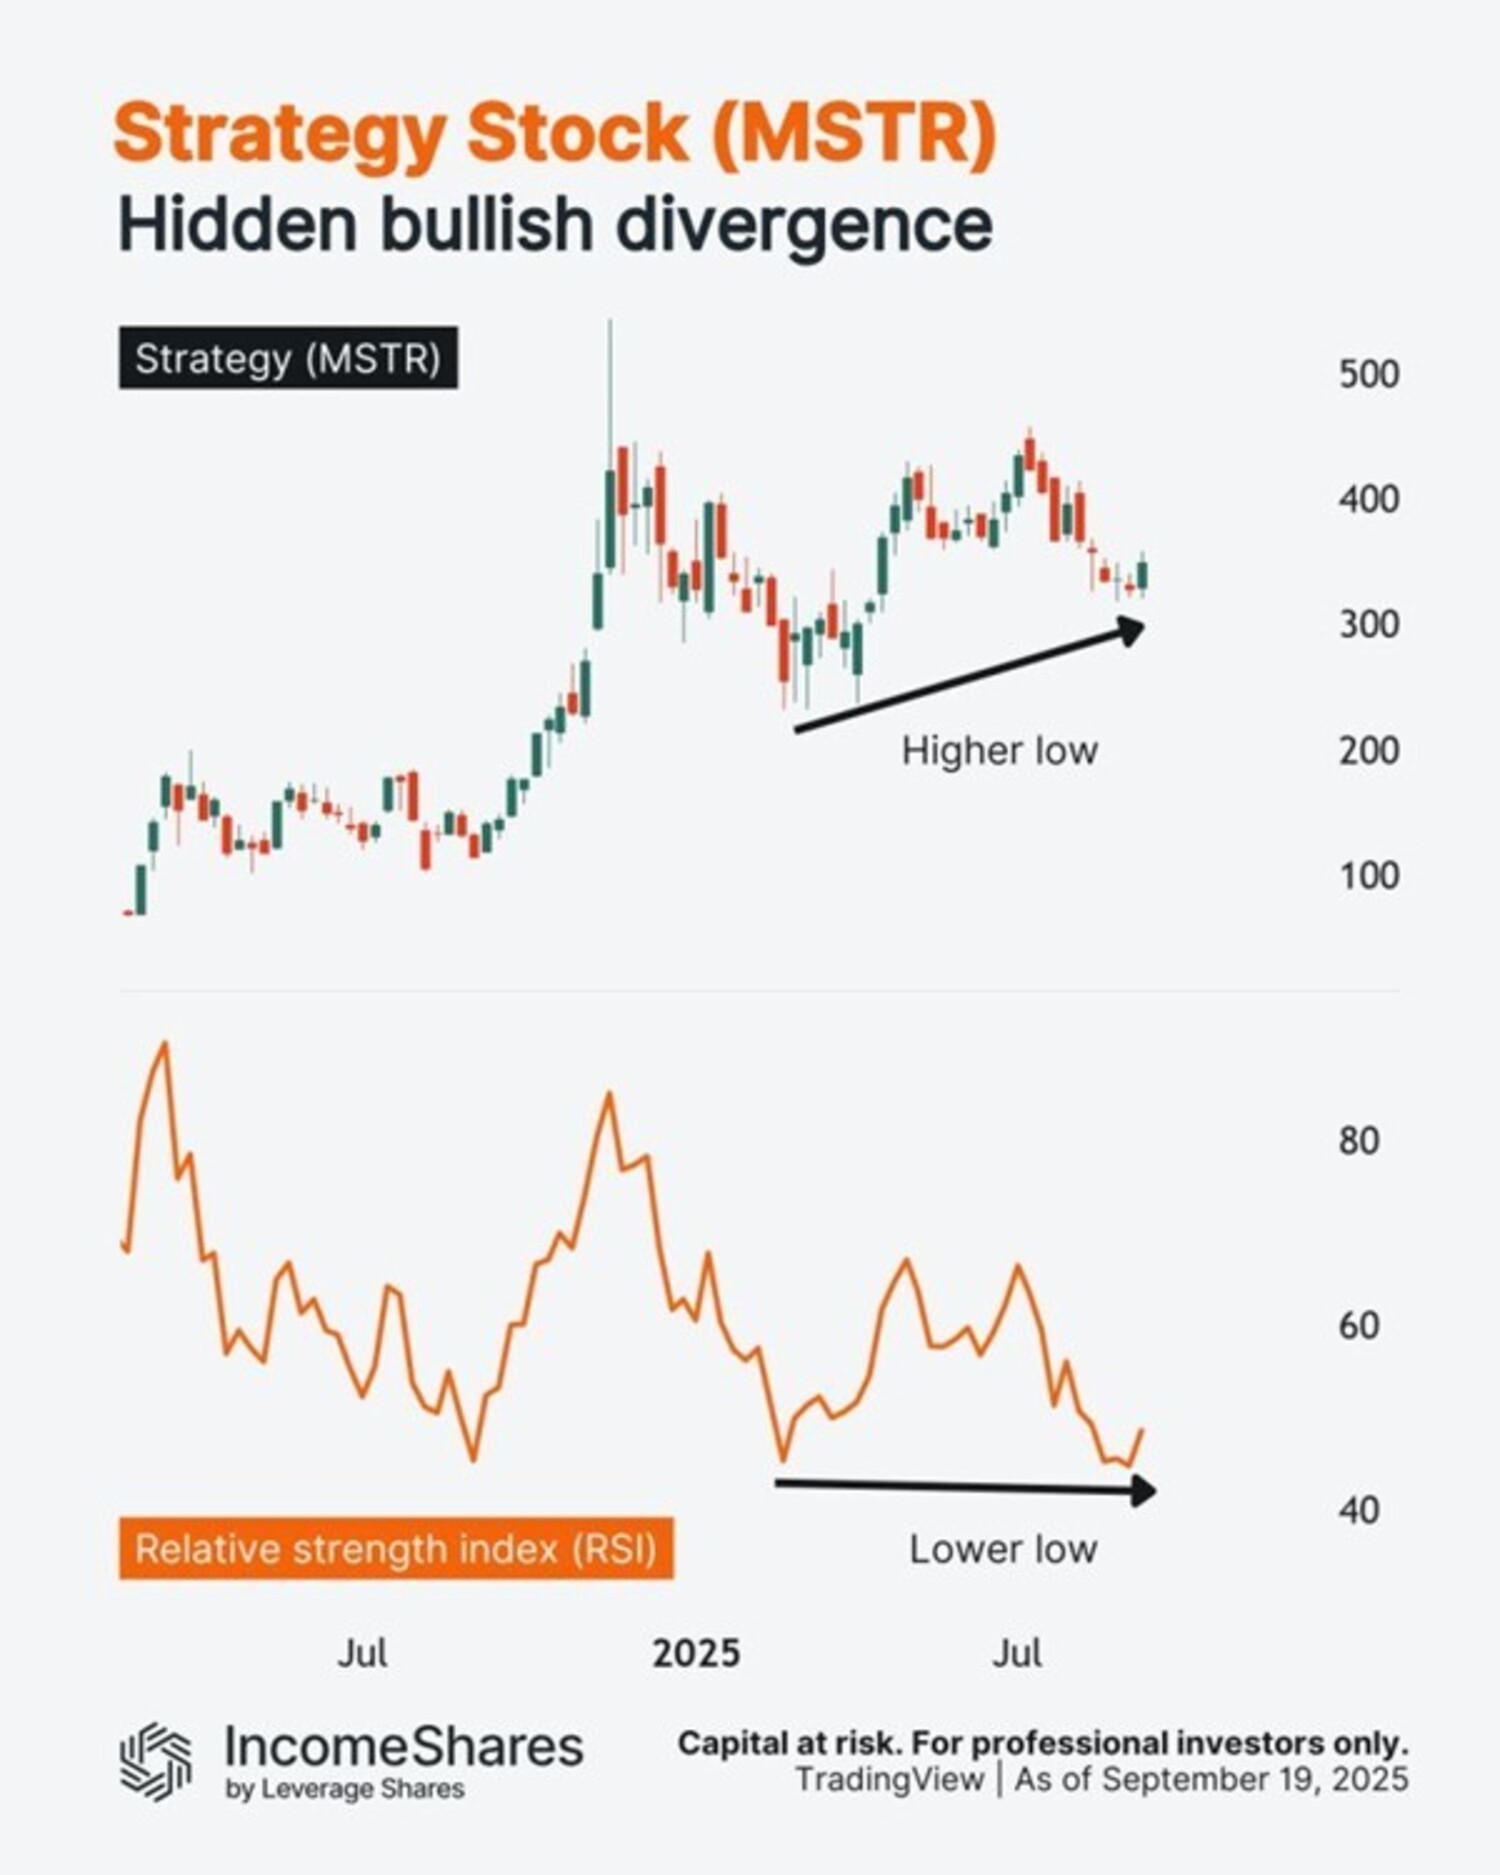
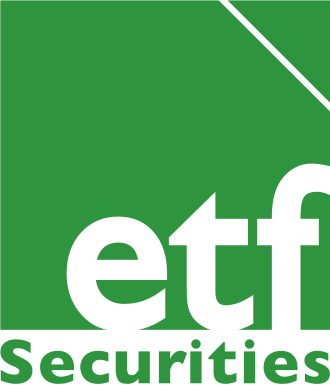
Fortsätt läsa
Annons
Klicka för att kommentera

Skriv en kommentar

Din e-postadress kommer inte publiceras. Obligatoriska fält är märkta *

Nyheter

April in ETFs: Gold at New Highs, Crypto in Transition, and Moat Index Holding Steady

Publicerad

den

As April winds down, markets remain on edge, with escalating tariffs and renewed trade tensions keeping volatility in focus. In this summary of our full-length newsletter, we spotlight gold and gold equities, both of which have surged to record levels. We also take a step back from the day-to-day noise in crypto to explore the broader shifts in the regulatory landscape in our latest Whitepaper and present Celestia in detail. Finally, we assess how Moat indexes have held up and evolved amid the turbulence.

As April winds down, markets remain on edge, with escalating tariffs and renewed trade tensions keeping volatility in focus. In this summary of our full-length newsletter, we spotlight gold and gold equities, both of which have surged to record levels. We also take a step back from the day-to-day noise in crypto to explore the broader shifts in the regulatory landscape in our latest Whitepaper and present Celestia in detail. Finally, we assess how Moat indexes have held up and evolved amid the turbulence.

Your VanEck Europe team wishes you a great read.


Featured Articles

🥇 Are Gold Mining Equities Regaining Attention Amid Rising Gold Prices?

Gold & Gold mining equities tend to shine during stress periods

Source: VanEck, World Gold Council.

Gold has attracted renewed interest from investors amid concerns about inflation, currency volatility, and overall market uncertainty. Gold mining companies have recently reported improved profit margins and cash generation, with some initiating share buybacks and maintaining relatively strong balance sheets. Despite these developments, many continue to trade below their historical valuation averages.

While historical trends indicate that gold and gold mining equities have outperformed during certain periods of market stress, these patterns may not repeat under different economic conditions. Performance can be influenced by a range of factors including interest rates, central bank policy, geopolitical developments, and investor sentiment.

→ Read more

⚖️ Whitepaper Highlights: How New Crypto Regulations May Shape the Future

Cryptocurrencies are entering a new era. With the re-election of Donald Trump and the implementation of the European Union’s Markets in Crypto-Assets (MiCA) regulation, digital assets are moving into a landscape defined not just by innovation, but also by regulatory clarity.

MiCA’s structured and transparent approach aims to promote legitimacy, safeguard investors, and enhance trust in digital asset markets across Europe. It could also serve as a blueprint for other jurisdictions looking to regulate crypto effectively.

→ Read the Whitepaper Highlights

⛓️ Introduction to Celestia

Most blockchains, like Ethereum or Bitcoin, are monolithic which means they perform all major functions (consensus, data availability, and execution) on a single layer. This design ensures security but according to new modular networks, limits scalability and flexibility.

The modular blockchain thesis, which Celestia is leading, proposes separation of layers and respective responsibilities in the network.

→ Read more

Note: This article in not accessible to our UK readers.

🌊 Riding the Gold Wave

Chasing the Vein: Fund Flows into Gold Miners

Source: Mining.com. Data as of 21 March 2025. Note: Data covers 493 funds with combined assets under management of $62 billion.

U.S. equity markets experienced significant declines during the month of March. Meanwhile, spot gold price recorded new all-time highs, surpassing the $3,000 per ounce mark on 14 March and closing at a record price of $3123.57 on March 31, a 9.30% ($265.73) monthly gain. As of 31 March, gold prices have risen by 93.61% over the past five years (1). Investors should keep in mind that past performance is not representative of future results.

The gold miners, as represented by the NYSE Arca Gold Miners Index (GDMNTR), outperformed significantly, up 15.51% during March (2). This gain reflects both their operational leverage to rising gold prices and market perceptions of relative value. However, gold miners can also be subject to heightened volatility, operational risks, and sensitivity to commodity price swings.

While gold and gold equities may serve as diversifiers in a portfolio due to their historically low correlations with many asset classes, investors should remain mindful of the inherent risks, including price volatility, currency movements, and shifts in investor sentiment that can lead to rapid reversals in performance.

→ Read more

🌪️ Moat Stocks Weather Tariff Tumble

Market turbulence in March weighed on stocks. The Moat Index was not immune to the market turmoil, as it declined along with the broad U.S. equity market ending the month lower. However, the Moat Index showed resilience relative to the S&P 500—thanks in part to defensive sector resilience and underweight exposure to mega-caps.

At the same time, the SMID Moat Index lagged small and mid-caps in March. Smaller U.S. stocks were also impacted by global trade tensions and economic growth concerns with the broad small- and mid-cap benchmarks falling during the month. However, year-to-date, the SMID Moat Index remains ahead of the broader small- and mid-cap markets.

→ Read more


This is a preview of our monthly ETF insights email newsletter.

To receive the full version, sign up here.


(1) Source: World Gold Council, ICE Data Services, FactSet Research Systems Inc.

(2) Source: Financial Times.

IMPORTANT INFORMATION

This is marketing communication. Please refer to the prospectus of the UCITS and to the KID/KIID before making any final investment decisions. These documents are available in English and the KIDs/KIIDs in local languages and can be obtained free of charge at www.vaneck.com, from VanEck Asset Management B.V. (the “Management Company”) or, where applicable, from the relevant appointed facility agent for your country.

For investors in Switzerland: VanEck Switzerland AG, with registered office in Genferstrasse 21, 8002 Zurich, Switzerland, has been appointed as distributor of VanEck´s products in Switzerland by the Management Company. A copy of the latest prospectus, the Articles, the Key Information Document, the annual report and semi-annual report can be found on our website www.vaneck.com or can be obtained free of charge from the representative in Switzerland: Zeidler Regulatory Services (Switzerland) AG, Neudtadtgasse 1a, 8400 Winterthur, Switzerland. Swiss paying agent: Helvetische Bank AG, Seefeldstrasse 215, CH-8008 Zürich.

For investors in the UK: This is a marketing communication targeted to FCA regulated financial intermediaries. Retail clients should not rely on any of the information provided and should seek assistance from a financial intermediary for all investment guidance and advice. VanEck Securities UK Limited (FRN: 1002854) is an Appointed Representative of Sturgeon Ventures LLP (FRN: 452811), which is authorised and regulated by the Financial Conduct Authority (FCA) in the UK, to distribute VanEck´s products to FCA regulated firms such as financial intermediaries and Wealth Managers.

This information originates from VanEck (Europe) GmbH, which is authorized as an EEA investment firm under MiFID under the Markets in Financial Instruments Directive (“MiFiD). VanEck (Europe) GmbH has its registered address at Kreuznacher Str. 30, 60486 Frankfurt, Germany, and has been appointed as distributor of VanEck products in Europe by the Management Company. The Management Company is incorporated under Dutch law and registered with the Dutch Authority for the Financial Markets (AFM).

This material is only intended for general and preliminary information and shall not be construed as investment, legal or tax advice. VanEck (Europe) GmbH and its associated and affiliated companies (together “VanEck”) assume no liability with regards to any investment, divestment or retention decision on the basis of this information. The views and opinions expressed are those of the author(s) but not necessarily those of VanEck. Opinions are current as of the publication date and are subject to change with market conditions. Information provided by third party sources is believed to be reliable and have not been independently verified for accuracy or completeness and cannot be guaranteed.

Morningstar® Wide Moat Focus IndexSM, Morningstar® US Sustainability Moat Focus Index, Morningstar® US Small-Mid Cap Moat Focus IndexSM, and Morningstar® Global Wide Moat Focus IndexSM are trademarks or service marks of Morningstar, Inc. and have been licensed for use for certain purposes by VanEck. VanEck’s ETFs are not sponsored, endorsed, sold or promoted by Morningstar, and Morningstar makes no representation regarding the advisability of investing in the ETFs. Morningstar bears no liability with respect to the ETFs or any securities.

Effective December 15, 2023, the carbon risk rating screen was removed from the Morningstar® US Sustainability Moat Focus Index. Effective December 17, 2021, the Morningstar® Wide Moat Focus IndexTM was replaced with the Morningstar® US Sustainability Moat Focus Index. Effective June 20, 2016, Morningstar implemented several changes to the Morningstar® Wide Moat Focus Index construction rules. Among other changes, the index increased its constituent count from 20 stocks to at least 40 stocks and modified its rebalance and reconstitution methodology. These changes may result in more diversified exposure, lower turnover, and longer holding periods for index constituents than under the rules in effect prior to that date.

NYSE Arca Gold Miners Index is a service mark of ICE Data Indices, LLC or its affiliates (“ICE Data”) and has been licensed for use by VanEck UCITS ETF plc (the “Fund”) in connection with the ETF. Neither the Fund nor the ETF is sponsored, endorsed, sold or promoted by ICE Data. ICE Data makes no representations or warranties regarding the Fund or the ETF or the ability of the NYSE Arca Gold Miners Index to track general stock market performance. ICE DATA MAKES NO EXPRESS OR IMPLIED WARRANTIES, AND HEREBY EXPRESSLY DISCLAIMS ALL WARRANTIES OF MERCHANTABILITY OR FITNESS FOR A PARTICULAR PURPOSE WITH RESPECT TO THE NYSE ARCA GOLD MINERS INDEX OR ANY DATA INCLUDED THEREIN. IN NO EVENT SHALL ICE DATA HAVE ANY LIABILITY FOR ANY SPECIAL, PUNITIVE, INDIRECT, OR CONSEQUENTIAL DAMAGES (INCLUDING LOST PROFITS), EVEN IF NOTIFIED OF THE POSSIBILITY OF SUCH DAMAGES. ICE Data Indices, LLC and its affiliates (“ICE Data”) indices and related information, the name “ICE Data”, and related trademarks, are intellectual property licensed from ICE Data, and may not be copied, used, or distributed without ICE Data’s prior written approval. The Fund has not been passed on as to its legality or suitability, and is not regulated, issued, endorsed’ sold, guaranteed, or promoted by ICE Data.

The S&P 500 Index (“Index”) is a product of S&P Dow Jones Indices LLC and/or its affiliates and has been licensed for use by Van Eck Associates Corporation. Copyright © 2020 S&P Dow Jones Indices LLC, a division of S&P Global, Inc., and/or its affiliates. All rights reserved. Redistribution or reproduction in whole or in part are prohibited without written permission of S&P Dow Jones Indices LLC. For more information on any of S&P Dow Jones Indices LLC’s indices please visit www.spdji.com. S&P® is a registered trademark of S&P Global and Dow Jones® is a registered trademark of Dow Jones Trademark Holdings LLC. Neither S&P Dow Jones Indices LLC, Dow Jones Trademark Holdings LLC, their affiliates nor their third party licensors make any representation or warranty, express or implied, as to the ability of any index to accurately represent the asset class or market sector that it purports to represent and neither S&P Dow Jones Indices LLC, Dow Jones Trademark Holdings LLC, their affiliates nor their third party licensors shall have any liability for any errors, omissions, or interruptions of any index or the data included therein.

It is not possible to invest directly in an index.

Investing is subject to risk, including the possible loss of principal. Investors must buy and sell units of the UCITS on the secondary market via an intermediary (e.g. a broker) and cannot usually be sold directly back to the UCITS. Brokerage fees may incur. The buying price may exceed, or the selling price may be lower than the current net asset value. The indicative net asset value (iNAV) of the UCITS is available on Bloomberg. The Management Company may terminate the marketing of the UCITS in one or more jurisdictions. The summary of the investor rights is available in English at: complaints-procedure.pdf (vaneck.com). For any unfamiliar technical terms, please refer to ETF Glossary | VanEck.

No part of this material may be reproduced in any form, or referred to in any other publication, without express written permission of VanEck.

© VanEck (Europe) GmbH ©VanEck Switzerland AG © VanEck Securities UK Limited

Fortsätt läsa

Nyheter

BBVAE ETF är en spansk ETF som spårar Eurostoxx 50

Publicerad

den

BBVA Acción Eurostoxx 50 ETF FI Cotizado Armonizado (BBVAE ETF) med ISIN ES0105321030, strävar efter att spåra EURO STOXX® 50-index. EURO STOXX® 50-indexet följer de 50 största företagen i euroområdet.

BBVA Acción Eurostoxx 50 ETF FI Cotizado Armonizado (BBVAE ETF) med ISIN ES0105321030, strävar efter att spåra EURO STOXX® 50-index. EURO STOXX® 50-indexet följer de 50 största företagen i euroområdet.

Den börshandlade fondens TER (total cost ratio) uppgår till 0,20 % p.a. ETFen replikerar resultatet av det underliggande indexet genom full replikering (köper alla indexbeståndsdelar). Utdelningarna i ETFen delas ut till investerarna (halvårsvis).

BBVA Acción Eurostoxx 50 ETF FI Cotizado Armonizado har tillgångar på 133 miljoner euro under förvaltning. Denna ETF lanserades den 3 oktober 2006 och har sin hemvist i Spanien.

Beskrivning BBVA Acción Eurostoxx 50 ETF FI Cotizado Armonizado

Med BBVA Acción Eurostoxx 50 ETF FI Cotizado Armonizado deltar investerare i ökningen av värdet på aktierna i de 50 största konglomeraten i euroområdet (euroområdet). Euro Stoxx 50-indexet inkluderar aktier från 8 länder i euroområdet: Belgien, Finland, Frankrike, Tyskland, Irland, Italien, Nederländerna och Spanien.

Handla BBVAE ETF

BBVA Acción Eurostoxx 50 ETF FI Cotizado Armonizado (BBVAE ETF) är en börshandlad fond (ETF) som handlas på Bolsa de Madrid.

Bolsa de Madrid är en marknad som få svenska banker och nätmäklare erbjuder access till, men DEGIRO gör det.

Börsnoteringar

BörsValutaKortnamn
Bolsa de MadridEURBBVAE

Största innehav

VärdepapperVikt %
ASML Holding NVNL00102732158,59%
Lvmh Moet Hennessy Louis Vuitton SEFR00001210145,60%
SAP SEDE00071646005,16%
TotalEnergies SEFR00001202714,59%
Siemens AGDE00072361013,70%
Schneider Electric SEFR00001219723,46%
Future on Euro Stoxx 503,02%
Sanofi SAFR00001205782,99%
L’Oreal SAFR00001203212,98%
Allianz SEDE00084040052,93%

Innehav kan komma att förändras

Fortsätt läsa

Nyheter

The Art of Meme-ing: How Dogecoin Redefined Value

Publicerad

den

Explore Dogecoin's impact on crypto, turning internet memes into cultural and financial assets.

Explore Dogecoin’s impact on crypto, turning internet memes into cultural and financial assets.

𝕋𝕚𝕞𝕖 ℂ𝕠𝕕𝕖𝕤:

00:00 – Intro

00:27 – Where do Memes come from?

03:13 – What are some of the first Memes you remember?

10:28 – Do these things have value?

14:04 – The different types of cryptocurrencies

17:20 – How did Dogecoin start?

24:26 – What is some of the utility?

28:36 – How does it fit into the portfolio?

30:38 – Final thoughts

Research Newsletter

Each week the 21Shares Research team will publish our data-driven insights into the crypto asset world through this newsletter. Please direct any comments, questions, and words of feedback to research@21shares.com

Disclaimer

The information provided does not constitute a prospectus or other offering material and does not contain or constitute an offer to sell or a solicitation of any offer to buy securities in any jurisdiction. Some of the information published herein may contain forward-looking statements. Readers are cautioned that any such forward-looking statements are not guarantees of future performance and involve risks and uncertainties and that actual results may differ materially from those in the forward-looking statements as a result of various factors. The information contained herein may not be considered as economic, legal, tax or other advice and users are cautioned to base investment decisions or other decisions solely on the content hereof.

Fortsätt läsa

21Shares

Prenumerera på nyheter om ETFer

* indicates required

21Shares

Populära