Följ oss

Nyheter

Globala banker: en uppdatering

Publicerad

den

Den amerikanska centralbanken har signalerat att de kommer att föra en stramare penningpolitik, vilket innebär en höjning av räntorna. Detaljhandelsinvesterare som vill förstå banksektorn bör notera detta: det här brukar översättas till goda nyheter för bankaktier. I denna artikel, Globala banker: en uppdatering, kommer Leverage Shares med en uppföljning av en tidigare text.

Den amerikanska centralbanken har signalerat att de kommer att föra en stramare penningpolitik, vilket innebär en höjning av räntorna. Detaljhandelsinvesterare som vill förstå banksektorn bör notera detta: det här brukar översättas till goda nyheter för bankaktier. I denna artikel, Globala banker: en uppdatering, kommer Leverage Shares med en uppföljning av en tidigare text.

Stigande räntor tenderar att peka på en starkare ekonomi. Det innebär att låntagarna har lättare att göra lånebetalningar, vilket i sin tur innebär att bankerna har färre misslyckade tillgångar. Banker kan också tjäna mer på fördelningen mellan vad de betalar (till innehavare av sparkonton) och vad de kan tjäna (från skuldinstrument som amerikanska statsobligationer).

Det kan dock finnas förbehåll för detta eftersom räntor inte är de enda som avgör bankernas förmögenhet. I den här uppföljningsartikeln till vår tidigare täckning om bank-ETP: er kommer vi att undersöka scenariot eftersom det står för de banker som ligger bakom några av Leverage Shares ETP:er – HSBC (ticker: HSBC), Barclays (ticker: BCS), JP Morgan ( ticker: JPM), Citi (ticker: C) och Goldman Sachs (ticker: GS).

Finansiell sektor: Smärta framåt

2021 började med en smäll när det gäller finansiella aktier. Stora stimulanspaket och tillgång till vaccin ansågs vara viktiga orsaker till denna optimism. Dessutom signalerade Federal Reserve två räntehöjningar 2023. Eftersom höjda räntor vanligtvis bidrar till att förbättra bankernas vinstmarginaler borde detta ha varit en ytterligare faktor för uppgång i denna sektor.

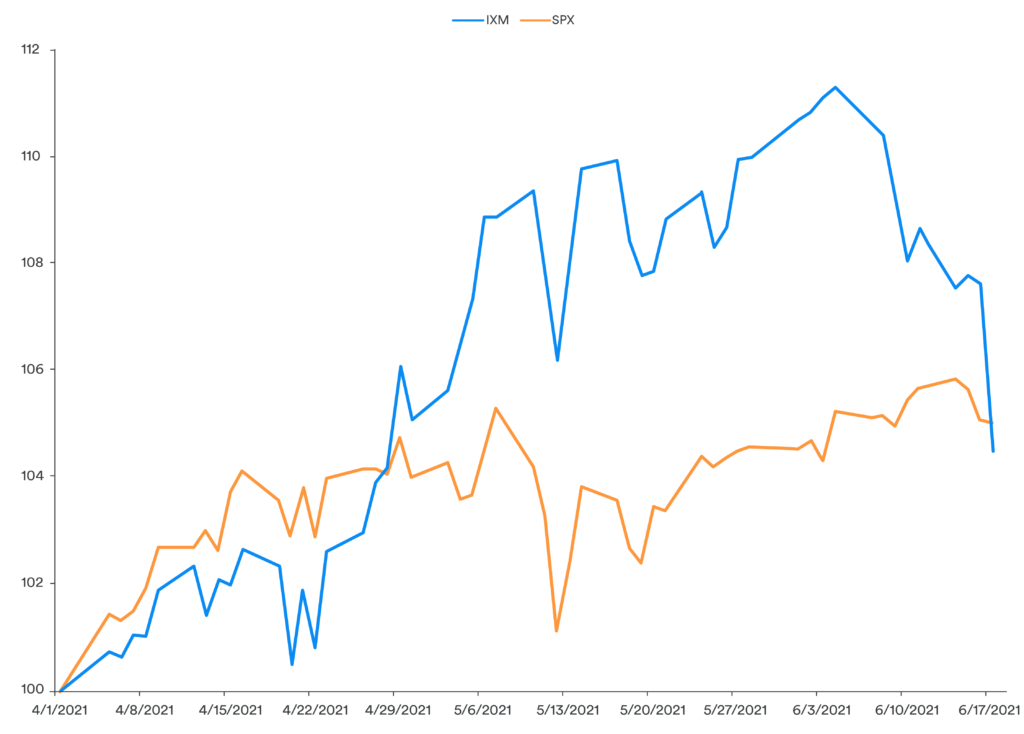
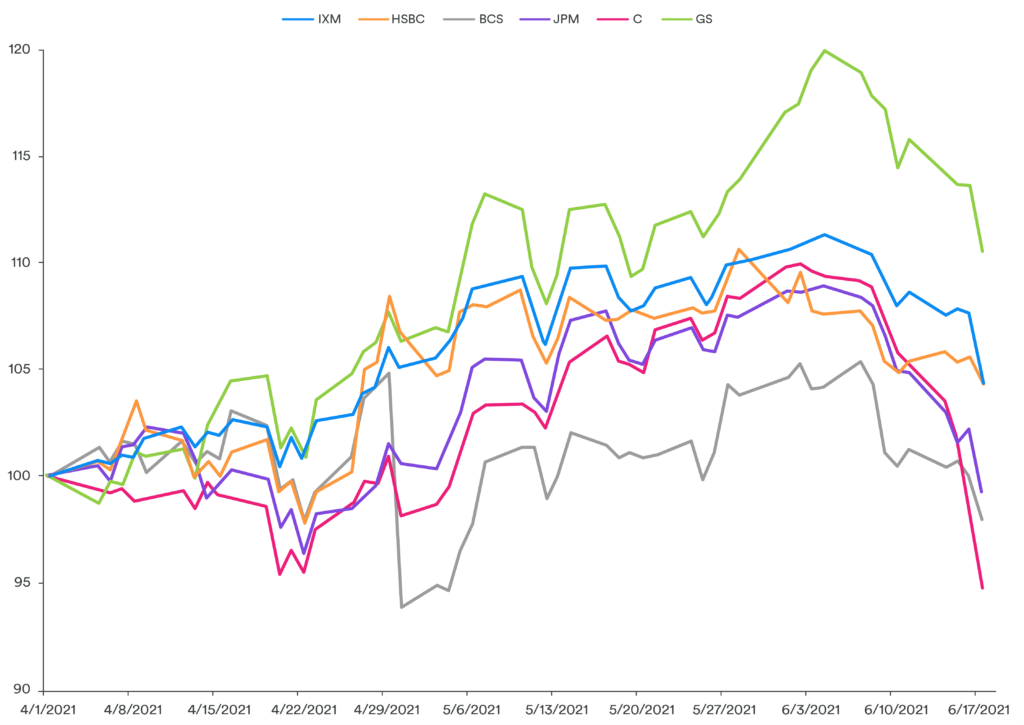
Trots allt detta hade S&P Financial Sector Index (IXM) i slutet av andra kvartalet 2021 en stor tumla direkt efter en rekordökning på 11% sedan årsskiftet. Historiskt har det funnits en stark korrelation mellan IXM och dess moderindex S&P 500 (SPX). Detta förhållande blev limmat 2021.

Anledningen till detta är det faktum att banker inte bara får intäkter från räntor. De genererar också en betydande del av sina intäkter från icke räntebärande aktiviteter: mäklartjänster, bankrelaterade serviceavgifter, kreditkortsrelaterade avgifter, inteckningsrelaterade aktiviteter etc. Dessa aktiviteter är starkt beroende av ekonomiska faktorer som marknaden inte gör anser inte vara väldigt optimistisk just nu.

Från och med den 17 juni har IXMs prestanda sjunkit under SPX.

Europeiska banker

Läsare av den tidigare artikeln kommer ihåg att HSBC var i en strategisk reträtt från Europa medan de konsoliderades i Asien. Efter 18 månaders förhandlingar har HSBC slutfört försäljningen av sin franska detaljbank till USA-baserade Cerberus Capital Management. Under tiden är bankens Asienbaserade kapitalförvaltningsverksamhet – som för närvarande är under aggressiv expansion med 5 000 nya förmögenhetsplanerare som förväntas anställas – för närvarande värt cirka 5 miljarder dollar och värderas framåt mellan 72 och 96 miljarder dollar.

Barclays finans har en särskilt intressant statistik: Barclays PLC: s nuvarande insiderägande står för 12% av alla aktier. När det kommer som ett starkt år satsar bankens huvudchefer mycket starkt på sig själva och deras ansträngningar att göra detta till ett nytt framgångsrikt år.

Många investerare använder den rapporterade vinst per aktie (EPS) som en fullmakt för att förstå framtida aktieutveckling. Genom att göra en jämförelse sida vid sida av de två europeiska bankernas förändring i EPS jämfört med föregående år de senaste tre åren ser vi följande bild:

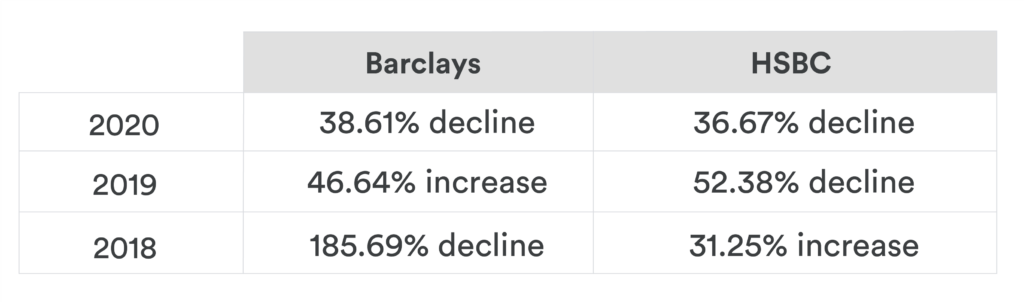
Bara genom att följa EPS-tillväxten verkar det som att HSBC har varit lite mer stabil än Barclays. Det noteras dock att stora banker har en hybrid affärsmodell: ingen enda faktor är en absolut indikator på framgång.

Amerikanska banker

J.P.Morgan har varit på utlåning det senaste året: banken är den näst största långivaren till SoftBank när det japanska teknologikonglomeratet förstärker sina investeringsplaner. Banken har också gått med på att köpa den brittiska digitalförmögenhetsförvaltaren Nutmeg i sitt försök att förnya sitt erbjudande om förmögenhetshantering i Storbritannien.

Medan Citigroup förväntas leverera cirka 17,79 miljarder dollar i det här innevarande kvartalet – väl i linje med analytikernas uppskattningar som publicerar en ”Köp” -rekommendation, varnar Citi VD Mark Mason att Q2 kommer att ha ökade kostnader samt en minskning av handelsinkomster. Den förstnämnda är relaterad till ett antal order som mottagits från tillsynsmyndigheter i slutet av förra året med avseende på dess brister i företagets hela riskhantering, compliance riskhantering, datastyrning och intern kontroll. Den senare är främst knuten till sin dålig utveckling i dess räntebärande enhet.

Analytiker anser att Goldman Sachs är ”överviktig” (vilket är en signal för investerare att köpa fler aktier i företaget) med ett genomsnittligt målpris på $ 394,18 per aktie. Det har dock skett betydande insiderförsäljning under de senaste tre månaderna och det uppskattas att bankens skuld inte täcks väl av det operativa kassaflödet.

Att göra en jämförelse av EPS-förändring sida vid sida mellan de tre amerikanska rivalerna under de senaste tre åren ger följande bild:

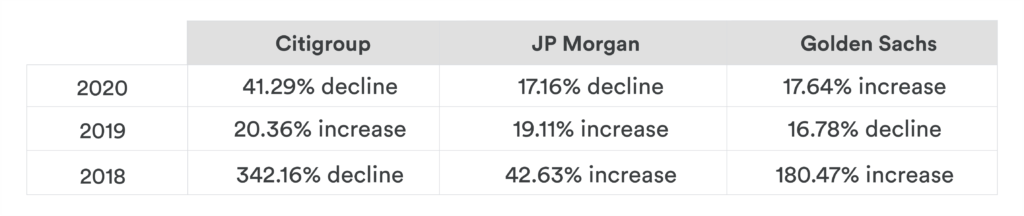
Av de tre indikerar EPS-förändringsanalysen att – trots indikatorn för insiderförsäljning – har Goldman Sachs haft den mest robusta uppgången i EPS-tillväxten och den mest dämpade nackdelen i EPS-nedgångar. Detta är en anledning (av många andra indikatorer) varför analytiker verkar rekommendera banken så ivrigt.

Sammanfattningsvis

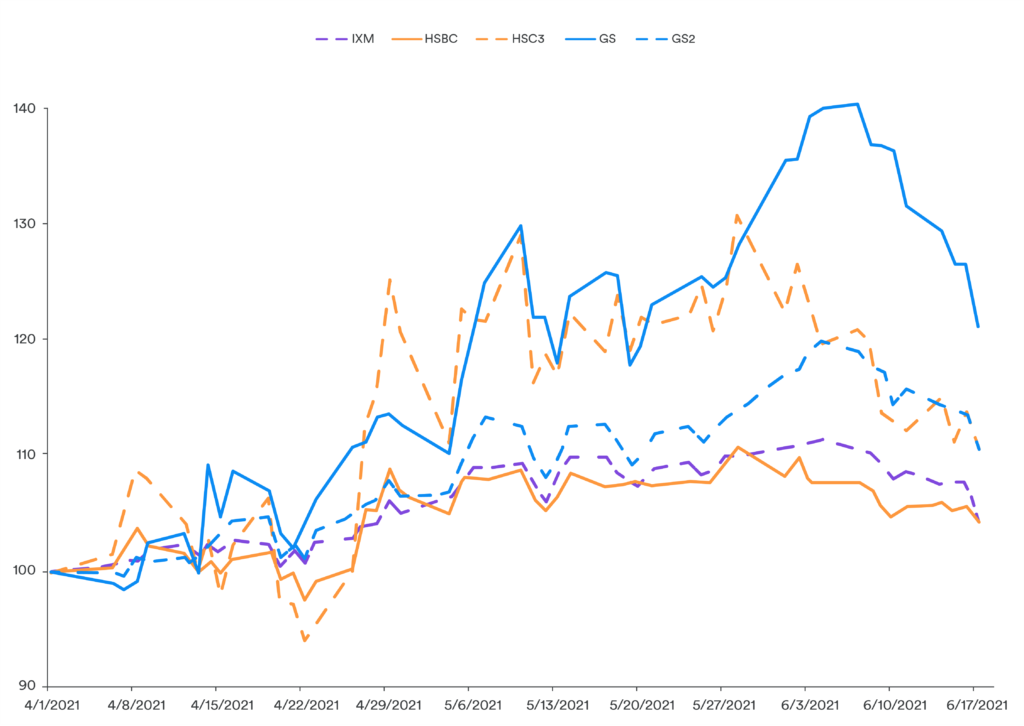
Den mest objektiva indikatorn för en banks resultat skulle vara den marknadsbestämda aktiekursutvecklingen dagligen eftersom den innehåller alla marknadsaktörers synpunkter. Läsarna kommer ihåg i vår tidigare artikel med YTD-data fram till slutet av mars, då de investerades i de dollar-denominerade ETP: erna för Goldman Sachs (GS2) och Barclays (BCS3) visade sig vara de riktmärkesslagande alternativen till att investera i aktier som också slog riktmärket.

Men med nya data sedan dess har endast Goldman Sachs visat sig överträffa, om än med hög volatilitet, medan HSBC har kommit igenom riktmärket under andra kvartalet 2021. Alla andra banker har underpresterat sedan andra kvartalet 2021 började.

En smart investerare skulle hitta värde i att formulera en strategi kring banksektorn med Leverage Shares ETP:er. Leverage Shares erbjuder 3X ETP på Barclays (3BAC) och HSBC (3HSB), 2X ETP på J.P.Morgan (2JPM), Citi (2CIT) och Goldman Sachs (2GS). Leverage Shares erbjuder även Shorts (-1X) på Barclays (BCSS), HSBC (HSBS), J.P.Morgan (JPMS), Citi (SCIT) och Goldman Sachs (GSSS).

Att till exempel investera i dollar-denominerade ETP: er för Goldman Sachs (GS2) och HSBC (HSC3) under andra kvartalet 2021 skulle ge investeraren solida jämförelsevis respektive benchmark-paravkastning:

Det noteras dock att de något dystra prognoserna som görs om banksektorn – vilket understryks av IXM:s baisseprestanda – innebär att det att gå kort om bankerna använder Leverage Shares inversa ETP i händelse av IXM:s fortsatta nedgång sannolikt skulle vara mycket praktisk strategi för den smarta investeraren.

Oavsett vilket hävstångsspel en investerare vill bygga med dessa bankaktier har Leverage Shares dem täckta.

Med den senaste noteringen erbjuder Leverage Shares nu över 100 single stock ETPs, vilka erbjuder både hävstångseffekt och outnyttjad exponering mot dagens mest efterfrågade aktier.

Handla Leverage Shares produkter

Leverage Shares produkter kan handlas genom till exempel IG, men även på Londonbörsen för den som har ett konto hos en mäklare som erbjuder handel på denna marknad, till exempel DEGIRO. Vidare handlas Leverage Shares Single Stock ETPs på Euronext Amsterdam och Euronext Paris.

Fortsätt läsa
Annons
Klicka för att kommentera

Skriv en kommentar

Din e-postadress kommer inte publiceras. Obligatoriska fält är märkta *

Nyheter

April in ETFs: Gold at New Highs, Crypto in Transition, and Moat Index Holding Steady

Publicerad

den

As April winds down, markets remain on edge, with escalating tariffs and renewed trade tensions keeping volatility in focus. In this summary of our full-length newsletter, we spotlight gold and gold equities, both of which have surged to record levels. We also take a step back from the day-to-day noise in crypto to explore the broader shifts in the regulatory landscape in our latest Whitepaper and present Celestia in detail. Finally, we assess how Moat indexes have held up and evolved amid the turbulence.

As April winds down, markets remain on edge, with escalating tariffs and renewed trade tensions keeping volatility in focus. In this summary of our full-length newsletter, we spotlight gold and gold equities, both of which have surged to record levels. We also take a step back from the day-to-day noise in crypto to explore the broader shifts in the regulatory landscape in our latest Whitepaper and present Celestia in detail. Finally, we assess how Moat indexes have held up and evolved amid the turbulence.

Your VanEck Europe team wishes you a great read.


Featured Articles

🥇 Are Gold Mining Equities Regaining Attention Amid Rising Gold Prices?

Gold & Gold mining equities tend to shine during stress periods

Source: VanEck, World Gold Council.

Gold has attracted renewed interest from investors amid concerns about inflation, currency volatility, and overall market uncertainty. Gold mining companies have recently reported improved profit margins and cash generation, with some initiating share buybacks and maintaining relatively strong balance sheets. Despite these developments, many continue to trade below their historical valuation averages.

While historical trends indicate that gold and gold mining equities have outperformed during certain periods of market stress, these patterns may not repeat under different economic conditions. Performance can be influenced by a range of factors including interest rates, central bank policy, geopolitical developments, and investor sentiment.

→ Read more

⚖️ Whitepaper Highlights: How New Crypto Regulations May Shape the Future

Cryptocurrencies are entering a new era. With the re-election of Donald Trump and the implementation of the European Union’s Markets in Crypto-Assets (MiCA) regulation, digital assets are moving into a landscape defined not just by innovation, but also by regulatory clarity.

MiCA’s structured and transparent approach aims to promote legitimacy, safeguard investors, and enhance trust in digital asset markets across Europe. It could also serve as a blueprint for other jurisdictions looking to regulate crypto effectively.

→ Read the Whitepaper Highlights

⛓️ Introduction to Celestia

Most blockchains, like Ethereum or Bitcoin, are monolithic which means they perform all major functions (consensus, data availability, and execution) on a single layer. This design ensures security but according to new modular networks, limits scalability and flexibility.

The modular blockchain thesis, which Celestia is leading, proposes separation of layers and respective responsibilities in the network.

→ Read more

Note: This article in not accessible to our UK readers.

🌊 Riding the Gold Wave

Chasing the Vein: Fund Flows into Gold Miners

Source: Mining.com. Data as of 21 March 2025. Note: Data covers 493 funds with combined assets under management of $62 billion.

U.S. equity markets experienced significant declines during the month of March. Meanwhile, spot gold price recorded new all-time highs, surpassing the $3,000 per ounce mark on 14 March and closing at a record price of $3123.57 on March 31, a 9.30% ($265.73) monthly gain. As of 31 March, gold prices have risen by 93.61% over the past five years (1). Investors should keep in mind that past performance is not representative of future results.

The gold miners, as represented by the NYSE Arca Gold Miners Index (GDMNTR), outperformed significantly, up 15.51% during March (2). This gain reflects both their operational leverage to rising gold prices and market perceptions of relative value. However, gold miners can also be subject to heightened volatility, operational risks, and sensitivity to commodity price swings.

While gold and gold equities may serve as diversifiers in a portfolio due to their historically low correlations with many asset classes, investors should remain mindful of the inherent risks, including price volatility, currency movements, and shifts in investor sentiment that can lead to rapid reversals in performance.

→ Read more

🌪️ Moat Stocks Weather Tariff Tumble

Market turbulence in March weighed on stocks. The Moat Index was not immune to the market turmoil, as it declined along with the broad U.S. equity market ending the month lower. However, the Moat Index showed resilience relative to the S&P 500—thanks in part to defensive sector resilience and underweight exposure to mega-caps.

At the same time, the SMID Moat Index lagged small and mid-caps in March. Smaller U.S. stocks were also impacted by global trade tensions and economic growth concerns with the broad small- and mid-cap benchmarks falling during the month. However, year-to-date, the SMID Moat Index remains ahead of the broader small- and mid-cap markets.

→ Read more


This is a preview of our monthly ETF insights email newsletter.

To receive the full version, sign up here.


(1) Source: World Gold Council, ICE Data Services, FactSet Research Systems Inc.

(2) Source: Financial Times.

IMPORTANT INFORMATION

This is marketing communication. Please refer to the prospectus of the UCITS and to the KID/KIID before making any final investment decisions. These documents are available in English and the KIDs/KIIDs in local languages and can be obtained free of charge at www.vaneck.com, from VanEck Asset Management B.V. (the “Management Company”) or, where applicable, from the relevant appointed facility agent for your country.

For investors in Switzerland: VanEck Switzerland AG, with registered office in Genferstrasse 21, 8002 Zurich, Switzerland, has been appointed as distributor of VanEck´s products in Switzerland by the Management Company. A copy of the latest prospectus, the Articles, the Key Information Document, the annual report and semi-annual report can be found on our website www.vaneck.com or can be obtained free of charge from the representative in Switzerland: Zeidler Regulatory Services (Switzerland) AG, Neudtadtgasse 1a, 8400 Winterthur, Switzerland. Swiss paying agent: Helvetische Bank AG, Seefeldstrasse 215, CH-8008 Zürich.

For investors in the UK: This is a marketing communication targeted to FCA regulated financial intermediaries. Retail clients should not rely on any of the information provided and should seek assistance from a financial intermediary for all investment guidance and advice. VanEck Securities UK Limited (FRN: 1002854) is an Appointed Representative of Sturgeon Ventures LLP (FRN: 452811), which is authorised and regulated by the Financial Conduct Authority (FCA) in the UK, to distribute VanEck´s products to FCA regulated firms such as financial intermediaries and Wealth Managers.

This information originates from VanEck (Europe) GmbH, which is authorized as an EEA investment firm under MiFID under the Markets in Financial Instruments Directive (“MiFiD). VanEck (Europe) GmbH has its registered address at Kreuznacher Str. 30, 60486 Frankfurt, Germany, and has been appointed as distributor of VanEck products in Europe by the Management Company. The Management Company is incorporated under Dutch law and registered with the Dutch Authority for the Financial Markets (AFM).

This material is only intended for general and preliminary information and shall not be construed as investment, legal or tax advice. VanEck (Europe) GmbH and its associated and affiliated companies (together “VanEck”) assume no liability with regards to any investment, divestment or retention decision on the basis of this information. The views and opinions expressed are those of the author(s) but not necessarily those of VanEck. Opinions are current as of the publication date and are subject to change with market conditions. Information provided by third party sources is believed to be reliable and have not been independently verified for accuracy or completeness and cannot be guaranteed.

Morningstar® Wide Moat Focus IndexSM, Morningstar® US Sustainability Moat Focus Index, Morningstar® US Small-Mid Cap Moat Focus IndexSM, and Morningstar® Global Wide Moat Focus IndexSM are trademarks or service marks of Morningstar, Inc. and have been licensed for use for certain purposes by VanEck. VanEck’s ETFs are not sponsored, endorsed, sold or promoted by Morningstar, and Morningstar makes no representation regarding the advisability of investing in the ETFs. Morningstar bears no liability with respect to the ETFs or any securities.

Effective December 15, 2023, the carbon risk rating screen was removed from the Morningstar® US Sustainability Moat Focus Index. Effective December 17, 2021, the Morningstar® Wide Moat Focus IndexTM was replaced with the Morningstar® US Sustainability Moat Focus Index. Effective June 20, 2016, Morningstar implemented several changes to the Morningstar® Wide Moat Focus Index construction rules. Among other changes, the index increased its constituent count from 20 stocks to at least 40 stocks and modified its rebalance and reconstitution methodology. These changes may result in more diversified exposure, lower turnover, and longer holding periods for index constituents than under the rules in effect prior to that date.

NYSE Arca Gold Miners Index is a service mark of ICE Data Indices, LLC or its affiliates (“ICE Data”) and has been licensed for use by VanEck UCITS ETF plc (the “Fund”) in connection with the ETF. Neither the Fund nor the ETF is sponsored, endorsed, sold or promoted by ICE Data. ICE Data makes no representations or warranties regarding the Fund or the ETF or the ability of the NYSE Arca Gold Miners Index to track general stock market performance. ICE DATA MAKES NO EXPRESS OR IMPLIED WARRANTIES, AND HEREBY EXPRESSLY DISCLAIMS ALL WARRANTIES OF MERCHANTABILITY OR FITNESS FOR A PARTICULAR PURPOSE WITH RESPECT TO THE NYSE ARCA GOLD MINERS INDEX OR ANY DATA INCLUDED THEREIN. IN NO EVENT SHALL ICE DATA HAVE ANY LIABILITY FOR ANY SPECIAL, PUNITIVE, INDIRECT, OR CONSEQUENTIAL DAMAGES (INCLUDING LOST PROFITS), EVEN IF NOTIFIED OF THE POSSIBILITY OF SUCH DAMAGES. ICE Data Indices, LLC and its affiliates (“ICE Data”) indices and related information, the name “ICE Data”, and related trademarks, are intellectual property licensed from ICE Data, and may not be copied, used, or distributed without ICE Data’s prior written approval. The Fund has not been passed on as to its legality or suitability, and is not regulated, issued, endorsed’ sold, guaranteed, or promoted by ICE Data.

The S&P 500 Index (“Index”) is a product of S&P Dow Jones Indices LLC and/or its affiliates and has been licensed for use by Van Eck Associates Corporation. Copyright © 2020 S&P Dow Jones Indices LLC, a division of S&P Global, Inc., and/or its affiliates. All rights reserved. Redistribution or reproduction in whole or in part are prohibited without written permission of S&P Dow Jones Indices LLC. For more information on any of S&P Dow Jones Indices LLC’s indices please visit www.spdji.com. S&P® is a registered trademark of S&P Global and Dow Jones® is a registered trademark of Dow Jones Trademark Holdings LLC. Neither S&P Dow Jones Indices LLC, Dow Jones Trademark Holdings LLC, their affiliates nor their third party licensors make any representation or warranty, express or implied, as to the ability of any index to accurately represent the asset class or market sector that it purports to represent and neither S&P Dow Jones Indices LLC, Dow Jones Trademark Holdings LLC, their affiliates nor their third party licensors shall have any liability for any errors, omissions, or interruptions of any index or the data included therein.

It is not possible to invest directly in an index.

Investing is subject to risk, including the possible loss of principal. Investors must buy and sell units of the UCITS on the secondary market via an intermediary (e.g. a broker) and cannot usually be sold directly back to the UCITS. Brokerage fees may incur. The buying price may exceed, or the selling price may be lower than the current net asset value. The indicative net asset value (iNAV) of the UCITS is available on Bloomberg. The Management Company may terminate the marketing of the UCITS in one or more jurisdictions. The summary of the investor rights is available in English at: complaints-procedure.pdf (vaneck.com). For any unfamiliar technical terms, please refer to ETF Glossary | VanEck.

No part of this material may be reproduced in any form, or referred to in any other publication, without express written permission of VanEck.

© VanEck (Europe) GmbH ©VanEck Switzerland AG © VanEck Securities UK Limited

Fortsätt läsa

Nyheter

BBVAE ETF är en spansk ETF som spårar Eurostoxx 50

Publicerad

den

BBVA Acción Eurostoxx 50 ETF FI Cotizado Armonizado (BBVAE ETF) med ISIN ES0105321030, strävar efter att spåra EURO STOXX® 50-index. EURO STOXX® 50-indexet följer de 50 största företagen i euroområdet.

BBVA Acción Eurostoxx 50 ETF FI Cotizado Armonizado (BBVAE ETF) med ISIN ES0105321030, strävar efter att spåra EURO STOXX® 50-index. EURO STOXX® 50-indexet följer de 50 största företagen i euroområdet.

Den börshandlade fondens TER (total cost ratio) uppgår till 0,20 % p.a. ETFen replikerar resultatet av det underliggande indexet genom full replikering (köper alla indexbeståndsdelar). Utdelningarna i ETFen delas ut till investerarna (halvårsvis).

BBVA Acción Eurostoxx 50 ETF FI Cotizado Armonizado har tillgångar på 133 miljoner euro under förvaltning. Denna ETF lanserades den 3 oktober 2006 och har sin hemvist i Spanien.

Beskrivning BBVA Acción Eurostoxx 50 ETF FI Cotizado Armonizado

Med BBVA Acción Eurostoxx 50 ETF FI Cotizado Armonizado deltar investerare i ökningen av värdet på aktierna i de 50 största konglomeraten i euroområdet (euroområdet). Euro Stoxx 50-indexet inkluderar aktier från 8 länder i euroområdet: Belgien, Finland, Frankrike, Tyskland, Irland, Italien, Nederländerna och Spanien.

Handla BBVAE ETF

BBVA Acción Eurostoxx 50 ETF FI Cotizado Armonizado (BBVAE ETF) är en börshandlad fond (ETF) som handlas på Bolsa de Madrid.

Bolsa de Madrid är en marknad som få svenska banker och nätmäklare erbjuder access till, men DEGIRO gör det.

Börsnoteringar

BörsValutaKortnamn
Bolsa de MadridEURBBVAE

Största innehav

VärdepapperVikt %
ASML Holding NVNL00102732158,59%
Lvmh Moet Hennessy Louis Vuitton SEFR00001210145,60%
SAP SEDE00071646005,16%
TotalEnergies SEFR00001202714,59%
Siemens AGDE00072361013,70%
Schneider Electric SEFR00001219723,46%
Future on Euro Stoxx 503,02%
Sanofi SAFR00001205782,99%
L’Oreal SAFR00001203212,98%
Allianz SEDE00084040052,93%

Innehav kan komma att förändras

Fortsätt läsa

Nyheter

The Art of Meme-ing: How Dogecoin Redefined Value

Publicerad

den

Explore Dogecoin's impact on crypto, turning internet memes into cultural and financial assets.

Explore Dogecoin’s impact on crypto, turning internet memes into cultural and financial assets.

𝕋𝕚𝕞𝕖 ℂ𝕠𝕕𝕖𝕤:

00:00 – Intro

00:27 – Where do Memes come from?

03:13 – What are some of the first Memes you remember?

10:28 – Do these things have value?

14:04 – The different types of cryptocurrencies

17:20 – How did Dogecoin start?

24:26 – What is some of the utility?

28:36 – How does it fit into the portfolio?

30:38 – Final thoughts

Research Newsletter

Each week the 21Shares Research team will publish our data-driven insights into the crypto asset world through this newsletter. Please direct any comments, questions, and words of feedback to research@21shares.com

Disclaimer

The information provided does not constitute a prospectus or other offering material and does not contain or constitute an offer to sell or a solicitation of any offer to buy securities in any jurisdiction. Some of the information published herein may contain forward-looking statements. Readers are cautioned that any such forward-looking statements are not guarantees of future performance and involve risks and uncertainties and that actual results may differ materially from those in the forward-looking statements as a result of various factors. The information contained herein may not be considered as economic, legal, tax or other advice and users are cautioned to base investment decisions or other decisions solely on the content hereof.

Fortsätt läsa

21Shares

Prenumerera på nyheter om ETFer

* indicates required

21Shares

Populära