
Nyheter
Crypto’s Back in the Green; Are We Out of the Woods?
Growing institutional adoption, on the back of new Bitcoin ETF applications in the U.S., has reignited the crypto flame, pushing Bitcoin to its highest level since 2022: $31.2K. Over the past quarter, Bitcoin and Ethereum increased by around 8% and 5%, respectively. Scalability solutions suffered the most. Falling by 7%, Arbitrum came out with the least losses in Q2 in comparison with its peers, as shown in Figure 1. In the realm of DeFi, Lido was the frontrunner, soaring by 35% in TVL. This jump could be attributed to Lido’s success in executing its staked ETH withdrawals.
Figure 1: 90-Day Price and TVL Developments of Cryptoassets in Major Sectors
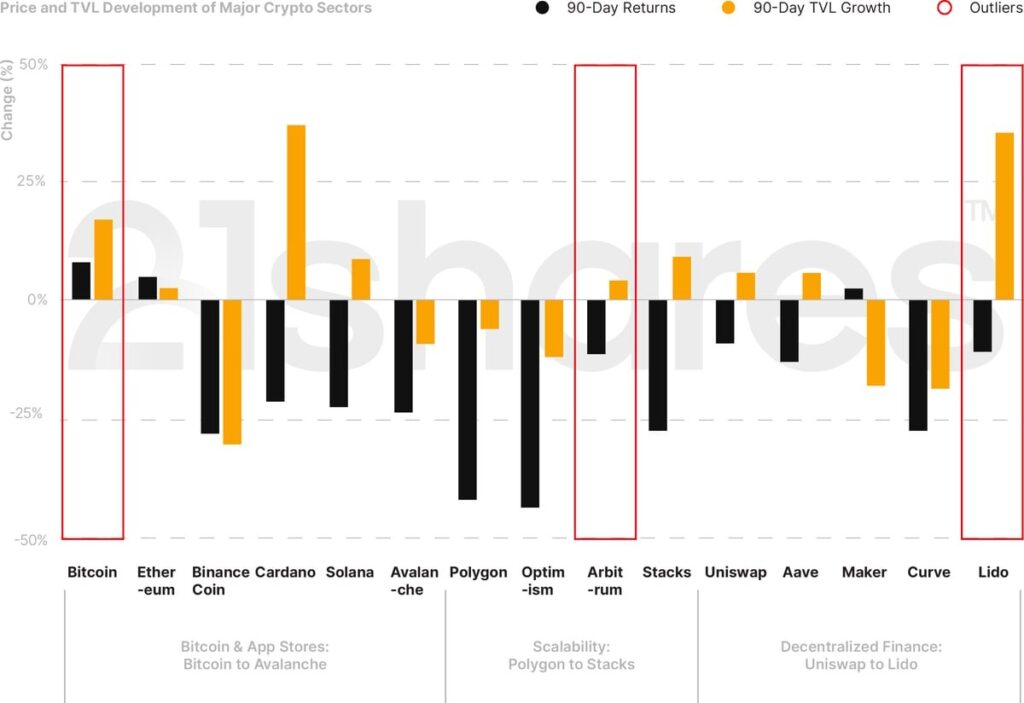
Source: 21Shares, CoinGecko, DeFi Llama. Close data as of June 26, 2023.
5 Trends to Remember from Q2
• After a long wait, investors can finally withdraw their staked Ether: Since the Ethereum staking contract launched in December 2020, investors who wanted to validate transactions and secure the network had to withstand an indefinite lockup period on their Ether (ETH). On April 12, the Shanghai upgrade was activated, closing the loop on staking liquidity by allowing investors to finally withdraw their locked ETH. Despite ~73k validators exiting the network as of June 26, Ethereum staking has seen almost 4 million ETH in net new deposits since April 12. This shows that enabling withdrawals has reduced the liquidity risk for investors, particularly institutions.
Figure 2: Breakdown of ETH deposits and Withdrawals
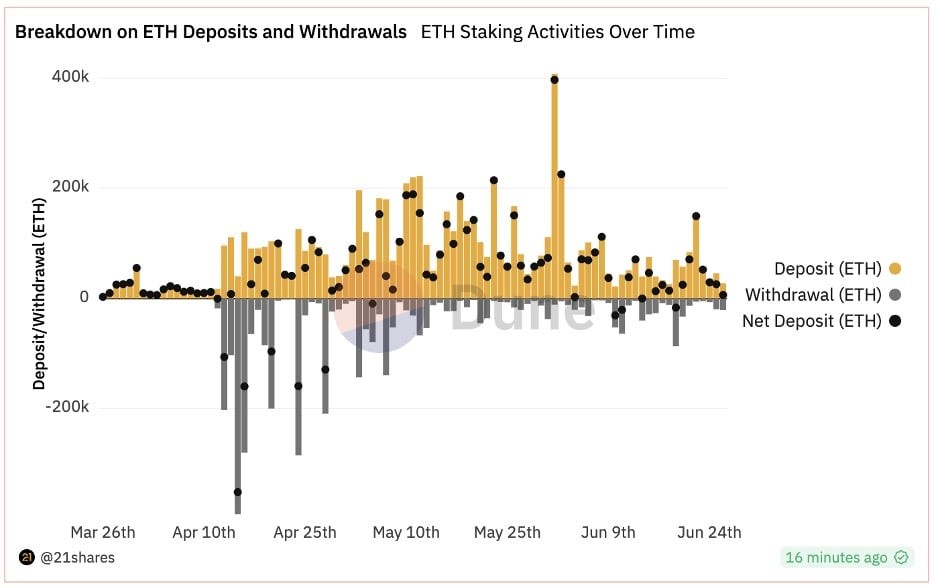
Source: 21shares on Dune Analytics
• Binance faces hurdles in the U.S. and Europe: The world’s largest crypto exchange and its founder are facing 13 charges which include operating an unregistered exchange, commingling of assets, and misrepresenting trading controls and oversight on the Binance.US platform. While the lawsuit filed by the Securities and Exchanges Commission (SEC) is still pending a verdict, Binance’s balance fell by almost 8% this quarter. Selling pressure could have also been partly influenced by some less tense trouble Binance has been facing in Europe. The exchange exited the Netherlands after failing to get regulatory approval as a virtual asset provider. France is also preliminarily investigating Binance for alleged money laundering, to which Binance’s CEO appeared relaxed, saying that they have collaborated with the French authorities and that this legal procedure is the norm in France. With the Markets in Crypto Assets (MiCA) regulatory framework going into effect by the beginning of next year, Binance has voluntarily exited other European countries, like Austria and Cyprus, to reportedly focus on complying with MiCA.
Figure 3: Asset Flow on Binance
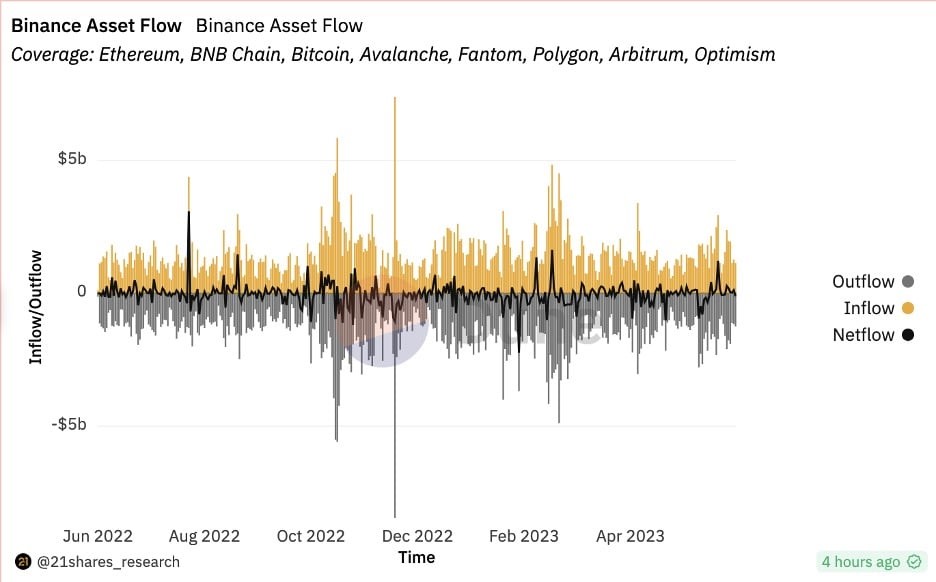
Source: 21shares on Dune Analytics
• A busy quarter for Tether: On May 17, Tether announced it would use 15% of its monthly net operating profits to buy BTC to diversify its reserve surplus. Three weeks later, Tether’s USDT circulating supply reached a new all-time high of $83.3 billion, while Circle’s USDC and Binance’s BUSD remained down ~50% and ~80% from their peak in June and November 2022, respectively. Finally, short-sellers drove USDT’s liquidity in Curve’s 3Pool to $285 million, making up over 70% of the pool at its peak and causing the stablecoin to trade 0.3% off its peg on June 15. However, USDT quickly re-pegged, and it took only seven days to get back below the pool’s 33% benchmark, suggesting that the actions were unfounded and that USDT remains the market’s preferred stablecoin.
Figure 4: USDT Liquidity in 3Pool on Curve
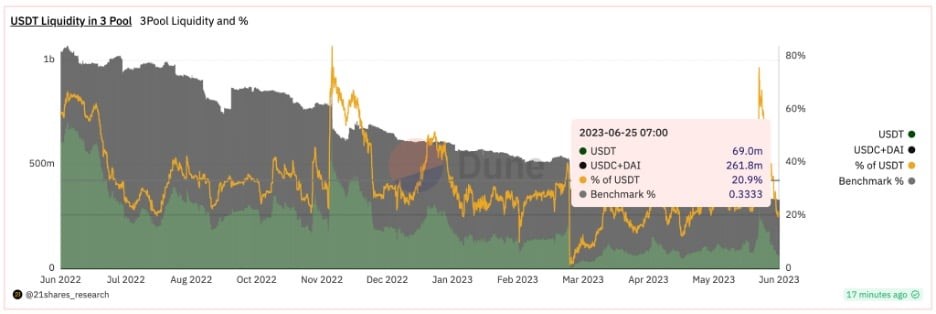
Source: 21Shares on Dune Analytics.
• MakerDAO strengthens its reserves, boosts its revenue: Near the end of Q2, the third largest money market application in DeFi purchased an additional $700M in Treasury bonds as part of its ongoing effort to strengthen the reserves backing its DAI stablecoin. Maker also implemented a six-month U.S. Treasury ladder strategy involving bi-weekly roll-overs to boost its revenue. This ties in with our thesis that utilizing Real World Assets (RWA) to generate revenue is a significant structural development to help create real inherent value. With the expansion of its RWA holdings, Maker could be more profitable in the quarters to come.
• Deutsche Bank applies to be a crypto custodian: On June 20, Germany’s largest bank applied for a digital asset license to operate as a custody service for cryptoassets to increase its fee income. DB’s interest in crypto custody speaks volumes of the market opportunity it wants to tap into. Not only is it a stamp of recognition of our trillion-dollar industry, but more so an indicator of the market sentiment that hadn’t died out since 2022, when the bank first hinted at its interest in crypto custody. This will make accessing and safeguarding crypto a lot easier for retail investors who are not tech savvy, not well acquainted with hardware wallets, or simply do not trust the crypto-native solutions offered at the time.
What You Should Pay Attention To
Growing institutional adoption will continue to drive the market sentiment: All eyes are on Grayscale’s lawsuit against the SEC’s rejection of its Bitcoin Trust filing. The company expects to hear a final decision from the DC District Court of Appeals in Q3 or later. On the other side of the world, HSBC Hong Kong, the largest bank in the special administrative region of China, is now allowing customers to trade Bitcoin and Ethereum ETFs listed on Hong Kong’s stock exchange. We are witnessing an unprecedented growing interest in this asset class, especially on the institutional level, which has always been considered a strong catalyst for any emerging technology looking to reach mass adoption.
The IMF finally admits the world can’t effectively ban crypto, doubles down on CBDCs: This quarter was a playground for change of hearts, namely the International Monetary Fund’s view on crypto. In its recent report on the use cases of central bank digital currencies (CBDCs) in Latin America and the Caribbeans, the IMF noted that an outright ban on cryptoassets would be ineffective in the long run. While the report is mainly advocating the advantages CBDCs have over cryptoassets, the silver lining is that cryptoassets are no longer looked at as an entirely fraudulent monetary system. In the coming quarters, we can witness leaps toward regulatory clarity across various regions.
The Feds want oversight on stablecoin regulations to be discussed in late July: The House Financial Services Committee is preparing two bills aiming to give more legal clarity around cryptoassets, including stablecoins and crypto exchanges. The chair of the Federal Reserve, Jerome Powell, said that stablecoins as a form of payment need to be supervised by central banks. Chairman Patrick McHenry disagreed, saying Congress may need to examine separating supervision and regulation out of the Fed and gaining greater oversight and control. Powell also mentioned that a U.S. CBDC is a far-fetched mission, which leaves the focus on stablecoins, which has seen a noticeable rise in adoption, as shown in the figure below.
Figure 5: USDT Inflows to Exchanges
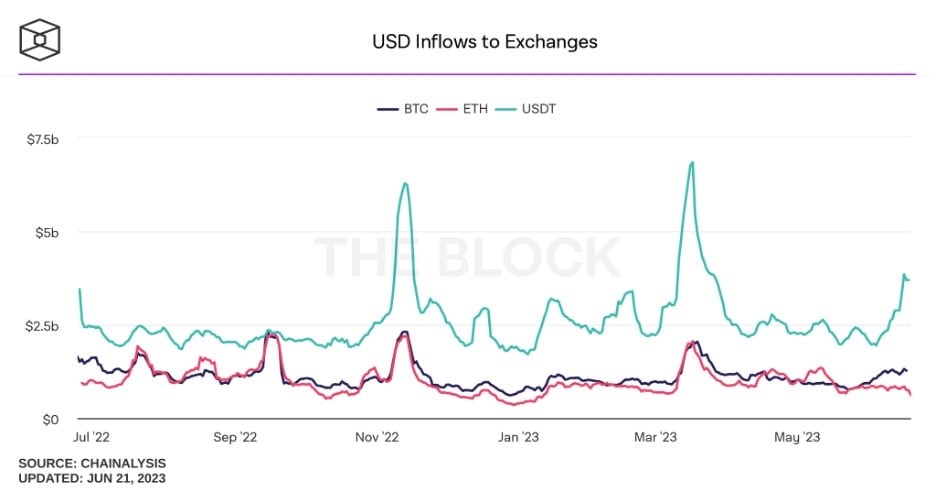
Source: Chainalysis, The Block
Liquidity is moving on-chain: The proportion of trading volume on decentralized vs. centralized exchanges reached an all-time high of 21.65% in May after steadily trending higher since the collapse of FTX in November 2022. Now, given the current regulatory climate in the U.S., with Binance and Coinbase facing pressure from the SEC, and the upcoming release of Uniswap v4, the perfect storm is forming for DEXs to continue gaining momentum over the following quarters. Uniswap v4 will introduce limit orders, time-weighted average prices (TWAPs), native support for ETH, and architectural changes like “hooks,” which would allow for potential new use cases, like MEV-capturing AMMs.
Figure 6: : DEX to CEX Spot Trade Volume
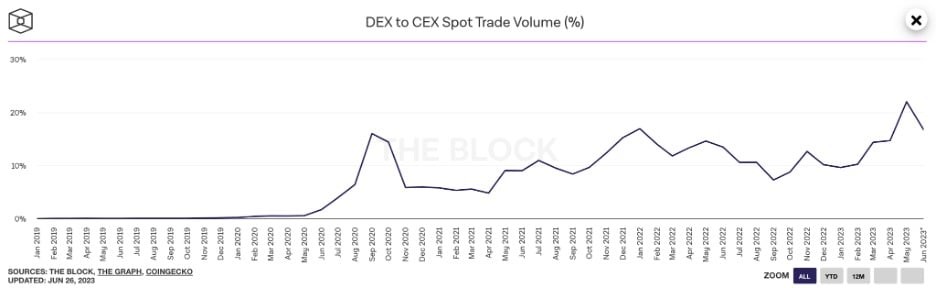
Source: Bitcoin Key Metrics, 21shares on Dune Analytics.
Next Month’s Calendar
Top 3 events we’re closely monitoring in July:
• July 5: FOMC Meeting Minutes
• July 11 onwards: Crypto bill mark-up, led by Rep. Patrick McHenry
• July 26: Federal Fund Rate
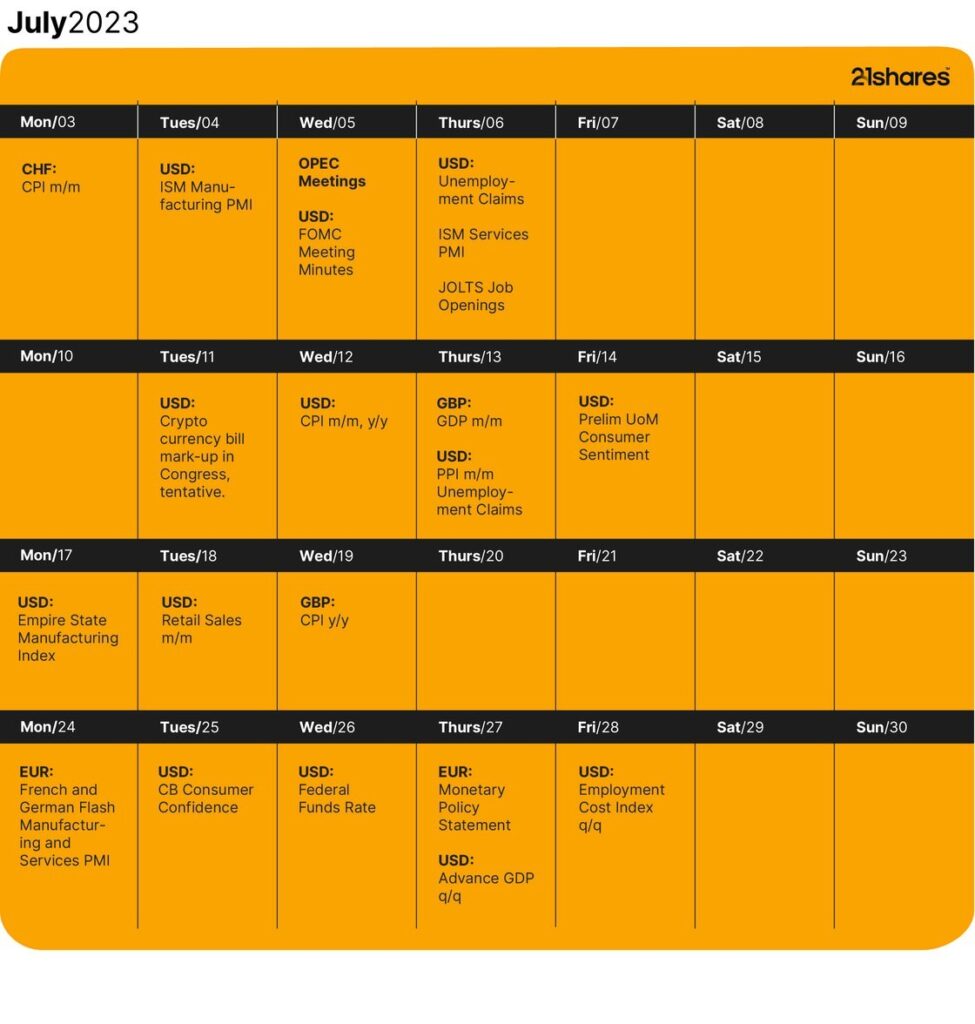
Source: Forex Factory, CoinMarketCal
Research Newsletter
Each week the 21Shares Research team will publish our data-driven insights into the crypto asset world through this newsletter. Please direct any comments, questions, and words of feedback to research@21shares.com
Disclaimer
The information provided does not constitute a prospectus or other offering material and does not contain or constitute an offer to sell or a solicitation of any offer to buy securities in any jurisdiction. Some of the information published herein may contain forward-looking statements. Readers are cautioned that any such forward-looking statements are not guarantees of future performance and involve risks and uncertainties and that actual results may differ materially from those in the forward-looking statements as a result of various factors. The information contained herein may not be considered as economic, legal, tax or other advice and users are cautioned to base investment decisions or other decisions solely on the content hereof.


India’s vibrant economy and structural growth opportunities continue to be the envy of many emerging markets. But somewhat unique to this market are tax implications that investors should be aware of. Our Franklin Templeton Global ETF team examines these structural issues in Asia’s third-largest economy.
In merely a decade, India has taken a quantum leap from the world’s 11th largest economy to become its fifth largest. By many accounts, it is expected to remain one of the world’s fastest-growing major economies over the coming years. And even after a banner 2023 during which the country’s benchmark indexes surged and Indian Prime Minister Narendra Modi celebrated high-profile successes—from historic technological and space exploration achievements to rising global diplomatic clout—this election year has already marked more progress in supporting Modi’s pro-growth, pro-jobs efforts.
The world’s most populous nation has advanced ties with Western countries over free trade. In addition to agreements with Australia and the United Arab Emirates, it has worked to better integrate the “Global South’s” development needs and ambitions with that of the G20. Modi has touted innovative partnerships for a new multilateral rail and sea corridor to connect India with the Middle East and the European Union (EU)—seen as a counterweight to China’s vast Belt-and-Road infrastructure corridor.
India reached its latest notable trade pact, nearly 16 years in the making, in March with the European Free Trade Association—Iceland, Liechtenstein, Norway and Switzerland. The agreement lifts Indian tariffs to secure US$100 billion in foreign direct investment commitments from the non-EU markets to India across multiple sectors.
With India still an enviable investment powerhouse, it seems important to clarify a few aspects of this dynamic equity market.
How exchange-traded funds (ETFs) treat India capital gains tax (CGT)
Foreign investors should be aware that CGT is an integral part of investing in Indian equities that cannot be circumvented. Investors in India funds are subject to CGT implications regardless of fund provider, and CGT is based and calculated on a fund as a whole, not an individual investor’s position.
The details: Foreign investors owning local Indian stocks are subject to taxation on capital gains at a short-term rate of 15% for positions held for less than one year and at a long-term rate of 10% for positions held over one year.
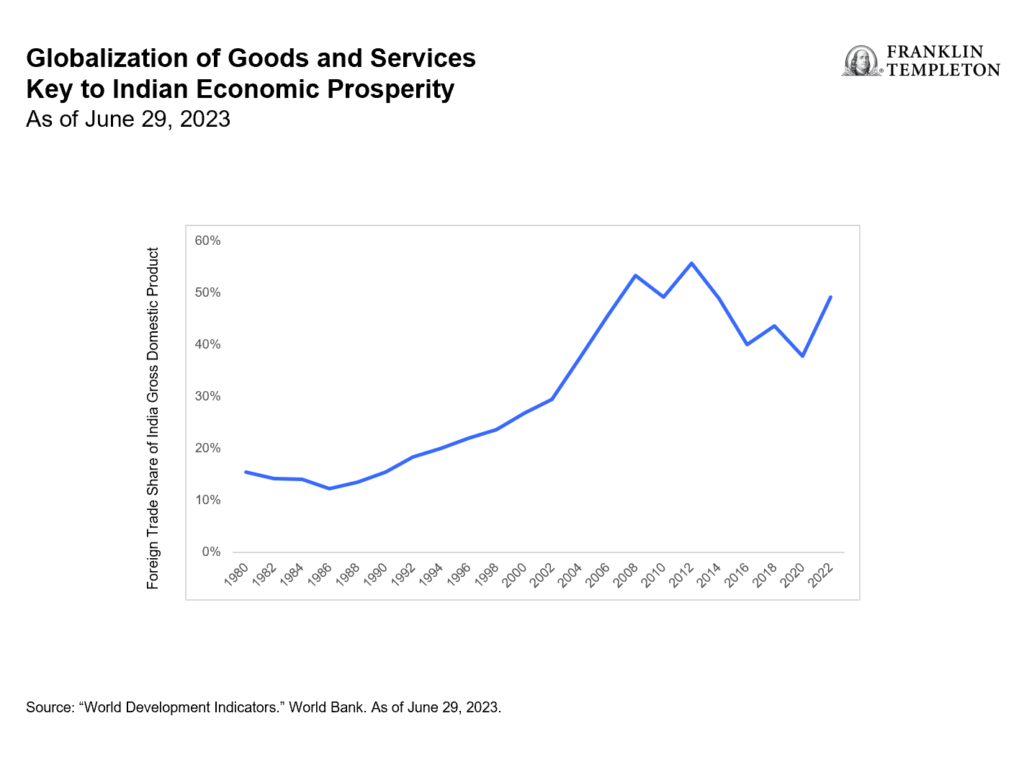
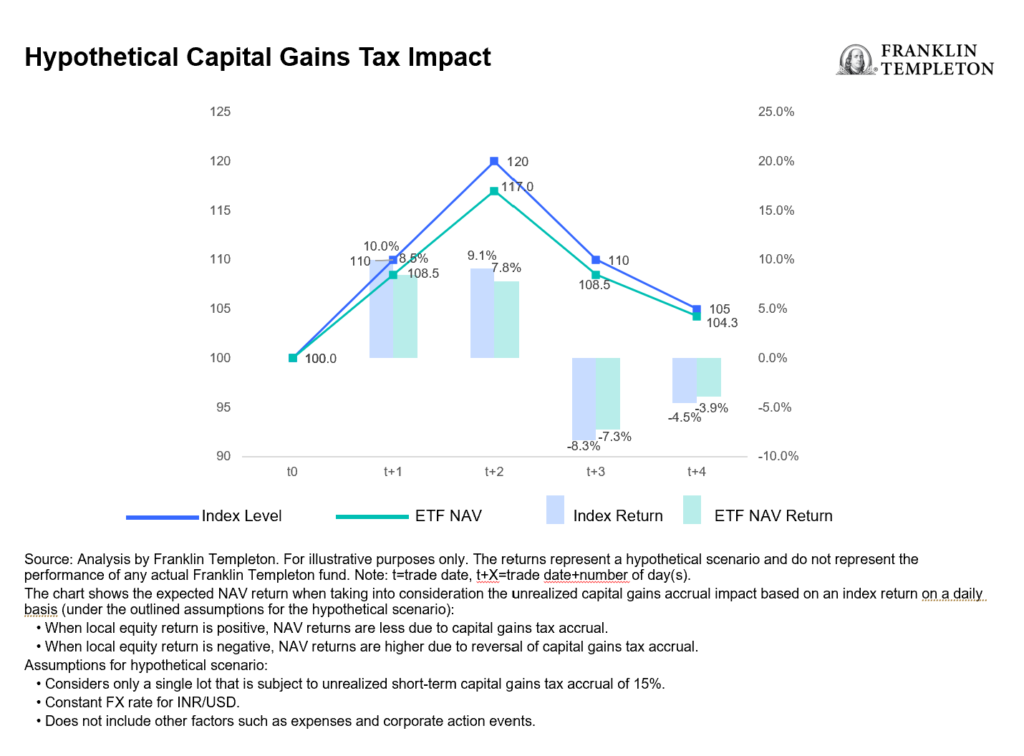
To accrue or not to accrue: Consistent with market practice for US-listed India ETF providers, Franklin Templeton accrues unrealized CGT in its daily net asset value (NAV). This can lead to differences in performance relative to the benchmark, which does not include CGT. As a result, rising markets will typically lead to fund underperformance against a benchmark, while weaker market environments will typically generate outperformance (provided the fund is in an unrealized capital gain position where the current market value of fund holdings is above their historical book cost). See chart below.
For UCITS-listed India funds, there is a divergence in methods utilized by fund providers in accruing and reporting CGT. Some do not accrue unrealized CGT in the NAV, but will charge CGT to investors directly at redemption, which we believe leaves investors with a level of opaqueness and uncertainty over their ultimate proceeds. This method also creates an elevated NAV compared to what investors will actually experience. While Franklin Templeton’s approach to CGT may at times lead to a higher tracking difference,1 we believe investors benefit from increased transparency and a more reflective experience.
The magnitude and impact of CGT for a specific fund is heavily dependent on several variables, such as the timing of purchases and sales, performance of the holdings and their volatility, and the size of flows in and out of the fund relative to its assets under management (AUM).
Understanding the impact: The CGT impact to fund performance is driven by the path of returns, timing of individual lots and price points. Very broadly speaking, in rising markets, an NAV-accruing fund will likely underperform its benchmark and vice versa.
Consideration of comparability: Because different providers handle CGT differently, the comparability of fund performance metrics may be affected. As investors, it’s prudent to consider how these nuances may influence investment decisions within the broader context of your financial strategy.
The bigger picture: While CGT considerations are important, they should be viewed within the broader spectrum of investment objectives and risk tolerance. Taking a long-term perspective and being mindful of other important characteristics of the investment vehicle of choice may aid in the decision-making process.
In summary, India remains an attractive investment destination with compelling growth prospects for its equity markets. Investors seeking India allocation through an ETF should be aware of the current tax regime and what varying methods of accounting methodologies really mean for fund valuation.


Vilken är den bästa fond som följer Nasdaq-100?

Inevitable in India: Crowds, cricket and capital gains tax

XB33 ETF köper företagsobligationer i euro som förfaller 2033

Ny ETF från Franklin Templeton investerar med katolska värderingar

Playing the AI revolution through commodities and gold’s curious rally

ETFmarknaden i Europa firar sitt 24-årsjubileum med tillgångar på två biljoner USD

De mest populära börshandlade fonderna mars 2024

Tillgång till obligationsmarknaden för företagsobligationer från utvecklade marknader

FUIG ETF investerar i hållbara företagsobligationer som följer Parisavtalet

Försvarsfond når förvaltad volym på 500 MUSD
-
 Nyheter2 veckor sedan
ETFmarknaden i Europa firar sitt 24-årsjubileum med tillgångar på två biljoner USD
-
 Nyheter4 veckor sedan
De mest populära börshandlade fonderna mars 2024
-
 Nyheter2 veckor sedan
Tillgång till obligationsmarknaden för företagsobligationer från utvecklade marknader
-
 Nyheter4 veckor sedan
FUIG ETF investerar i hållbara företagsobligationer som följer Parisavtalet
-
 Nyheter2 veckor sedan
Försvarsfond når förvaltad volym på 500 MUSD
-

 Nyheter4 veckor sedan
Vad händer härnäst för Bitcoin?
-

 Nyheter3 veckor sedan
Ny börshandlad fond från Deka ger tillgång till S&P 500-index
-

 Nyheter2 veckor sedan
Bygg din egen pengamaskin