
Nyheter
CHINA AT AN INFLECTION POINT
CHINA AT AN INFLECTION POINT. We are pleased to introduce the inaugural issue of the China Macro Monitor. This publication is a new regular report focusing on macro developments in China relevant to investors across asset classes and markets. The report will focus on recent developments as well as take periodic deep dives into areas that may affect macro and market conditions going forward.
In this first report we outline our base case macro scenario for China and summarise significant recent developments.
We believe China’s economy has bottomed and growth will rebound in H2 2014. After experiencing a modest slowdown in H1 2014, we anticipate growth will recover in H2 2014 as financial easing, fiscal stimulus and improving global growth boost the economy.
China will see an increase in defaults and bankruptcies in 2014. However, this is part of a deliberate move by the government to increase the role of the market in allocating capital, not a harbinger of financial crisis as some commentators have postulated.
China A shares present good long term value at current levels. China A shares are trading at very low valuations relative to history and relative to most other major global equity benchmarks. We believe the China local equity markets have found a bottom together with the economy and present good long term value at current levels.

CHINA OUTLOOK 2014
China’s GDP rose by 7.7% in 2013, making it one of the fastest growing economies in the world. While the economy has been stronger than many analysts expected, China’s growth rate has slowed from the 10%-12% growth rates of the 2009-10 period to what we would argue is a much healthier and sustainable 7%- 8% range. The slowdown in growth has occurred as a consequence of policy tightening put in place by the government in 2011 to reduce speculative lending by non-bank financial institutions (“shadow banks”) and overinvestment stemming from the government’s aggressive easing of monetary controls following the 2008 global financial crisis.

Currently, monetary policy is being targeted to keep economic growth high enough to maintain full employment (7% GDP growth is generally considered the lower limit), but tight enough to rein in speculative credit activity and prevent destabilising asset bubbles from forming. With GDP growth slowing to 7.4% in 1Q 2014 and inflation well below target, the bulk of stimulus is currently focused on fiscal policy.

A new stimulus program
In early April the government announced measures to stimulate growth, accelerating infrastructure investment programs, including stepped-up spending on regional railways and low cost housing. It also extended preferential tax policies on small businesses.
Further measures are likely to be announced in the coming months, potentially including policies to further open up domestic markets to foreign investors, policies to deepen bond and other domestic financial markets, and stepped-up restructuring of state-owned enterprises.
Accelerated urbanisation
While government spending has played a central role in boosting growth since the global financial crisis, private consumption and private sector-led investment is expected to play an increasingly important role over the next decade. A key focus of the government’s five year plan unveiled at the government’s 3rd Party Plenum last November, is the reform of the state-owned sector, with an emphasis on unleashing productivity gains from private sector-led growth. Stepped-up urbanisation programs are expected to boost both productivity and private consumption by bringing more labour into urban services sectors.
Financial liberalisation to boost productivity
Another key prong to the reform plan announced last November is accelerated financial liberalisation. In March the People’s Bank of China widened the daily trading band of the Chinese Renminbi in order to increase two-way risk in the currency and allow it to more accurately reflect market forces. However, with foreign exchange reserves rising to nearly US$4 trillion at the end of March, and the country continuing to run current account surpluses, further medium-term appreciation of the currency seems likely. As part of its move to increase the importance of markets in allocating resources, the central bank has also allowed greater volatility in short-term interest rates and has indicated that it plans to gradually liberalise bank deposit rates over the next two years.

Real estate market to weaken but defaults will be contained
While recent defaults by Chinese corporates and wealth management products have had a negative impact on investor sentiment, we believe these controlled defaults and bankruptcies – by introducing risk into financial markets – are a critical part of the government’s move to increase the role of market forces in allocating resources.
Of course there is always a risk that defaults do not remain under control and that contagion and panic cause a systemic financial crisis. Local government debts are large and there has been substantial misallocation of capital over many years that means banks are sitting on a large number of loans that are unlikely to be paid back.
The government is explicitly trying to cool down an overheated property market – particularly in second and third tier cities. This also will likely add pressure on banks and local governments’ balance sheets. These are risks the government will have to manage carefully to limit contagion and prevent individual instances of bankruptcy and default turning into wider financial and economic dislocation.

Government has substantial resources at its disposal
The central government, however, has substantial resources available to it that should ensure a systemic crisis will be avoided. The government has a small debt burden (around 23% of GDP) and only a small portion of this is foreign debt.
Unlike a number of European countries in the 2008-10 global financial crisis, China has the fiscal resources to support its economy if necessary. In addition, with nearly US$4 trillion in foreign exchange reserves at its disposal, the balance of payments is well protected and there are substantial funds available if financial conditions deteriorate. Therefore, while China is moving into unchartered territory as it liberalises its markets and moves to a more market-based system, it goes into this process with policy-makers well aware of the risks and very well-armed with the fiscal and financial resources to ensure the transition does not disrupt the country’s growth path.

China A shares trading on lowest PE since 2008
The China A share market, as measured by the MSCI China A Index, is currently trading on a price-to-earnings ratio of around 10.8X current earnings at 9X forward earnings, making it the cheapest it’s been since the worst part of the 2008 global financial crisis and one of the cheapest markets in the world. Assuming China is able to manage its current transition period without any substantial policy mistakes, and real GDP growth stabilises in the 7%-8% range as we expect, in our view China equities currently present good value for long-term investors.


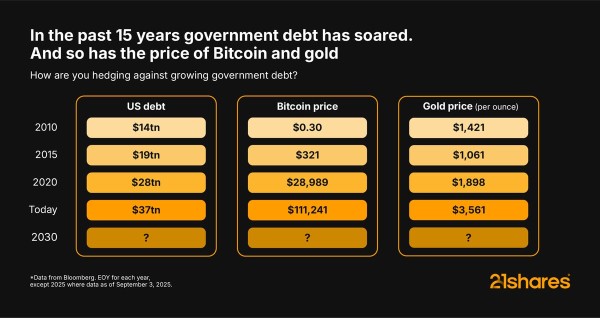
Amid soaring US debt and Gold’s steady gains, Bitcoin has continued to deliver strong returns over the past 15 years. Its scarcity and decentralization make it a hedge that investors can’t ignore, providing new ways to pursue growth, security, and opportunity in an evolving financial landscape.

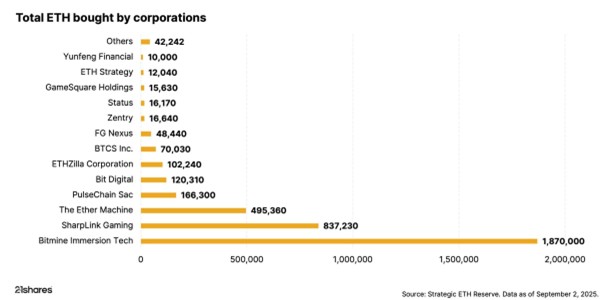
Investors can’t ignore the corporate world’s big bet on Ethereum
Ethereum is stealing the spotlight, as public companies have accumulated over 4.4 million ETH, worth nearly $19 billion, in the past few months. This treasury boom is outpacing Bitcoin’s early adoption and redefining how Wall Street approaches digital assets.


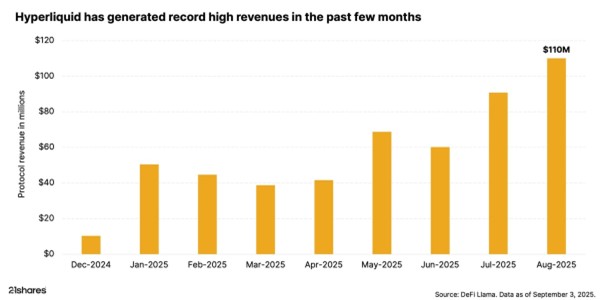
The rise of Hyperliquid: DeFi’s record-breaking powerhouse
Hyperliquid is making waves in DeFi perpetuals by setting new records, leading trading volumes, and propelling its token to all-time highs. Backed by market volatility, high-performance infrastructure, and concentrated liquidity, the platform continues to draw investors and assert its market dominance.

Research Newsletter
Each week the 21Shares Research team will publish our data-driven insights into the crypto asset world through this newsletter. Please direct any comments, questions, and words of feedback to research@21shares.com
Disclaimer
The information provided does not constitute a prospectus or other offering material and does not contain or constitute an offer to sell or a solicitation of any offer to buy securities in any jurisdiction. Some of the information published herein may contain forward-looking statements. Readers are cautioned that any such forward-looking statements are not guarantees of future performance and involve risks and uncertainties and that actual results may differ materially from those in the forward-looking statements as a result of various factors. The information contained herein may not be considered as economic, legal, tax or other advice and users are cautioned to base investment decisions or other decisions solely on the content hereof.

IncomeShares passed three milestones in August. Assets under management climbed to almost $66 million, cumulative fund flows topped $72 million, and turnover across London and Xetra listings reached over $27 million. Palantir paid the highest annualised distribution yield at 57.11%. The sections below break the numbers down in more detail.
Cumulative fund flows
Fund flows track how much money investors put into or take out of IncomeShares ETPs (exchange-traded products). Positive flows mean more money coming in than going out – a sign of demand for the products.
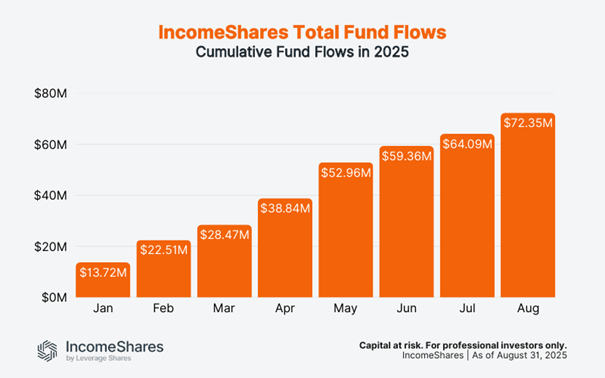
Flows have risen every month this year. In January, they stood at $13.7 million. By the end of August, they reached $72.4 million. That’s over $8 million of new money added in August alone – the biggest increase since May.
Trading turnover
Turnover is the total dollar value of IncomeShares ETPs bought and sold on the exchanges. Higher turnover means more activity and liquidity for investors.
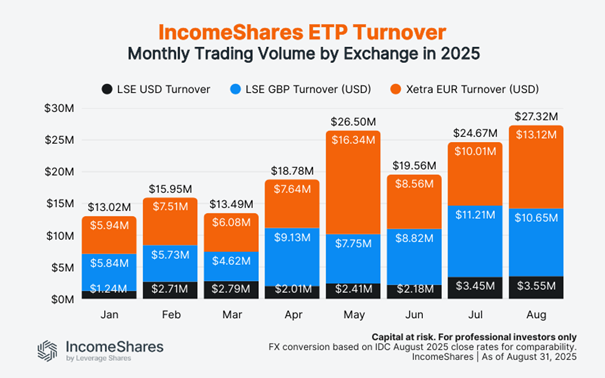
Turnover reached $27.3 million in August – the highest on record and more than double January’s $13.0 million. London listings (USD and GBP combined) made up $14.2 million, with Xetra listings close behind at $13.1 million. Both exchanges have seen steady increases through 2025, showing rising interest in income options strategies across the board.
Note: Figures use IDC FX rates as of the August month-end to convert GBP and EUR into USD. We apply the same August rates to all prior months to compare turnover on a like-for-like basis.
Assets under management (AUM)
AUM is the total value of assets held across all IncomeShares ETPs. It grows when new investors buy in, or when the underlying assets rise in value.
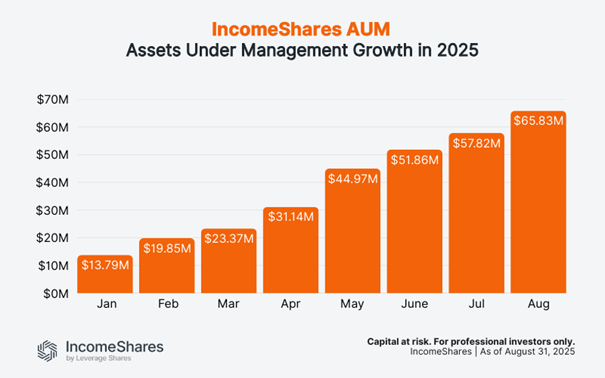
AUM grew from $13.8 million in January to $65.8 million at the end of August. It was also $8 million more than in July. Steady inflows and consistent income distributions are helping the product range build scale.
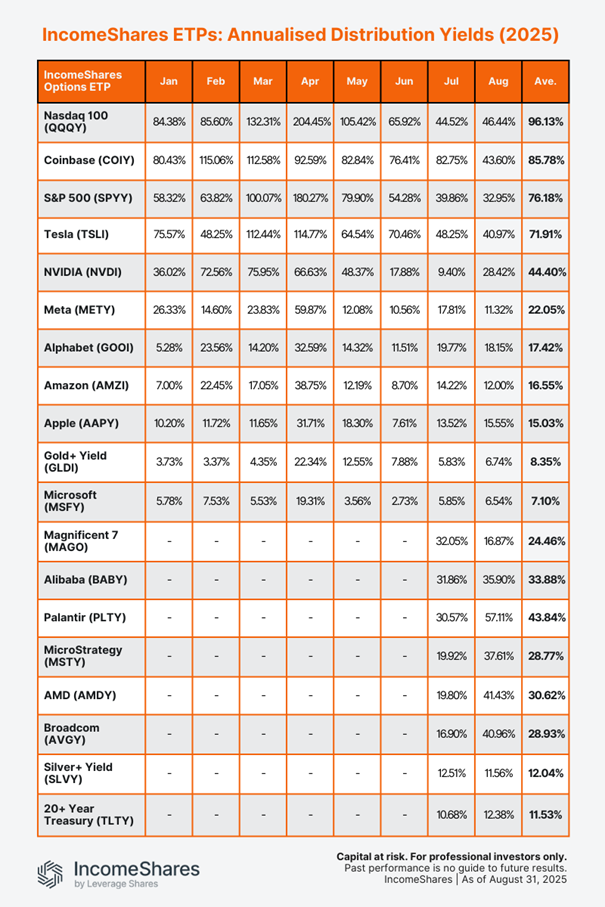
Distribution yields
Distribution yields represent the annualised income paid to investors as a percentage of the current NAV (net asset value), based on the latest month’s yield. IncomeShares ETPs aim to generate this income from selling options. Yields change each month depending on strategy performance and market volatility.
Annualised August yields (ranked highest to lowest):
• Palantir Options ETP (PLTY): 57.11%
• Nasdaq 100 Options ETP (QQQY): 46.44%
• Coinbase Options ETP (COIY): 43.60%
• AMD Options ETP (AMDY): 41.43%
• Tesla Options ETP (TSLI): 40.97%
• Broadcom Options ETP (AVGY): 40.96%
• MicroStrategy Options ETP (MSTY): 37.61%
• Alibaba Options ETP (BABY): 35.90%
• S&P 500 Options ETP (SPYY): 32.95%
• NVIDIA Options ETP (NVDI): 28.42%
• Alphabet Options ETP (GOOI): 18.15%
• Magnificent 7 Options ETP (MAGO): 16.87%
• Apple Options ETP (AAPPY): 15.55%
• 20+ Year Treasury Options ETP (TLTY): 12.38%
• Amazon Options ETP (AMZI): 12.00%
• Silver+ Yield Options ETP (SLVY): 11.56%
• Meta Options ETP (METY): 11.32%
• Gold+ Yield Options ETP (GLDI): 6.74%
• Microsoft Options ETP (MSFY): 6.54%
Our Palantir ETP topped the list with an annualised yield of 57.11% for August, up from 30.57% in July. The stock was volatile in August, trading between $142 and $190. That wider range increased option premiums, which boosted the ETP’s yield. The ETP sells put options on Palantir stock and holds shares – the strategy used for all our single stock ETPs and the Magnificent 7 product.
The Nasdaq 100 ETP paid an annualised yield of 46.44% in August, up slightly from 44.52% in July. At the other end, Gold+ and Microsoft stayed below 7%, reflecting relatively calmer conditions in their underlying assets.
The table below shows the annalised distribution yields for all IncomeShares ETPs so far this year. Note that the bottom eight ETPs launched in late June, so they only have yields for July and August.
Key takeaways
• Fund flows climbed to $72.4 million, with August adding more than $8 million.
• Turnover hit a record $27.3 million, split almost evenly between London and Xetra.
• Palantir topped the yield table at 57%, with Nasdaq 100 and Coinbase also paying above 40%.

Concerned about rising government debt? Bitcoin’s got you covered

N100 ETF följer det amerikanska Nasdaq 100 indexet

IncomeShares Monthly Investor Update – August 2025

CHSJ ETF investerar i CLO-obligationer

HYPE ETP ger exponering mot Hyperliquid

VALOUR ARB SEK spårar priset på kryptovalutan Arbitrum

Månadsutdelande ETFer uppdaterad med IncomeShares produkter

Utdelningar och försvarsfonder lockade i augusti

HANetfs analyserar hur ett fredsavtal kan påverka det europeiska försvaret

De bästa innovations-ETFerna
-
 Nyheter4 veckor sedan
VALOUR ARB SEK spårar priset på kryptovalutan Arbitrum
-
 Nyheter2 veckor sedan
Månadsutdelande ETFer uppdaterad med IncomeShares produkter
-
 Nyheter1 vecka sedan
Utdelningar och försvarsfonder lockade i augusti
-
 Nyheter2 veckor sedan
HANetfs analyserar hur ett fredsavtal kan påverka det europeiska försvaret
-
 Nyheter4 veckor sedan
De bästa innovations-ETFerna
-

 Nyheter3 veckor sedan
HANetfs VD kommenterar Trump-Putin-toppmötet
-

 Nyheter2 veckor sedan
ADLT ETF investerar bara i riktigt långa amerikanska statsobligationer
-
 Nyheter4 veckor sedan
IncomeShares når 60 miljoner dollar i förvaltat kapital – Tillväxtöversikt 2025