
Nyheter
The UK to enter the economic doldrums
ETF Securities Macro & Equities Research: The UK to enter the economic doldrums
Highlights
- A combination of weaker loan growth, sterling weakness, squeezed corporate margins and negative real wages are likely to push the UK into a period of very low growth in the coming year.UK corporates have seen a substantial deterioration in interest cover, and falling earnings caused by a weakening economy are likely to exacerbate the deteriorating economic growth outlook.More cyclical sectors such as mining tend to be much more vulnerable, as does the real estate sector, which tends to decline by 4% over a 6-month period.
Our UK business cycle indicator
The UK’s economic growth prospects have come in to question in recent months after tense Brexit negotiations. Looking at the economy since the UK exited recession in February 2010 it has certainly been the weakest recovery of the 5 post recession recoveries since the 1950’s, but by no means the longest one.

(Click to enlarge)
We see evidence of weakness in the UK economy but this isn’t evident in the current GDP growth figures. We believe that due to the uniqueness of Brexit and its potential impact on the business cycle and currencies it is necessary to have a more focussed economic growth indicator. Consequently, we have developed our own economic barometer that focusses on the business cycle, corporate margins, loan growth and wages to measure turning points in economic data.
Using a combination of the well-known Conference Board Leading Economic Indicator (LEI), consumer price inflation less producer price inflation (CPI-PPI) to capture corporate margins, the British Bankers Association (BBA) loan growth data and real wage growth, it has successfully captured the business cycle.

(Click to enlarge)
Our business cycle indicator is not entirely correlated with GDP growth, typically taking longer to recover than GDP growth, we believe this reflects the delay in looser monetary policy transmitting into the corporate lending environment. For example, it wasn’t until the introduction of the second and third rounds of quantitative easing in 2011 and 2012 that the UK lending environment began to markedly improve, and therefore the business cycle improve.
We can blame Brexit
Sadly, this economic improvement looks to be coming to an abrupt end – our cycle indicator immediately began deteriorating in March 2016, after the first set of data became available following the announcement of the EU referendum. BBA loan growth began to weaken and the LEI began to flatten. Furthermore, the weaker sterling, caused by the Brexit vote has pushed up producer prices, forcing import costs higher and consequently squeezing corporate margins. We have also seen further declines in loan growth leading to a steady decline in the UK’s growth prospects. Higher inflation has also put further pressure on wages, with real wage growth now being negative for the fourth month in a row, further constricting consumers’ spending power.
Alarmingly, our business cycle indicator now suggests the UK could slip in to a period of very low growth in the coming year. We believe only a continued strong recovery in sterling, a recovery in loan growth and wage growth would turn around the UK’s fortunes. We are reluctant to state that a recession is likely at this point as it remains very unclear how the Brexit negotiations will play-out.
The market implications
In our report, Vulnerabilities exposed by rising interest rates, from a regional perspective we find, like households, that Europe and the US have the healthiest interest coverage ratios, while UK corporates have seen a substantial deterioration in interest cover, having falling from 9x in 2012 to just 3.4x today. The FTSE is therefore much more vulnerable to interest rate rises and falling earnings caused by a weakening economy, potentially exacerbating the economic growth outlook. Within the UK, we find the most vulnerable sectors are resource and property related sectors.

(Click to enlarge)
Historically FTSE 350 performance has varied at various stages through the economic cycle. Breaking down the cycle in to four components, we find distinct performance differences within sectors. The FTSE 350 tends to perform the best when the business cycle is negative but is beginning to rise and performs the poorest when the cycle begins to rollover after a period of strong economic performance.
The countercyclical nature of equity market performance is due to the bubble of optimism popping, when equities are usually over extended from a valuation standpoint. Valuations at the beginning of 2017 were at their highest since the credit crisis but the recent weak sterling has increased valuations due to inflating overseas source earnings.

(Click to enlarge)
We see the positive impact of currency on equity valuations as transitory. Our cycle indicator highlights the UK growth outlook is deteriorating and is likely to turn negative, and in such a scenario the FTSE350 has historically risen by 2.2% over a 6 month period. The best performing sectors at this stage tend to be defensive sectors such as utilities and defence contractors and those sectors that can deliver cost efficiencies for corporates such as software and computer services.

(Click to enlarge)
More cyclical sectors such as mining tend to be much more vulnerable, as does the real estate sector, which tends to decline by 4% over a 6-month period. These also happen to be the sectors which are the most over-leveraged from an interest coverage perspective.
We believe the UK’s economic growth prospects are very contingent on economically beneficial negotiations with the EU and a very cautious approach from the Bank of England, as a policy error or a bad deal could tip the UK into recession.
For more information contact:
ETF Securities Research team
ETF Securities (UK) Limited
T +44 (0) 207 448 4336
E info@etfsecurities.com
Important Information
This communication has been issued and approved for the purpose of section 21 of the Financial Services and Markets Act 2000 by ETF Securities (UK) Limited (“ETFS UK”) which is authorised and regulated by the United Kingdom Financial Conduct Authority (the “FCA”).


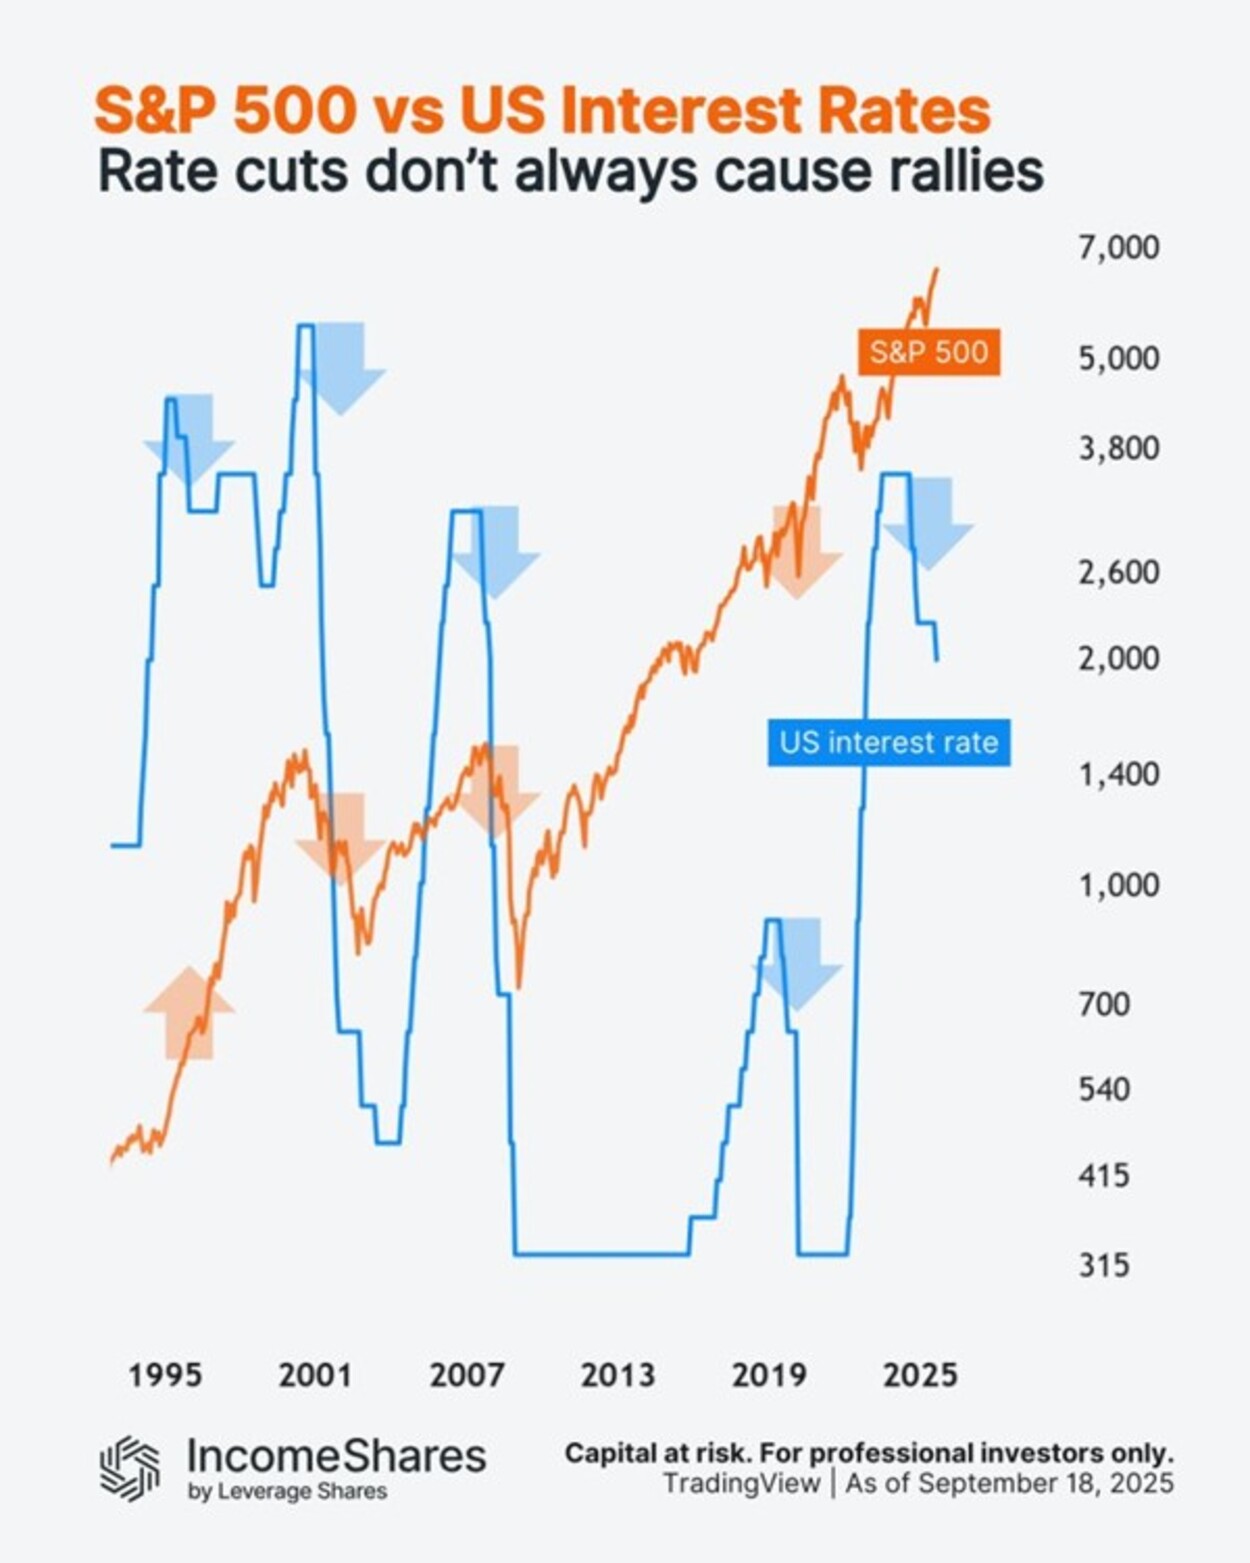
Den amerikanska centralbanken Federal Reserve sänkte räntorna med 0,25 % i veckan– men vad kan det betyda för den amerikanska aktiemarknaden?
Detta diagram följer S&P 500-indexet (orange linje) mot amerikanska räntor (blå linje) sedan 1990-talet.
Här är vad som hände med aktierna de senaste gångerna Fed började sänka räntorna från tidigare ränte”toppar”:
• 1995: aktierna steg (före dotcom-bubblan).
• 2000: aktierna föll (dotcom-bubblan sprack).
• 2007: ytterligare en björnmarknad (före finanskrisen 2008).
• 2019: aktierna steg först (sedan föll de in i Covid-kraschen 2020).
Fyra av fem gånger sammanföll räntesänkningarna med stora nedgångar. Men orsakerna var alltid olika. Korrelation innebär inte kausalitet.
Och nu, 2024/25, befinner vi oss i en ny sänkningscykel. Aktierna sjönk med cirka 20 % i början av 2025, men har sedan dess stigit till nya toppar. Frågan är, vad händer härnäst?
IncomeShares S&P500 Options (0DTE) ETP har exponering mot S&P 500 och säljer dagliga säljoptioner för potentiell inkomst.
Följ IncomeShares EU för marknadsinsikter.


HANetfs VD kommenterar kärnkraftsavtalet mellan Storbritannien och USA

WMSE ETF en global momentumfond som handlas i euro och pund

Federal Reserve sänkte räntorna med 0,25 %

ARAY ETP följer priset på kryptovalutan Raydium

Bellevue lanserar aktiv hälso-ETF på Xetra

Utdelningar och försvarsfonder lockade i augusti

Månadsutdelande ETFer uppdaterad med IncomeShares produkter

HANetfs analyserar hur ett fredsavtal kan påverka det europeiska försvaret

ADLT ETF investerar bara i riktigt långa amerikanska statsobligationer

Septembers utdelning i XACT Norden Högutdelande
-
 Nyheter3 veckor sedan
Utdelningar och försvarsfonder lockade i augusti
-
 Nyheter4 veckor sedan
Månadsutdelande ETFer uppdaterad med IncomeShares produkter
-
 Nyheter4 veckor sedan
HANetfs analyserar hur ett fredsavtal kan påverka det europeiska försvaret
-
 Nyheter4 veckor sedan
ADLT ETF investerar bara i riktigt långa amerikanska statsobligationer
-
 Nyheter2 veckor sedan
Septembers utdelning i XACT Norden Högutdelande
-

 Nyheter4 veckor sedan
Fastställd utdelning i MONTDIV augusti 2025
-

 Nyheter2 veckor sedan
HANetf kommenterar mötet mellan Kina, Ryssland och Nordkorea vid militärparad
-

 Nyheter4 veckor sedan
AICT ETF investerar i obligationer utgivna av företag från tillväxtmarknader