Weekly Flows Analysis – The Fed minutes boost gold
Gold ETPs registered strong inflows after the release of the Federal Reserve (Fed) minutes of the March meeting on Wednesday suggested the chances of a rate hike in the short term were extremely limited. The larger than expected draw on US crude oil inventory helped maintain flows into oil ETPs steady. Inflows into broad commodity basket have risen to their highest level since December last year.
Inflows into broad baskets indicate a stronger interest from investors led by gold rebound and energy. Inflows into commodity baskets rose by their highest level since early December 2015 (US $27.3mn).
Precious metals benefited from the increased risk aversion following the release of the Fed’s minutes. Gold ETPs attracted larger inflows last week, US $118.6mn from US$96.8 the week before, as investors scaled back expectations for further rates hikes in the US. The minutes of the Fed’s March FOMC meeting released Wednesday showed officials seeing persistent external risks and the threats they posed to the US economy. As a result, the odds of a rate hike in December have dropped to 48 percent from 58 percent earlier last week, based on Fed-fund futures data. Market participants now expect policy makers’ next move in February 2017. The increase of risk aversion and the subsequent decline of the US dollar versus Japanese Yen and Euro, led to the gold rally last week. Silver ETP inflows also increased last weak reaching their 4 week high, marking seven consecutive weeks of increase.
Energy ETPs continue to attract strong inflows, led by Brent oil ETPs (US$17.6mn). Ahead of Doha meeting on April 17, oil prices advanced last week on speculation over whether an accord to freeze or cap output can be reached. Saudi Arabia said it will only agree to a freeze if other suppliers do so, while Kuwait said a deal can be done without Iran’s support. On the other hand, WTIcrude oil ETPs received inflows worth US$15.3mn as US oil inventories were drawn down more than expected.
Copper ETPs attract US$10.8mn of inflows amid declining price. Inflows into copper reached US$10.8mn last week reflecting investors bargain hunting after copper has declined 4.4% last week to a six-week low of $4,630 per ton. In addition, aluminium ETPs inflows surged to their highest level in six months (US$12.7mn).
Key events to watch this week. Industrial production data in some of the world’s largest economies (US, Euro area and China) will give investors a gauge for how demand for commodities is faring. Additionally, markets participants will also be looking at retail sales and the Empire State survey of manufacturers in the US. Separately, inflation figures in the euro area, UK and US will also be of greatest interest for investors. The Bank of England will conduct its monetary policy meeting on Thursday. The decision is broadly expected by market participants to remain unchanged (i.e. total asset purchases of £375bn and base rate at 0.5%).
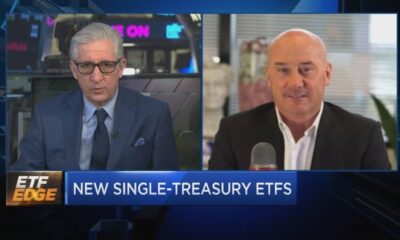
Video Presentation
Morgane Delledonne, Fixed Income Strategist at ETF Securities provides an analysis of last week’s performance, flow and trading activity in commodity exchange traded products and a look at the week ahead.
For more information contact
ETF Securities Research team ETF Securities (UK) Limited T +44 (0) 207 448 4336 E info@etfsecurities.com
Important Information
General
This communication has been provided by ETF Securities (UK) Limited (”ETFS UK”) which is authorised and regulated by the United Kingdom Financial Conduct Authority.
Som alltid med ETFer är det viktigt att veta om de index som spåras av sektor ETFer för att förstå vad du köper in dig i. Investerare kan vända sig till sektor ETF-investeringar för att konstruera sina portföljer på ett annat sätt än den mer traditionella geografiska metoden, eller för att försöka dra nytta av konjunkturcykeln genom att satsa på de sektorer som de tror kommer att överträffa, och undervikta eftersläpande.
Oavsett dina skäl till att välja sektor ETFer, är det viktigt att veta hur de investerar – vilket som alltid med ETFer innebär att förstå indexen som spåras av en sektor ETFs underliggande innehav, och hur dessa index klassificerar de tiotusentals investerarbara aktier som finns tillgängliga i olika sektorer.
Två sektorsklassificeringssystem
De främsta leverantörerna av sektorindex – MSCI och STOXX Limited – baserar sina index på ett av två olika internationellt erkända sektorsklassificeringssystem:
Global Industry Classification Standard (GICS), som delar upp 51 000 värdepapper i 11 sektorer, 24 branschgrupper, 68 branscher och 157 underbranscher.
Industry Classification Benchmark (ICB), som klassificerar 75 000 värdepapper i 10 branscher, 19 supersektorer, 41 sektorer och 114 undersektorer.
GICS vs. ICB klassificering i en överblick
GICS
ICB
Nivå 1
11 sektorer
10 industrier
Nivå 2
24 industrigrupper
10 supersektorer
Nivå 3
68 Industrier
41 sektorer
Nivå 4
157 Subindustrier
115 subsektorer
51 000 aktier
>75 000 aktier
MSCI; ICB Benchmark; Mars 2018 STOXX Limited och FTSE använder ICB-systemet som bas för sina index, medan MSCI och S&P använder GICS.
Hur sektorsklassificeringssystemen fungerar
Båda systemen är baserade på en hierarki av grupperingar – från breda sektorsklassificeringar ner till mer specialiserade nischer. Du kan tänka på det som liknar hur vi klassificerar växtriket i familj, släkt, art och så vidare.
Till exempel placeras aktier i företag som får majoriteten av sina intäkter från flygverksamheten av ICB-systemet…
… till undersektorn flyg- och rymdfart
… som är en del av flyg- och försvarssektorn
… som ingår i supersektorn industriella varor och tjänster
… som sitter inom Industribranschen
Även om GICS-systemet är liknande – men absolut inte identiskt – är dess kategorinamn olika. Därför finns risken för investerare förvirring.
Du kan se att den översta nivån under GICS-systemet är ’Sektor’, vilket är den tredje nivån i hierarkin under ICB-systemet. Ändå är dessa bara etiketter – ICB:s ”Industri”-nivå är funktionellt densamma som GICS ”Sector”-nivå.
Och naturligtvis använder kommentatorer – inklusive vi – ordet ”sektor” för att hänvisa till alla möjliga olika branschgrupperingar, inte bara till den specifika betydelsen under GICS- eller ICB-metoderna.
Sektorer/industrier på toppnivå inom GICS och ICB i jämförelse
GICS
ICB
Energy
Oil and Gas
Materials
Basic Materials
Health Care
Health Care
Industrials
Industrials
Financials
Financials
Information Technology
Technology
Telecommunication Services
Telecommunication
Utilities
Utilities
Consumer Staples
Consumer Goods
Consumer Discretionary
Consumer Services
Real Estate
–
Uppe i det blå
Även om de två klassificeringssystemen ytligt sett är ganska lika, finns det några verkliga skillnader när du gräver ner i hur de kategoriserar vissa branscher – och därav var dessa branscher sitter i sina respektive grupperingar.
Till exempel placerar ICB flygbolag i sin rese- och fritidssektor.
Däremot har GICS-systemet flygbolag i sin Airlines Industry-kategori, som är en del av dess Transportation Industry Group.
Det betyder inte att den ena kategoriseringen är bättre än den andra – och vi kan helt klart inte gå igenom alla skillnader mellan dessa system här.
Snarare vill vi belysa varför du behöver undersöka en ETF grundligt innan du köper den för att säkerställa att den kommer att exponera dig korrekt för resultatet av den typ av aktier du letar efter.
Sektorer, regioner och optimerade ETFer
Rent praktiskt, även om de djupare nivåerna i sektorklassificeringshierarkierna är viktiga att känna till, är det bara de högre nivåerna av GICS och ICB som faktiskt kan investeras genom ETFer
Se tabellen nedan för en översikt över vad som är tillgängligt just nu.
En ytterligare rynka är att sektor ETFer finns i regionala och globala varianter.
Till exempel har Xtrackers sektor ETFer fokuserade på MSCI Emerging Markets basindex, såväl som MSCI World.
Återigen, se tabellen nedan.
Det finns också sektor ETFer som spårar ”optimerade” och ”begränsade” versioner av vissa index.
Till exempel erbjuder Invescos sektor ETFer baserade på STOXX Europe 600 optimerade index.
ETFer som spårar dessa optimerade index kan erbjuda riskhanteringsfördelar jämfört med ETFer som spårar standardindex, eftersom de begränsar den totala exponeringen som fonden kommer att ha mot ett företag.
Investerare kan också föredra dem för den potentiellt överlägsna likviditeten i deras underliggande innehav.
Den börshandlade fonden investerar i ett urval av företag världen över som är optimerade enligt låg volatilitet och ESG-kriterier (miljömässiga, sociala och bolagsstyrningsaspekter).
ETFens totala kostnadsratio (TER) uppgår till 0,25 % per år. Utdelningen i ETFen delas ut till investerarna (halvårsvis).
Invesco Global Active Defensive ESG Equity UCITSETFDist är en mycket liten ETF med 1 miljon euro i förvaltningstillgångar. Denna ETF lanserades den 23 september 2025 och har sitt säte i Irland.
Handla LVLD ETF
Invesco Global Active DefensiveESG Equity UCITSETFDist (LVLD ETF) är en europeisk börshandlad fond. Denna fond handlas på flera olika börser, till exempel Deutsche Boerse Xetra.
Det betyder att det går att handla andelar i denna ETF genom de flesta svenska banker och Internetmäklare, till exempel Nordnet, SAVR, DEGIRO och Avanza.
Den europeiska marknaden för börshandlade fonder – mer kända under förkortningen ETFer (Exchange-Traded Funds) – befinner sig i en historisk tillväxtfas. Det förvaltade kapitalet inom europeiska UCITSETF:er har nyligen passerat den sensationella milstolpen 3 500 miljarder dollar (USD), drivet av över 40 påföljande månader av positiva nettoinflöden. Men bakom de imponerande rekordsiffrorna pågår en fundamental strukturell förändring. En djuplodande rapport från storbanken Citi (i samarbete med Deloitte) visar att marknaden har gått in i en ny fas. Det räcker inte längre för fondbolag att bara ”paketera om” en traditionell fond och lansera den på börsen. Kampen om investerarnas kapital avgörs nu bakom kulisserna: genom avancerad operationell infrastruktur, strategiska distributionsmodeller och innovativa replikeringsmetoder.
För dig som investerare innebär denna mognadsprocess ett explosionsartat utbud av nya strategier, lägre dolda kostnader och bättre likviditet. Låt oss dyka djupt ner i drivkrafterna bakom den europeiska ETF-boomen och se vad som formar framtidens börshandlade fonder.
Aktiva ETF:er – Den nya frontlinjen
Historiskt har börshandlade fonder nästan uteslutande förknippats med passiv indexförvaltning – som att köpa en billig korg som slaviskt speglar OMXS30 eller S&P 500. Men rapporten från Citi belyser ett dramatiskt skifte.
Även om aktiva produkter i dagsläget bara står för cirka 3 procent av det totala förvaltade kapitalet i Europa, exploderar utbudet. Under det senaste året har nästan hälften (46 procent) av alla nylanserade ETFer varit aktivt förvaltade.
Traditionella kapitalförvaltare, som tidigare hållit sig till klassiska aktiefonder, inser att de måste erbjuda sina strategier i det börshandlade formatet. För investeraren innebär detta att du numera kan köpa en aktivt förvaltad portfölj, där experter handplockar aktier, men med alla de fördelar som en vanlig ETF ger: handel i realtid på börsen, hög transparens och ofta en betydligt lägre prislapp än traditionella aktiefonder.
Syntetiska ETFer gör en stark comeback
En av rapportens mest anmärkningsvärda slutsatser är den förnyade momentumet bakom syntetiska (swap-baserade) börshandlade fonder, i synnerhet för exponering mot den amerikanska aktiemarknaden. Det syntetiska kapitalet har i Europa vuxit till över 409 miljarder dollar – en ökning med över 50 procent på drygt ett år.
Varför väljer kapitalförvaltare och investerare syntetisk replikering framför fysisk (där fonden faktiskt köper de underliggande aktierna)? Svaret stavas skatteeffektivitet.
Genom att använda finansiella kontrakt (swappar) med en investmentbank som motpart kan en UCITSETF som följer ett amerikanskt index (till exempel S&P 500) helt undvika den amerikanska källskatten på utdelningar (så kallad withholding tax). För en fysiskt replikerad fond baserad på Irland försvinner 15 procent av utdelningen i skatt, och för fonder baserade i Luxemburg försvinner 30 procent. En syntetisk ETF kan genom sina kontraktstruktur nå en effektiv källskatt på 0 procent enligt de amerikanska skattereglerna (Hiring Incentives to Restore Employment Act, sektion 871(m)).
Denna dolda skattefördel kan ge en extra avkastning på mellan 0,20 % och 0,40 % per år till investeraren – en skillnad som på lång sikt har enorm betydelse för totalavkastningen.
Det operationella ekosystemet: Tre vägar till marknaden
För att en börshandlad fond överhuvudtaget ska fungera och ha hög likviditet krävs ett komplext nätverk av aktörer, däribland Authorized Participants (auktoriserade deltagare, eller AP:er) och Market Makers (garanter). Det är AP:erna som skapar och makulerar andelar i fonden i den så kallade primärmarknaden, vilket säkerställer att priset på börsen (sekundärmarknaden) ligger så nära fondens faktiska substansvärde (NAV) som möjligt.
Citi poängterar i sin analys att etablerade fondbolag som vill ge sig in i ETF-matchen står inför ett vägskäl gällande sin operationella modell. Att driva en ETF kräver helt andra system för likviditetshantering än en traditionell fond. Rapporten identifierar tre huvudsakliga vägar:
In-house (Egen regi): Fondbolaget bygger upp hela infrastrukturen själv. Detta ger full kontroll och bäst långsiktig ekonomi, men kräver enorma investeringar och tar lång tid.
Hybrid Outsourcing: Kapitalförvaltaren behåller kontrollen över portföljen och distributionen, men outsourcar den dagliga administrationen och kontakten med AP-nätverket till specialistbanker (såsom Citi).
White-Label-plattformar: En snabbväg till marknaden där en extern plattform står för strukturen, tillstånden och börsnoteringen, medan fondbolaget bara agerar underleverantör av själva investeringsstrategin. (Detta är ett segment där stora aktörer som just Citi nu kliver in hårt för att utmana de mindre nischspelarna).
Det regulatoriska skyddet: Varför UCITS är en global guldstandard
När du handlar börshandlade fonder i Europa möter du nästan alltid akronymen UCITS (Undertakings for Collective Investment in Transferable Securities) i fondnamnet. Detta är det europeiska regelverket för publika fonder, och det fungerar som ett strikt konsumentskydd. Citis genomgång påminner om de hårda krav som ställs på en UCITS-fond:
• Diversifiering (5/10/40-regeln): En enskild aktie eller utgivare får maximalt utgöra 10 procent av fondens totala värde. Dessutom får de innehav som väger mer än 5 procent tillsammans inte överstiga 40 procent av fondens totala portfölj. Detta förhindrar att en ETF blir alltför sårbar mot ett enskilt bolags fall.
• Likviditetskrav: Fonden får endast investera i likvida, överlåtbara värdepapper. Direkta investeringar i illikvida tillgångar som fysiska fastigheter, råvaror (direktägda) eller renodlat riskkapital (private equity) är förbjudna.
• Motpartsrisker: För syntetiska ETFer får exponeringen mot en enskild swap-motpart aldrig överstiga 10 procent av fondens substansvärde. Resten måste vara säkrat med högkvalitativa säkerheter (collateral) som uppdateras dagligen.
Det är detta rigorösa regelverk som gjort europeiska börshandlade fonder till en exportsuccé. Det är i dagsläget olagligt för svenska privatpersoner att köpa amerikanskt noterade ETFer (på grund av EU-krav gällande faktablad, PRIIPs KID), vilket har gjort att intresset för de Europanoterade UCITS-alternativen har skjutit i höjden. Fonderna registreras oftast i finansiella nav som Irland eller Luxemburg, men kan enkelt handlas i svenska kronor direkt via din svenska nätmäklare.
De två sidorna av ETF-marknaden
För att summera de viktigaste strukturella trenderna som Citi lyfter fram, kan vi dela upp det moderna utbudet av börshandlade fonder i två huvudkategorier:
Kräver avancerad riskkontroll och daglig hantering av säkerheter.
Vad betyder detta för dig som investerare?
Slutsatsen i Citi och Deloittes rapport är glasklar: marknaden för börshandlade fonder i Europa är inte längre en omogen utmanare – den håller på att bli den dominerande formen för kapitalallokering. Den tilltagande konkurrensen från amerikanska jättar som nu etablerar sig i Europa, i kombination med den tekniska utvecklingen, pressar avgifterna samtidigt som innovationsbördan ökar.
För dig som besöker etfmarknaden.se innebär den här utvecklingen fantastiska möjligheter. Du är inte längre begränsad till enkla indexprodukter. Oavsett om du vill ta rygg på en aktiv stjärnförvaltare via en aktiv börshandlad fond, maximera din avkastning i en skatteoptimerad syntetisk S&P 500-ETF, eller bygga en robust global basportfölj, har det operationella maskineriet bakom kulisserna aldrig varit starkare, säkrare eller mer effektivt.
Framtiden för sparande är här – och den handlas i realtid på börsen.


 Nyheter1 vecka sedan
 Nyheter3 veckor sedan
 Nyheter4 veckor sedan