
Nyheter
Profit-taking leads to outflows in gold ETPs


Nyheter
VettaFis Stacey Morris ser tillväxt i mellanströmssektorn framöver tack vare ökande efterfrågan på LNG och starkt fritt kassaflöde


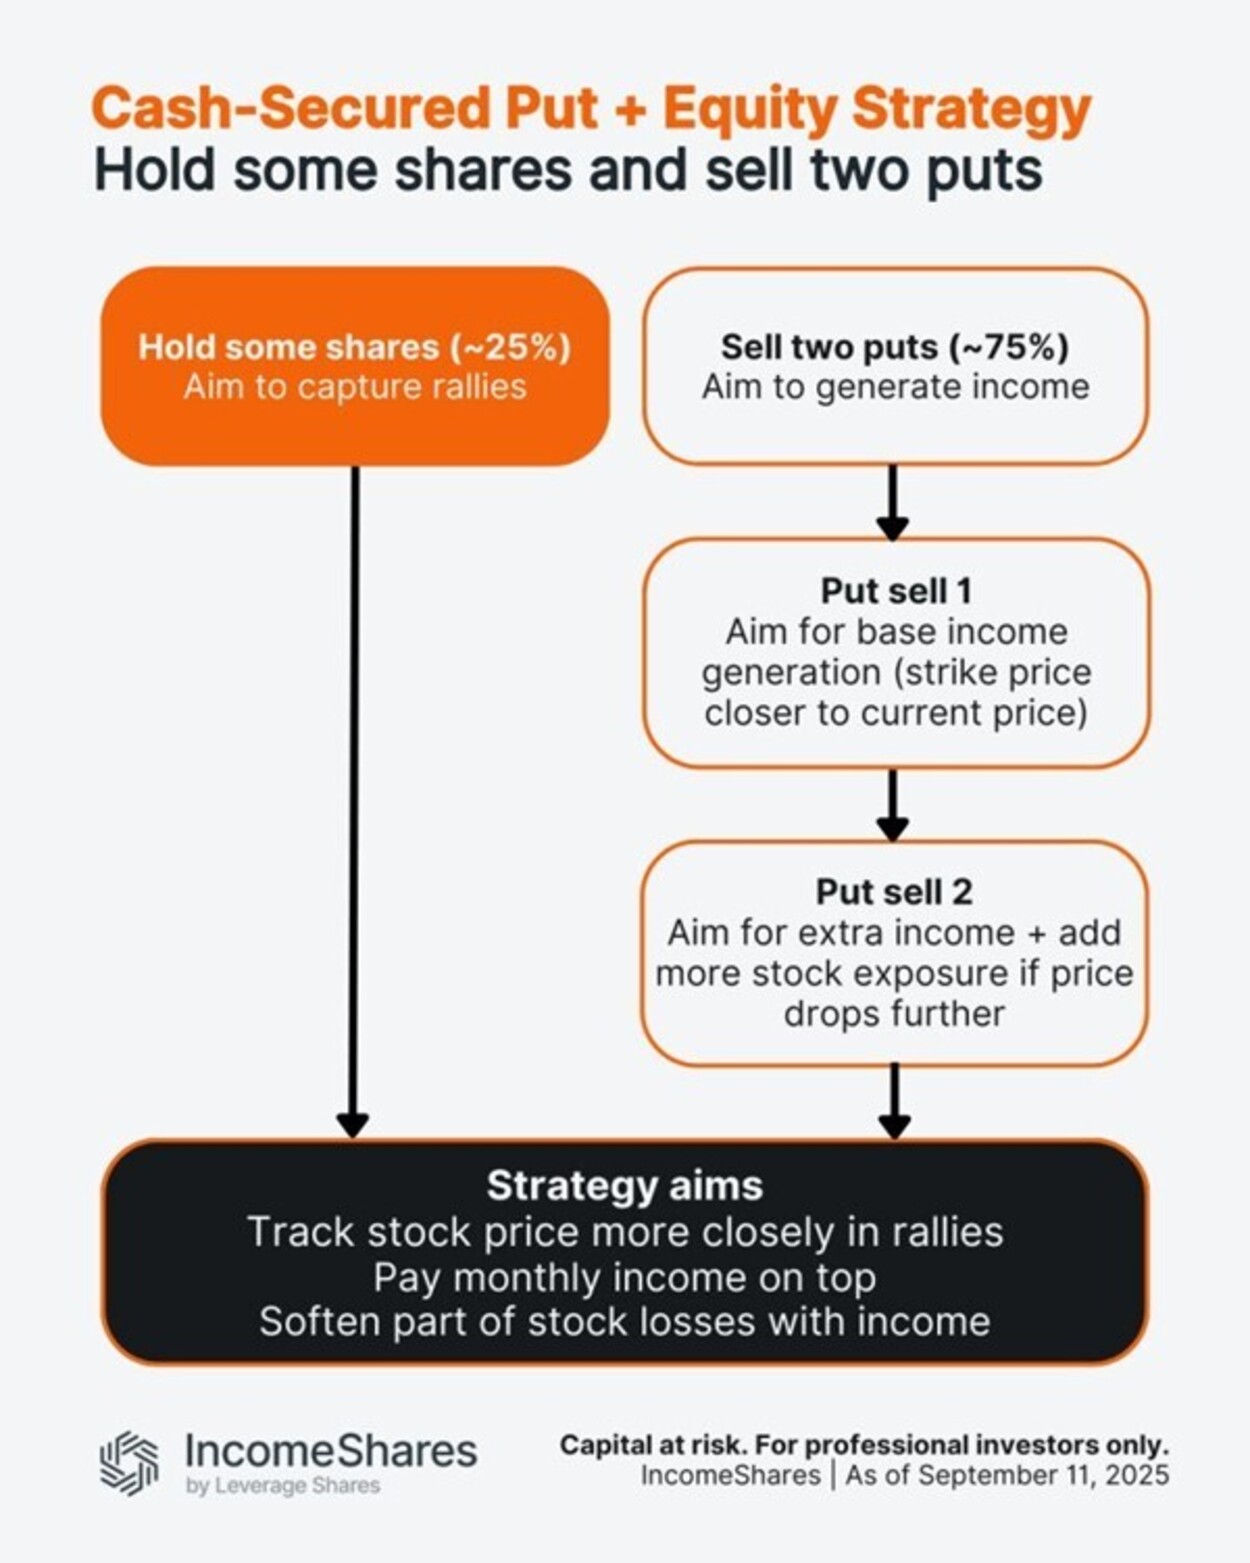
IncomeShares börsnoterade produkter använder en strategi med kontantsäkerhet och aktier. Blandningen är cirka 25 % aktier och 75 % sälj av säljoptioner.
Aktiehylsan (~25 %) kan fånga upp en del av ett rally.
Puthylsan (~75 %) är uppdelad i två delar.
Första put: syftar till basintäkter, med lösenpriser närmare det aktuella priset. Att sälja en put innebär att ETPen får intäkter i förskott, men tar också på sig aktieexponering till lösenpriset om aktiekursen sjunker under den nivån.
Andra put: syftar till extra intäkter, med lösenpriset satt längre från det aktuella priset. Om aktien faller så mycket tar ETPen på sig aktieexponering till den lösennivån. Eftersom den redan har fått intäkter från att sälja säljoptioner är den effektiva kostnaden för den exponeringen lägre än lösenpriset. Det hjälper ETPen att återuppbygga aktieexponeringen istället för att förlora den, så att den kan hålla sig i linje med nästa potentiella rally.
Tillsammans syftar denna metod till att följa aktien närmare i uppgångar, betala ut månadsinkomst utöver det och mildra en del av förlusterna med optionsintäkter. Om aktien faller mycket kan ETPen fortfarande förlora i värde – men intäkterna kan bidra till att dämpa en del av fallet.
Följ IncomeShares EU för mer insikt.


VettaFis Stacey Morris ser tillväxt i mellanströmssektorn framöver tack vare ökande efterfrågan på LNG och starkt fritt kassaflöde

EXCN ETF investerar i emerging markets men exkluderar Kina

Så här fungerar strategin med kontantsäkerhet och aktier

6TVM ETF spårar S&P500 syntetiskt
BlackRock lanserar iShares MSCI World Sector & Country Neutral Equal Weight UCITS ETF

Månadsutdelande ETFer uppdaterad med IncomeShares produkter

Utdelningar och försvarsfonder lockade i augusti

HANetfs analyserar hur ett fredsavtal kan påverka det europeiska försvaret

HANetfs VD kommenterar Trump-Putin-toppmötet

ADLT ETF investerar bara i riktigt långa amerikanska statsobligationer
-
 Nyheter3 veckor sedan
Månadsutdelande ETFer uppdaterad med IncomeShares produkter
-
 Nyheter2 veckor sedan
Utdelningar och försvarsfonder lockade i augusti
-
 Nyheter3 veckor sedan
HANetfs analyserar hur ett fredsavtal kan påverka det europeiska försvaret
-
 Nyheter4 veckor sedan
HANetfs VD kommenterar Trump-Putin-toppmötet
-
 Nyheter3 veckor sedan
ADLT ETF investerar bara i riktigt långa amerikanska statsobligationer
-

 Nyheter1 vecka sedan
Septembers utdelning i XACT Norden Högutdelande
-

 Nyheter3 veckor sedan
Fastställd utdelning i MONTDIV augusti 2025
-

 Nyheter1 vecka sedan
HANetf kommenterar mötet mellan Kina, Ryssland och Nordkorea vid militärparad