
Nyheter
Oil: Backwardation to the future
Oil futures curves have been in backwardation – when the closer futures contract can be sold for a higher price than it costs to buy a futures contract with a further expiry date, resulting in a profit for the investor – for most of the past year, driven by perceived tightness in short-term supply1. This has provided investors with ‘roll yield’ on top of the gains made from spot price movements in oil.
While we believe that the oil market is balanced at present, there is supply tightness in specific areas – especially in heavier crudes – and this could be enough to ensure that the oil futures curve remains mostly in backwardation going forward. Here’s a closer look at current oil market supply and demand dynamics.
Oil curve backwardation
Recent curve backwardation has largely been engineered by the Organisation of Petroleum Exporting Countries (OPEC). Since January 2017, the oil cartel has restricted the supply of oil by assigning its members and partners a quota for the amount of oil that they produce. Although the cartel has historically had a poor history of complying with quotas, this time it has done exceptionally well. Part of the reason for this, is that up until June 2018, each country was allocated an individual quota (rather than a group-wide limit) and this helped to restrict oil supply.
Another reason OPEC has done well in complying with quotas is because of unintended production disruptions. Recently, Venezuela has experienced an economic implosion, and this has impacted oil production significantly. Supply disruptions in Libya and Nigeria have also contributed to OPEC supply volatility.
Can backwardation last?
In June 2018, OPEC abandoned individual country quotas, so the level of quota compliance that we have seen over the past year may not last if the organisation reverts to its old ways. This could explain why the very front of the Brent futures curve went back into contango – when it costs more to buy the new futures contract than the amount received from selling the old futures contract – in July and August. Indeed, Saudi Arabia – the largest OPEC nation – has clearly expanded production since the end of the country-quota system, as have other countries.
After going back to an all-backwardated curve, the short end of the curve is now back in contango, a move underpinned by fears of over supply from increasing rig count in the US, as well as delays in the full implementation of sanctions on Iran. Despite those recent developments, we do not expect them to significantly impact long term supply. While the front end of the curve will remain prone to shifts, we do not see it to durably get back to a mostly contangoed curves.
Figure 1: Year-on-year difference in OPEC oil production

Source: Bloomberg, WisdomTree, data available as of close 05 October 2018.
Historical performance is not an indication of future performance and any investments may go down in value.
Tightness concentrated in heavy crudes
In relation to supply disruption, supply of the ‘heavier’ crudes is most at risk, in our view. Venezuela, Iran and Canada produce ‘heavy’ (low API gravity), ‘sour’ (high sulphur) crudes and these countries experienced the bulk of supply disruption this year.
Most of the world’s growth in crude oil supply is currently from US tight oil, which is ‘light’ (high API gravity) and ‘sweet’ (low sulphur). So, even though global oil supply is close to balance at the headline level, growth in oil production is uneven, with declines in supply of heavy crudes, and gains in supply of light crudes2.
Moreover, while US tight oil is seeing supply growth, there are limitations to this growth. Infrastructure needs to grow in lock-step with growth in oil production, and infrastructure limitations could slow the pace at which US shale can help satisfy global oil needs.
Demand remains strong for now
Looking at forecasts from the International Energy Agency (IEA), demand for oil looks set to remain healthy, with the IEA expecting oil demand to grow by 1.4 mb/d in 2018, and 1.5 mb/d in 2019 (following 1.5 mb/d growth in 2017). Over the medium term, the dearth of capital investment in oil production is likely to lead to tightness if demand continues to remain robust.
Oil futures likely to remain in backwardation
While we believe that the market is in balance at present, there is supply tightness in specific areas and this could be enough to ensure that the futures curve remains mostly in backwardation.
We don’t believe that a new wave of supply is forthcoming as a lack of investment in oil exploration and production should keep supply contained, and it may only take another supply shock to Libya or to Canada to cast doubts on supply. We also think that demand will remain robust, assuming today’s bullish demand expectations are not unfounded.
Source
1 For a full description of backwardation, contango, roll yields, spot return, total return, excess return and collateral yield please see Costs and Performance Tab on our ETPedia page.
2 Energy Information Administration, WisdomTree, data available as of 04 October 2019.
This material is prepared by WisdomTree and its affiliates and is not intended to be relied upon as a forecast, research or investment advice, and is not a recommendation, offer or solicitation to buy or sell any securities or to adopt any investment strategy. The opinions expressed are as of the date of production and may change as subsequent conditions vary. The information and opinions contained in this material are derived from proprietary and non-proprietary sources. As such, no warranty of accuracy or reliability is given and no responsibility arising in any other way for errors and omissions (including responsibility to any person by reason of negligence) is accepted by WisdomTree, nor any affiliate, nor any of their officers, employees or agents. Reliance upon information in this material is at the sole discretion of the reader. Past performance is not a reliable indicator of future performance.


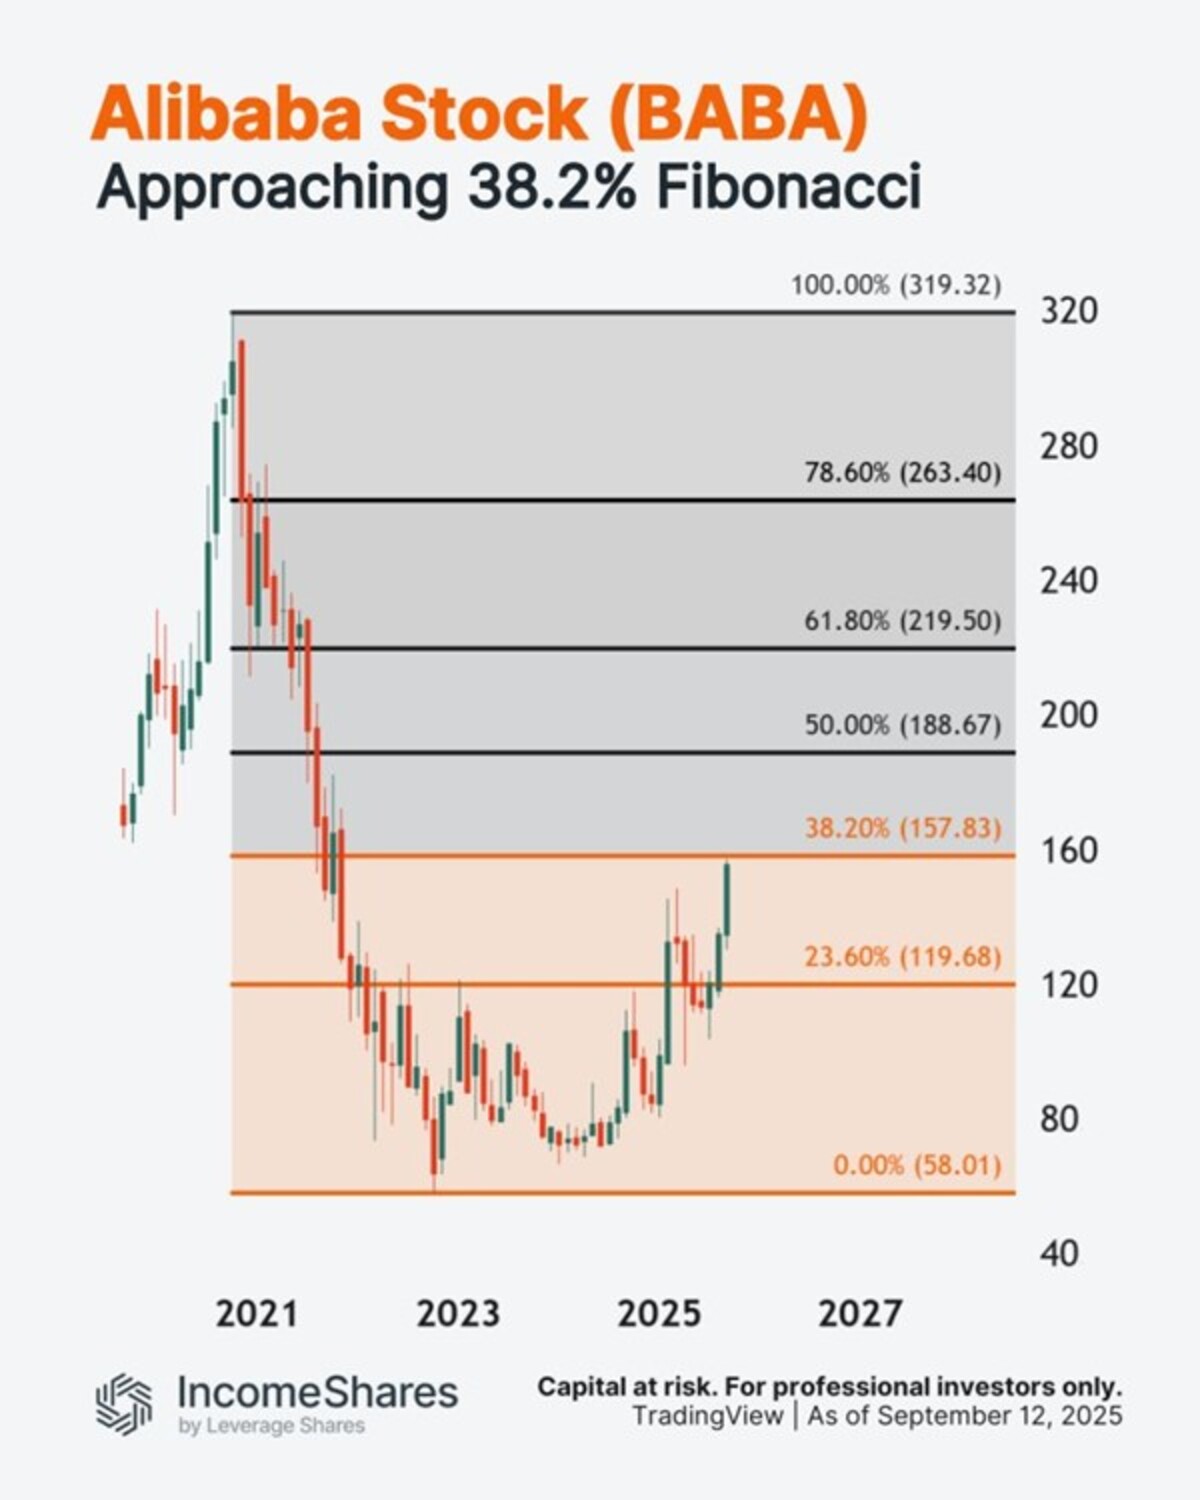
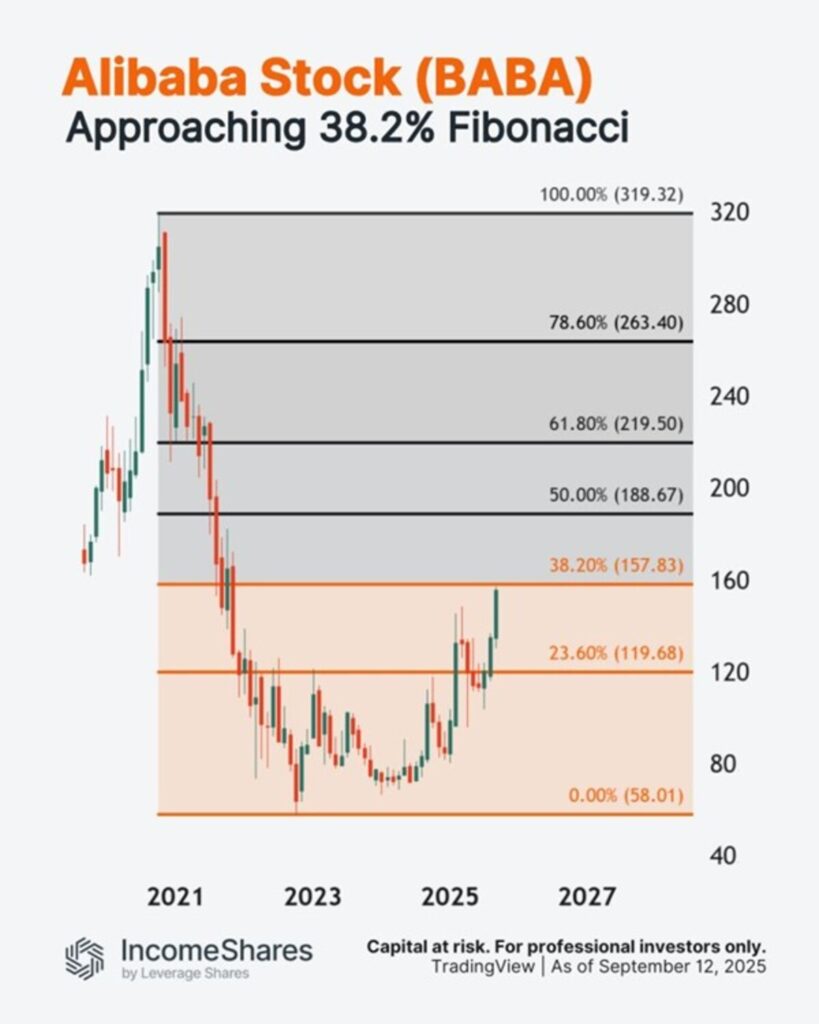
Alibaba-aktien steg med 8 % igår – och är upp cirka 30 % sedan början av juli. Men aktien närmar sig nu ett område med potentiellt ”motstånd”: 38,2 % Fibonacci-retracement.
Så här fungerar 38,2 % Fibonacci-matematiken:
- BABA sjönk med 261,31 dollar från oktober 2020s högsta nivå på 319,32 dollar.
- 38,2 % av 261,31 dollar = 99,82 dollar.
- Lägg till 99,82 dollar till oktober 2022s lägsta nivå på 58,01 dollar för att få 157,83 dollar.
Vissa tekniska handlare använder Fibonacci-retracement för vinsthemtagning – vilket kan skapa säljtryck på dessa nivåer. Diagrammet visar resten av dem.
IncomeShares Alibaba Options ETP använder en kontantsäkrad säljoption plus aktiestrategi på Alibaba-aktier. Detta ger exponering mot aktiens utveckling, med potential för månatlig inkomst.
Följ IncomeShares EU för fler diagram.


IVCS ETF ger exponering mot företag som arbetar med cybersäkerhet

Vägen tillbaka till rekordnivåer är kantad av Fibonacci-motståndsnivåer

COINDOT ETP spårar kryptovalutan Polkadot

VettaFis Stacey Morris ser tillväxt i mellanströmssektorn framöver tack vare ökande efterfrågan på LNG och starkt fritt kassaflöde

EXCN ETF investerar i emerging markets men exkluderar Kina

Utdelningar och försvarsfonder lockade i augusti

Månadsutdelande ETFer uppdaterad med IncomeShares produkter

HANetfs analyserar hur ett fredsavtal kan påverka det europeiska försvaret

HANetfs VD kommenterar Trump-Putin-toppmötet

ADLT ETF investerar bara i riktigt långa amerikanska statsobligationer
-
 Nyheter2 veckor sedan
Utdelningar och försvarsfonder lockade i augusti
-
 Nyheter3 veckor sedan
Månadsutdelande ETFer uppdaterad med IncomeShares produkter
-
 Nyheter3 veckor sedan
HANetfs analyserar hur ett fredsavtal kan påverka det europeiska försvaret
-
 Nyheter4 veckor sedan
HANetfs VD kommenterar Trump-Putin-toppmötet
-
 Nyheter3 veckor sedan
ADLT ETF investerar bara i riktigt långa amerikanska statsobligationer
-

 Nyheter1 vecka sedan
Septembers utdelning i XACT Norden Högutdelande
-

 Nyheter3 veckor sedan
Fastställd utdelning i MONTDIV augusti 2025
-

 Nyheter1 vecka sedan
HANetf kommenterar mötet mellan Kina, Ryssland och Nordkorea vid militärparad