Nyheter
Gold’s Old Ceiling or a New Floor?
Publicerad
7 år sedanden

Gold Comment ”Gold’s Old Ceiling or a New Floor?” by Joe Foster, Portfolio Manager/Strategist
Key Takeaways
- As the U.S. dollar strengthened, gold bullion declined in May while gold stocks saw little movement.
Signs of a late-cycle economy and geopolitical risks continue to mount with gold maintaining its resiliency while waiting for a market catalyst. - The price trend of gold indicates a new trading pattern in early ’19 with $1,365 per ounce as either the old ceiling or a new floor.
Gold Declines as U.S. Dollar Strengthened in May
Gold remained resilient in May, as the U.S. dollar strengthened considerably. The U.S. Dollar Index (DXY)1 gained 2.4% and closed the month at its highs for the year, driven by new fears of an Italian debt default and EU breakup. Populist parties from the left and right are attempting to form a coalition government that would likely drive Italy further into debt and to promote initiatives that would enable Italy to exit the euro. Italian President Sergio Mattarella blocked the coalition, which effectively suspended their plans. We expect to see the coalition make further attempts to gain power, which should keep the markets on edge for the foreseeable future.
As the DXY gained, the gold price fell to its low for the year of $1,282 per ounce on May 21. Gold subsequently advanced into month-end as the Italian situation rose to a boil, ending at $1,298.52 per ounce for a monthly decline of $16.83 (1.3%).
Gold Responds to Systemic Risks, Not Headlines
It seems that every time new, scary headlines emerge, press articles declare that gold no longer serves as a safe haven.2 The Italian political crisis is the latest case in point. The evolving situation in Italy is supportive of gold, as shown by its resilience against a strong move in the U.S. dollar. However, anyone expecting a big move from gold fails to understand the fundamentals of the gold market. Gold responds to genuine global systemic risks. These are risks that can have a negative financial impact on just about everyone personally and/or professionally, i.e., risks that bring excessive inflation or deflation, currency, debt, banking crises, or geopolitical events that impact trade and commerce. Localized risks that are the subject of most headlines do not elicit a strong response from gold.
Stock, bond, and currency markets reacted violently to the Italian news. However, the gold market remained calm, which tells us that, so far, this is not the systemic event that the headlines are implying. The chances of an EU breakup are still very small. The euro has survived Greece and Brexit. Gold price action indicates the EU will survive Italy as well. If the situation reaches global systemic proportions, we are sure there will be a strong response from the gold market. Until then, investors should be wary of the implications of the seemingly endless stream of scary headlines.
Gold can also have a different response locally that many American reporters ignore. In euro terms, gold gained €25.62 (2.4%) in May, making a new yearly high. Italians holding gold have a safe haven hedge.
Like gold, gold stocks saw little net movement in May, as the NYSE Arca Gold Miners Index (GDMNTR)3 advanced 0.2% and the MVIS Global Junior Gold Miners Index (MVGDXJTR)4 gained 0.3%.
Indications of Late-Cycle Economy Remain
Many indicators continue to tell us the economy is very late in the cycle. The current economic expansion is now the second longest on record, surpassed only by the tech boom of the 1990s. Convertible bond issuance by tech companies is on pace to challenge the levels last seen in 2000. The stock market is struggling to return to its highs, even though S&P 500 companies spent $158 billion buying back stock in the first quarter, a record pace according to a report from the S&P Dow Jones Indices. Delinquency rates for subprime auto loans have surpassed the levels of the global financial crisis. Financial regulation has come full cycle, as Congress passed a deregulation bill in May and the Fed advanced a proposal to ease the Volcker rule,5 both aimed at reducing crisis-era regulations. The Fed is tightening, but rates are still far below normal at this stage of the cycle. Accommodative monetary policies continue to promote asset price inflation. In May, the Rockefeller Collection auction surpassed all expectations, raising $832 billion, nearly doubling the previous record for a collection, which was set in 2009.
Economic down-cycles are normally a healthy and somewhat painful way of cleansing the economy of bad debts, dead beat companies, and crooks. The extraordinary risk facing the financial system is that central banks have little to no room to stimulate when the current cycle comes to an end. There is no capacity for fiscal stimulus either and sovereign debt service could become very problematic. Fiscally, the developed world is looking more like Italy all the time.
The $1,365 Question
The second half of 2018 should be very interesting for the gold market. The chart shows the gold price has formed a wedge or pennant pattern that has been in place for several years. The positive aspect of this pattern is the trend of higher lows. Fundamentally, gold has been resilient, gaining strength from escalating geopolitical risks and uncertainties. The negative aspect is the ceiling that has formed around $1,365. There has not been a strong catalyst to take gold to a new higher trend line. Investors have been frustrated by this range bound price action, while speculators have been put off by the decreasing volatility. The apex of the wedge occurs in early 2019; therefore, we believe it is inevitable that gold will begin to establish a new trading pattern by year end. Similar patterns can be seen in the GDM and MVGDXJ indices and the price of silver.
Gold Price Chart, 2013 – 2018
Source: Bloomberg. Data as of May 31, 2018. Past performance is not indicative of future results.
Without a second half catalyst, gold will probably drift sideways, falling below the lower trend line and further eroding confidence in the metal. However, in the second half of the year, we could see catalysts that may boost gold to a higher range that draws new attention from investors. To start, the geopolitical risks that have been supportive of gold are likely to continue – tensions in the Middle East and North Korea, and uncertainty surrounding Trump administration policies. With the economy firing on all cylinders and lofty commodities prices, an inflation surprise is possible. Mid-term elections in the U.S. may result in destabilizing shifts in power if the Democrats prevail. Leadership changes in Italy are set to bring added risks to European banks, sovereigns, and the euro. Last but not least, signs that the post-crisis expansion is nearing its end may emerge.
Gold tested the low end of its trading range in May. As gold has shown price weakness ahead of Fed rate increases, we expect gold to continue to drift around the bottom of the range until the expected rate increase on June 12. Futures positioning and flows into gold bullion exchange traded products suggest gold is poised for another post-Fed meeting rally. If gold retests $1,365 in the second half, will it again act as a ceiling or become a new floor? We wish we could know the answer to such questions.
IMPORTANT DISCLOSURE
*Please note that the information herein represents the opinion of the portfolio manager and these opinions may change at any time and from time to time. Not intended to be a forecast of future events, a guarantee of future results or investment advice. Historical performance is not indicative of future results; current data may differ from data quoted. Current market conditions may not continue. Non-VanEck proprietary information contained herein has been obtained from sources believed to be reliable, but not guaranteed. No part of this material may be reproduced in any form, or referred to in any other publication, without express written permission of VanEck. © 2018.
1U.S. Dollar Index (DXY) indicates the general international value of the U.S. dollar. The DXY does this by averaging the exchange rates between the U.S. dollar and six major world currencies: Euro, Japanese yen, Pound sterling, Canadian dollar, Swedish kroner, and Swiss franc.
2Safe haven is an investment that is expected to retain its value or even increase its value in times of market turbulence.
3NYSE Arca Gold Miners Index (GDMNTR) is a modified market capitalization-weighted index comprised of publicly traded companies involved primarily in the mining for gold.
4MVIS® Global Junior Gold Miners Index (MVGDXJTR) is a rules-based, modified market capitalization-weighted, float-adjusted index comprised of a global universe of publicly traded small- and medium-capitalization companies that generate at least 50% of their revenues from gold and/or silver mining, hold real property that has the potential to produce at least 50% of the company’s revenue from gold or silver mining when developed, or primarily invest in gold or silver.
5The Volcker Rule refers to a part of the Dodd–Frank Wall Street Reform and Consumer Protection Act, originally proposed by American economist and former United States Federal Reserve Chairman Paul Volcker to restrict United States banks from making certain kinds of speculative investments that do not benefit their customers.
by Joe Foster, Portfolio Manager and Strategist
With more than 30 years of gold industry experience, Foster began his gold career as a boots on the ground geologist, evaluating mining exploration and development projects. Foster is Portfolio Manager and Strategist for the Gold and Precious Metals strategy.
Please note that the information herein represents the opinion of the author and these opinions may change at any time and from time to time.
IMPORTANT DISCLOSURE
*All company weightings, if mentioned, are as of April 30, 2018, unless otherwise noted
1The Producer Price index (PPI) is a family of indexes that measures the average change in selling prices received by domestic producers of goods and services over time.
2The Consumer Price Index (CPI) is a measure that examines the weighted average of prices of a basket of consumer goods and services, such as transportation, food and medical care. It is calculated by taking price changes for each item in the predetermined basket of goods and averaging them.
3NYSE Arca Gold Miners Index (GDMNTR) is a modified market capitalization-weighted index comprised of publicly traded companies involved primarily in the mining for gold.
4MVIS® Global Junior Gold Miners Index (MVGDXJTR) is a rules-based, modified market capitalization-weighted, float-adjusted index comprised of a global universe of publicly traded small- and medium-capitalization companies that generate at least 50% of their revenues from gold and/or silver mining, hold real property that has the potential to produce at least 50% of the company’s revenue from gold or silver mining when developed, or primarily invest in gold or silver.
Important Disclosures
This commentary originates from VanEck Investments Limited (“VanEck”) and does not constitute an offer to sell or solicitation to buy any security.
VanEck’s opinions stated in this commentary may deviate from opinions presented by other VanEck departments or companies. Information and opinions in this commentary are based on VanEck’s analysis. Any forecasts and projections contained in the commentary appear from the named sources. All opinions in this commentary are, regardless of source, given in good faith, and may only be valid as of the stated date of this commentary and are subject to change without notice in subsequent versions of the commentary. Any projections, market outlooks or estimates in this material are forward-looking statements and are based upon certain assumptions that are solely the opinion of VanEck. Any projections, outlooks or assumptions should not be construed to be indicative of the actual events which will occur.
No investment advice
The commentary is intended only to provide general and preliminary information to investors and shall not be construed as the basis for any investment decision. This commentary has been prepared by VanEck as general information for private use of investors to whom the commentary has been distributed, but it is not intended as a personal recommendation of particular financial instruments or strategies and thus it does not provide individually tailored investment advice, and does not take into account the individual investor’s financial situation, existing holdings or liabilities, investment knowledge and experience, investment objective and horizon or risk profile and preferences. The investor must particularly ensure the suitability of an investment as regards his/her financial and fiscal situation and investment objectives. The investor bears the risk of losses in connection with an investment.
Before acting on any information in this publication or report, it is recommendable to consult one’s financial advisor.
Forecasts, estimates, and certain information contained herein are based upon proprietary research and the information contained in this material is not intended to be, nor should it be construed or used as investment, tax or legal advice, any recommendation, or an offer to sell, or a solicitation of any offer to buy, an interest in any security. References to specific securities and their issuers or sectors are for illustrative purposes only and are not intended and should not be interpreted as recommendations to purchase or sell such securities or gain exposure to such sectors.
Each investor shall make his/her own appraisal of the tax and other financial merits of his/her investment.
Sources
This commentary may be based on or contain information, such as opinions, recommendations, estimates, price targets and valuations which emanate from: VanEck portfolio managers, analysts or representatives, publicly available information, information from other units or Companies of VanEck, or other named sources.
To the extent this commentary is based on or contain information emerging from other sources (“Other Sources”) than VanEck (“External Information”), VanEck has deemed the Other Sources to be reliable but neither the VanEck companies, others associated or affiliated with said companies nor any other person, do guarantee the accuracy, adequacy or completeness of the External Information.
Limitation of liability
VanEck and its associated and affiliated companies assume no liability as regards to any investment, divestment or retention decision taken by the investor on the basis of this commentary. In no event will VanEck or other associated and affiliated companies be liable for direct, indirect or incidental, special or consequential damages resulting from the information in this publication or report.
Risk information
The risk of investing in certain financial instruments, is generally high, as their market value is exposed to a lot of different factors such as the operational and financial conditions of the relevant company, growth prospects, change in interest rates, the economic and political environment, foreign exchange rates, shifts in market sentiments etc. Where an investment or security is denominated in a different currency to the investor’s currency of reference, changes in rates of exchange may have an adverse effect on the value, price or income of or from that investment to the investor. Past performance is not a guide to future performance. Estimates of future performance are based on assumptions that may not be realized. When investing in individual shares, the investor may lose all or part of the investments.
Conflicts of interest
VanEck, its affiliates or staff of VanEck companies, may perform services for, solicit business from, hold long or short positions in, or otherwise be interested in the investments (including derivatives) of any company mentioned in this commentary.
To limit possible conflicts of interest and counter the abuse of inside knowledge, the representatives, portfolio managers and analysts of VanEck are subject to internal rules on sound ethical conduct, the management of inside information, handling of unpublished research material, contact with other units of VanEck and personal account dealing. The internal rules have been prepared in accordance with applicable legislation and relevant industry standards. The object of the internal rules is for example to ensure that no analyst will abuse or cause others to abuse confidential information. This commentary has been prepared following the VanEck Conflict of Interest Policy.
Distribution restriction
This commentary is not intended for, and must not be distributed to private customers.
No part of this material may be reproduced in full or in part in any form, or referred to in any other publication without express written permission of VanEck. ©2017, VanEck.
Index Descriptions
All indices named in the commentary are unmanaged indices and include the reinvestment of all dividends, but do not reflect the payment of transaction costs, advisory fees or expenses that are associated with an investment in the Fund. An index’s performance is not illustrative of the Fund’s performance. Indices are not securities in which investments can be made.
Du kanske gillar
-

Bitcoin + Gold: The power couple for smarter portfolios
-

Gold, Bitcoin, and Emerging Markets: Our Market Playbook
-


ETFmarknaden i Europa firar sitt 24-årsjubileum med tillgångar på två biljoner USD
-


GOLD ETC en börshandlad råvara utgiven av Boerse Stuttgart
-


GLDA ETC ger exponering mot fysiskt guld
-

Investing in Gold and Silver For Dummies

FTSE 100 är Storbritanniens största aktiemarknadsindex. Den spårar de 100 största brittiska företagen. FTSE 100-indexet väger sina beståndsdelar med fritt flytande marknadsvärde. ETF-investerare kan dra nytta av kursvinster och utdelningar av FTSE 100-beståndsdelarna. För närvarande spåras FTSE 100-indexet av elva olika börshandlade fonder för FTSE 100 som har årliga förvaltningsavgifter på mellan 0,07 och 0,20 procent per år.
Den billigaste börshandlade fonderna för FTSE 100
| Namn | Valuta | ISIN | Kortnamn | Avgift |
| HSBC FTSE 100 UCITS ETF GBP | GBP | IE00B42TW061 | H4ZB | 0,07% |
| iShares Core FTSE 100 UCITS ETF (Dist) | GBP | IE0005042456 | IUSZ | 0,07% |
| iShares Core FTSE 100 UCITS ETF GBP (Acc) | GBP | IE00B53HP851 | SXRW | 0,07% |
| Invesco FTSE 100 UCITS ETF | GBP | IE00B60SWT88 | S100 | 0,09% |
| Vanguard FTSE 100 UCITS ETF (GBP) Accumulating | GBP | IE00BFMXYP42 | VUKG | 0,09% |
| Vanguard FTSE 100 UCITS ETF Distributing | GBP | IE00B810Q511 | VUKE | 0,09% |
| Xtrackers FTSE 100 UCITS ETF 1C | GBP | LU0838780707 | XDUK | 0,09% |
| Xtrackers FTSE 100 UCITS ETF Income 1D | GBP | LU0292097234 | DBXX | 0,09% |
| Amundi FTSE 100 UCITS ETF Acc | GBP | LU1650492173 | L100 | 0,14% |
| Amundi FTSE 100 UCITS ETF Dist | GBP | LU1650492256 | 100D | 0,14% |
| UBS ETF (LU) FTSE 100 UCITS ETF (GBP) A-dis | GBP | LU0136242590 | UIM3 | 0,20% |
Olika index kan ge olika utveckling
Att olika index kan ge olika resultat är klart. Ett av de mest klassiska exemplen på detta är S&P 500 och Nasdaq-100 i USA. Båda två är så kallade benchmarks som ofta nämns i nyheterna, men de spårar olika saker.
När det gäller brittiska large caps så finns det ett enda index, FTSE 100. Den som överväger att investera i någon av dessa fonder har det således lätt.
Finns det sedan flera olika börshandlade fonder som täcker samma index eller segment är det förvaltningskostnaden som avgör. När det gäller FTSE 100 ETFer är skillnad relativt liten, mer korrekt 0,13 procent är skillnaden mellan den billigaste av dessa börshandlade fonder, HSBCs och iShares Core ETFer och den dyraste, UBS ETF (LU) FTSE 100 UCITS ETF (GBP) A-dis som UBS erbjuder.
Antar vi att dessa fonder ger samma avkastning kommer den som har lägst avgift att utvecklas bäst, allt annat lika. Grundregeln är alltså, betala aldrig för mycket då detta kommer att äta upp din avkastning.
Investera i FTSE 100 med hjälp av börshandlade fonder
Nedan har vi listat börshandlade fonder som spårar FTSE 100. Utöver dessa ETFer finns många andra typer av börshandlade fonder som valt att investera i Storbritannien.
För ytterligare information om respektive börshandlad fond klicka på kortnamnet för att se alla de artiklar som återfinns på denna sida som behandlar dessa ETFer.
En jämförelse mellan olika FTSE 100 ETFer
Förutom avkastning finns det ytterligare viktiga faktorer att tänka på när du väljer en FTSE 100 ETF. För att ge ett bra beslutsunderlag hittar du en lista över alla FTSE 100 ETFer med information om kostnad, vinstanvändning, fondens hemvist och replikeringsmetod.
| Emittent ISIN | Avgift % | Utdelningspolicy | Hemvist | Replikeringsmetod |
| iShares Core FTSE 100 UCITS ETF (Dist) IE0005042456 | 0,07% | Utdelande | Irland | Fysisk replikering |
| Vanguard FTSE 100 UCITS ETF Distributing IE00B810Q511 | 0,09% | Utdelande | Irland | Fysisk replikering |
| iShares Core FTSE 100 UCITS ETF GBP (Acc) IE00B53HP851 | 0,07% | Ackumulerande | Irland | Fysisk replikering |
| Vanguard FTSE 100 UCITS ETF (GBP) Accumulating IE00BFMXYP42 | 0,09% | Ackumulerande | Irland | Fysisk replikering |
| HSBC FTSE 100 UCITS ETF GBP IE00B42TW061 | 0,07% | Utdelande | Irland | Fysisk replikering |
| Amundi FTSE 100 UCITS ETF Acc LU1650492173 | 0,14% | Ackumulerande | Luxemburg | Ofinansierad swap |
| Amundi FTSE 100 UCITS ETF Dist LU1650492256 | 0,14% | Utdelande | Luxemburg | Ofinansierad swap |
| UBS ETF (LU) FTSE 100 UCITS ETF (GBP) A-dis LU0136242590 | 0,20% | Utdelande | Luxemburg | Fysisk replikering |
| Xtrackers FTSE 100 UCITS ETF Income 1D LU0292097234 | 0,09% | Utdelande | Luxemburg | Fysisk replikering |
| Xtrackers FTSE 100 UCITS ETF 1C LU0838780707 | 0,09% | Ackumulerande | Luxemburg | Fysisk replikering |
| Invesco FTSE 100 UCITS ETF IE00B60SWT88 | 0,09% | Ackumulerande | Irland | Ofinansierad swap |
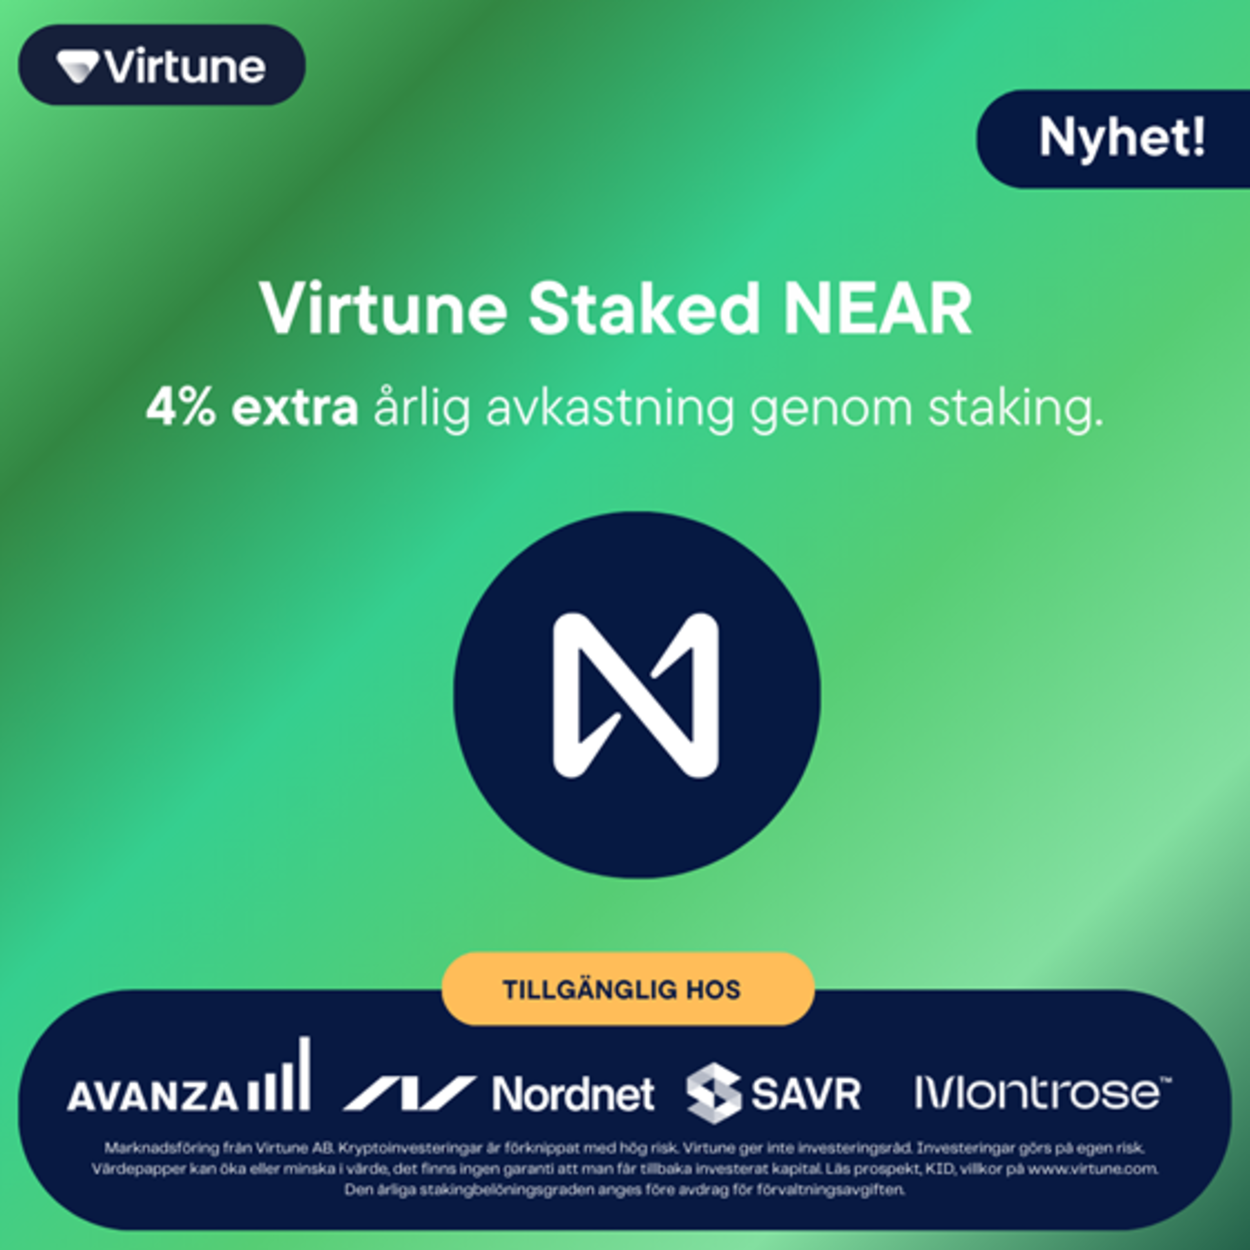
Virtune Staked NEAR ETP (VIRNEAR ETP) med ISIN SE0025837735, är en fysiskt ppubackad börshandlad produkt (ETP) som sömlöst kombinerar exponering mot NEAR med fördelarna av staking. Genom att inkludera staking möjliggör denna ETP för investerare att generera ytterligare avkastning på sin NEAR-investering. Detta möjliggörs genom en transparent och fysiskt backad struktur med institutionell säkerhetsnivå.
Varför välja ETP:er framför direkta kryptoinvesteringar?
Virtunes Börshandlade Produkter (ETPer) erbjuder ett säkert och reglerat sätt att få 1:1 exponering mot kryptotillgångar som NEAR, utan komplexiteten av direkt ägande. Med förenklad skatterapportering, förvaring med institutionell säkerhetsnivå, och handel genom din lokala nätmäklare eller bank, är ETP:er ett attraktivt alternativ för investerare som söker ett enkelt och säkert sätt att investera i kryptotillgångar.
Det enklaste sättet
Virtunes ETPer handlas direkt på reglerade börser lika enkelt som att handla en aktie via din nätmäklare eller bank, utan behov av digitala plånböcker, privata nycklar eller krypto-börser.
Skattefördelar
Investering i krypto genom ETPer förenklar ofta skatterapporteringen, eftersom de behandlas som traditionella värdepapper, vilket minskar komplexiteten att spåra enskilda krypto-transaktioner.
Alla dina investeringar samlade på en plats
Integrera dina krypto-investeringar enkelt i din traditionella portfölj. Detta förenklar analys, diversifiering och den övergripande hanteringen av dina investeringar, vilket ger dig mer kontroll och klarhet över din finansiella tillväxt.
Institutionell säkerhetsnivå
Virtunes ETPer är 100% fysiskt backade. Som en reglerad kapitalförvaltare inom krypto erbjuder Virtune en högre nivå av säkerhet och skydd jämfört med att hålla krypto direkt i personliga plånböcker.
Ytterligare investerarskydd
Virtune använder en Säkerhetsagent vars syfte är att skydda och representera investerarna i våra produkter. Kryptotillgångarna förvaras separat i cold storage (offline) hos Virtunes förvaringsinstitut Coinbase.
4%extra årlig avkastning genom staking
Med Virtune Staked NEAR, får du en extra årlig avkastning utöver NEARs egen utveckling. Den extra avkastningen genom staking tillförs och reflekteras i ETPens pris på daglig basis.
Virtune använder non-custodial staking, vilket innebär att Virtune stakar direkt från cold storage. Detta säkerställer att Virtune under inga omständigheter överför kryptotillgångar till en tredje part utanför Virtunes kontroll.
Exempel
Initial investering: 100 NEAR
Årlig stakingbelöning: 4%
Årlig avgift: 1,49%
Investering efter ett år: 102,51 NEAR
Ovanstående siffror är endast för illustrativa ändamål.
Tekniken som möjliggör framtidens AI
NEAR Protocol (NEAR) är en blockkedjeplattform med fokus på att möjliggöra AI-drivna lösningar. NEAR kombinerar användarvänliga utvecklingsverktyg med kraftfull infrastruktur för att stödja nästa generation av intelligenta applikationer.
Produktinformation
| Avgift | 1,49% |
| Bloomberg | VIRNEAR SS |
| ISIN | SE0025837735 |
| Emittent | Virtune AB (Publ) |
| WKN | A4APTM |
| Startdatum | 2025-08-18 |
Handla VIRNEAR ETP
Virtune Staked NEAR ETP (VIRNEAR ETP) är en europeisk börshandlad produkt som handlas på bland annat Nasdaq Stockholm.
Det betyder att det går att handla andelar i denna ETP genom de flesta svenska banker och Internetmäklare, till exempel Nordnet, SAVR, Levler, DEGIRO och Avanza.
Börsnoteringar
| Börs | Valuta | Kortnamn |
| Nasdaq Stockholm | SEK | VIRNEAR |
iShares $ Corp Bond ESG SRI UCITS ETF EUR Hedged (Acc) investerar i räntebärande företagsobligationer med investment grade-värde, denominerade i amerikanska dollar med en minsta återstående löptid på ett år. Obligationerna väljs ut enligt ESG-kriterier. Andelsklassen är valutasäkrad mot euron.
iShares Core UK Gilts UCITS ETF EUR Hedged (Acc) följer utvecklingen av investment grade-obligationer denominerade i brittiska pund. Andelsklassen är valutasäkrad mot euron.
iShares MSCI Europe Quality Dividend Advanced UCITS ETF EUR (Acc) ger exponering mot företag med högre direktavkastning och kvalitetsegenskaper från utvecklade europeiska marknader. Samtidigt strävar fonden efter att förbättra sin koldioxidreduktion och ESG-betyg jämfört med MSCI Europe Index.
iShares MSCI USA SRI UCITS ETF EUR Hedged (Acc) investerar i aktier i amerikanska företag med hjälp av en ESG-strategi i toppklass. Företag som är verksamma inom kontroversiella affärsområden eller bryter mot principerna i FN:s Global Compact är undantagna. Andelsklassen är valutasäkrad mot euron.
iShares € Govt Bond 0-1yr UCITS ETF EUR (Acc) investerar i eurodenominerade statsobligationer från eurozonens medlemsstater. Dessa har en återstående löptid på minst 0 till högst 12 månader. Obligationerna har en fast ränta och måste ha investment grade-status vid tidpunkten för inkludering i indexet.
’
| Namn | ISIN Kortnamn | Avgift | Utdelnings- policy |
| iShares $ Corp Bond ESG SRI UCITS ETF EUR Hedged (Acc) | IE000FZ1S3M3 CEMJ (EUR) | 0,17% | Ackumulerande |
| iShares Core UK Gilts UCITS ETF EUR Hedged (Acc) | IE000PYIUPH0 CEMM (EUR) | 0,09% | Ackumulerande |
| iShares MSCI Europe Quality Dividend Advanced UCITS ETF EUR (Acc) | IE000PYEKKW0 CEML (EUR) | 0,28% | Ackumulerande |
| iShares MSCI USA SRI UCITS ETF EUR Hedged (Acc) | IE000ATRYEA4 CEMI (EUR) | 0,23% | Ackumulerande |
| iShares € Govt Bond 0-1yr UCITS ETF EUR (Acc) | IE000WV38GP5 CEMK (EUR) | 0,09% | Ackumulerande |
Produktutbudet inom Deutsche Börses ETF- och ETP-segment omfattar för närvarande totalt 2 525 ETFer, 203 ETCer och 278 ETNer. Med detta urval och en genomsnittlig månatlig handelsvolym på cirka 25 miljarder euro är Xetra den ledande handelsplatsen för ETFer och ETPer i Europa.

De bästa börshandlade fonderna för FTSE 100

VIRNEAR ETP spårar kryptovalutan NEAR

Fem nya ETFer från iShares på Xetra

JGVE ETF köper statsobligationer som hedgas i Euro

Utdelningar och försvarsfonder lockade i augusti

ETFer som ger exponering mot börsintroduktioner

Månadsutdelande ETFer uppdaterad med två börshandlade fonder från AXA

Bitcoin likes to dance to its own beat, not to tech stock tunes

TMX VettaFis Jane Edmondson om nya försvars-ETFer

HANetfs VD kommenterar Trump-Putin-toppmötet
Populära
-

 Nyheter4 veckor sedan
ETFer som ger exponering mot börsintroduktioner
-

 Nyheter4 veckor sedan
Månadsutdelande ETFer uppdaterad med två börshandlade fonder från AXA
-
 Nyheter4 veckor sedan
Bitcoin likes to dance to its own beat, not to tech stock tunes
-

 Nyheter4 veckor sedan
TMX VettaFis Jane Edmondson om nya försvars-ETFer
-
 Nyheter2 veckor sedan
HANetfs VD kommenterar Trump-Putin-toppmötet
-

 Nyheter4 veckor sedan
BJLX ETF hållbara företagsobligationer med förfall 2032
-
 Nyheter4 veckor sedan
IncomeShares strategiuppdatering: Kontantsäkrad säljoptioner plus aktie
-

 Nyheter4 veckor sedan
BJLW ETF köper eurodenominerade företagsobligationer med förfall 2029


