
Nyheter
Energy Wars, The Fight for Market Share

Energy Wars, The Fight for Market Share While the glut in global oil supply had initially driven oil prices down 60% to a 6-year low in March 2015, prices have rebounded more than 30% since.
Although oil demand has surprised to the upside, we believe that the market is overly optimistic about supply tightening. The incentive for producers to reduce oil output diminishes the longer oil prices remain high.
We believe that there is potential for a short-term correction in prices, providing investors a more attractive entry point in the near future.
After high-cost producers actually respond to the weaker prices and cut production, we see the oil prices rebounding again in Q4 2015 and beyond.
OPEC will continue to rebuild the market share that it has lost to high producers in the era of $100+/bbl oil.
The US shale industry is unlikely to be the main casualty from the fight for market share. Being a more nimble, price responsive industry with significantly lower lead times than conventional oil, US shale is likely to continue to be a growth industry in the long term. We believe that high cost conventional players will become the main losers from the current price war.
OPEC plays the long game
As widely expected, OPEC maintained the status quo, keeping its production ceiling at 3o million barrels a day at its June 5th meeting. In sharp contrast to its November 2014 meeting, when the market was expecting a cut that was not delivered, oil prices increased after the meeting. OPEC had cited the increase in demand as a reason for maintaining current production levels and the market took that as a bullish sign.
However, we would caution that the rise in demand has been driven by bargain hunting that will fade as prices increase. China’s filling of strategic reserves is likely to continue this year, but will not be a permanent source of new demand once the new storage capacity has been exhausted.

Market share in context
It is useful to put the fight for market share into context. In “Energy Wars – the battle of technologies” (March 2015) we wrote about the disruptive force of fracking in the US that has usurped lower-cost incumbents from their prior position of dominance in global oil production.
It is clear from the chart opposite that market share has never been static. In 1985 for example US production of oil was considerably larger than Saudi Arabian production. OPEC in aggregate was producing less than a third of global production.
However, by 2005, US production was reduced to less than 9% of global production while Saudi Arabian production accelerated to over 13%. Russian production also declined to under 12% of global from close to 19% in 1985. OPEC production grew to over 40% of global production.
By 2014, US production rebounded to over 13% of the global total, taking market share from a loss in other OECD countries. Meanwhile OPEC had only given up 1.5% of its global share between 2005 and 2014.

If the US maintained the sharp increase in oil production that it has seen over the past few years (see chart below), it would only be a matter of time before the US would take a more significant share of global production away from OPEC. The US had already overtaken Saudi Arabia in 2014.
With US shale oil production being more costly than conventional oil production from most OPEC countries, it is unsurprising that OPEC no longer wants to support a price of US$100/bbl, just to see its market share erode by the US and other high-cost producers. OPEC declared war on market share in its November 2014 meeting and followed through by maintaining an elevated production celling in its June 2015 meeting.

It is also clear that the US has only a small fraction of the world’s proved reserves of oil (see next page). Collectively, OPEC has more than 70% of the wold’s proved oil reserves, but only produces just over 40% of global oil output. This imbalance would deteriorate even more if high cost producers including the US continue to raise production. It is therefore unsurprising that OPEC seeks to increase its output to a level that is commensurate with its reserves.

OPEC production continues to increase
Despite OPEC setting it ceiling at 30 million barrels per day, in reality, it produces far more than this. OPEC output is currently more than 31 million barrels per day according to their official statistics. With oil prices significantly lower than the US$100/bbl mark of last year, individual OPEC members are forced to produce and sell more to make up for lost revenue. Individual countries are likely to produce as much as they can without care for the overall ceiling or their own quota. While Saudi Arabia’s oil minister described the last OPEC meeting as “surprisingly amicable” we believe that discord between members is rife. The smaller OPEC members are calling for production cuts, but the Saudi-led GCC block believes it will bear the brunt of the loss in market share as smaller countries produce more.
Although the financial position of OPEC members such as Nigeria and Venezuela remains precarious, Saudi Arabia with next to no sovereign debts to its name can afford to run budget deficits and play the long game.
Potential easing of international sanctions against Iran could increase supply from OPEC even more. Iran is unlikely to heed to production quotas set by OPEC as it desperately tries to rebuild the market share it has lost. Indeed Iraq is not even set an OPEC quota.

Production elsewhere remains elevated
While US rigs have been shut off at an unprecedented rate, actual US output has continued to increase. That reflects the fact that the most inefficient rigs were the first to be switched off and remaining rigs have been moved to more easily accessible oil.

Eventually the reduction in US rigs should lead to lower production in the US. As the productivity of a well can fall by as much as a half after the first year of production, a lack of new investment is likely to translate into lower production. Elsewhere, the evidence of supply tightening is limited. Global output of oil has only just started to level out. High cost producers outside of the US mainly extract conventional oil which has long lead times. They take a long time to both open and shut production and therefore cannot be as responsive to price changes as the US shale oil producers.

Global CAPEX to decline
About US$100bn of CAPEX cuts have been announced across the industry. That will see projects, particularly deep-water and capital intensive ones getting deferred and even cancelled, helping to tighten the market.
However, we believe the market has reacted too early to this prospect of this tightening. The premature gains in price could stifle the progress in cutting supply. The common belief across the industry that “somebody else will cut while I continue to invest and expand” obviously has its limitations.
Also it is unclear how much of the US$100bn cuts in CAPEX relates specifically to oil production as opposed to gas production or even oil projects that have not even been sanctioned yet.
Demand driving the recent gains in price
Most of the gains in oil price since the last OPEC meeting seem to stem from optimistic demand projections. Both the OPEC and International Energy Agency have raised their demand forecasts. However, if consumer demand is indeed that sensitive to falling prices, it will equally be sensitive to rising prices. Once again, a premature increase in price could choke off some demand.

Chinese strategic petroleum reserves
After coming close to filling its reserves earlier in the year, China is building new storage. That will act as a tailwind for demand. However, that source of demand cannot be sustained indefinitely and tightening supply will be needed to achieve a global balance.

A political premium in oil
With approximately 4% of global oil supplies going through the Bab el Mandab choke point near Yemen, the Saudi Arabia-led airstrikes on Yeman pose a risk to oil reaching its intended destination. The conflict is showing no signs of respite, with 31 people killed last week by the Royal Saudi Air Force, bringing the UN’s estimate of civilian deaths to 1,412 since March. Some of the gains in price since March, when the conflict started, reflect the political premium that the war poses. Easing or aggravation of the conflict could drive the political premium lower or higher.
The penetration of ISIS into Iraq and the progress in international negotiations with Iran’s are also likely to change the political premium and dictate volatility in crude oil prices.

Price outlook: dip and then rise
We believe the optimism in supply tightening will be dialed back until we actually see supply making a material cutback. That will see prices dip initially. That price dip will be important in maintaining the current pace of demand recovery. China will continue to fill its new strategic reserves, providing a tail wind to oil demand.
Over the past month, net speculative long positioning in Brent futures contracts has contracted by 44% as investors have curbed their expectations for price gains.

Once CAPEX declines start to bite into production levels we believe that prices will stage a recovery. That decline in production will be borne by high cost producers, such as deepwater operations and other capital intensive projects.
We believe that Brent and WTI could decline to US$60/bbl and US$55/bbl respectively, before recovering to US$75/bbl and US$70/bbl in 2016.
Market share outlook:
OPEC will continue to produce more oil and pursue a strategy of building market share. OPEC’s market share could rise to 45% from 42% currently, especially if sanctions against Iran are lifted.
Despite the decline in US rig counts we don’t expect US shale oil production to materially decline over a sustained period. Those rigs are relatively easy to switch back on and when other high cost producers have cut back, the nimble US shale oil industry will be able to take advantage of better pricing. The number of oil wells that have been drilled but not yet bought into production have soared. According to IHS there are approximately 1,400 drilled but uncompleted wells (DUCs) in the Eagle Ford in south Texas (as of April 2015). Of these uncompleted wells, approximately 40% could be economical (i.e. break-even) at prices below US$30/bbl according to IHS. Assuming 50 wells per month can be completed from the DUCs, we could see an additional 123,000 barrels of oil per day produced by the end of the year. Wood Mackenzie estimate the number of DUCs across the US stood at 3,000 (March 2015). In short, the potential for production from the US to ramp up quickly is tremendous. We do not believe the US will be a casualty in terms of market share from the current price war – it will be other high cost producers.
Important Information
This communication has been provided by ETF Securities (UK) Limited (“ETFS UK”) which is authorised and regulated by the United Kingdom Financial Conduct Authority (the “FCA”).


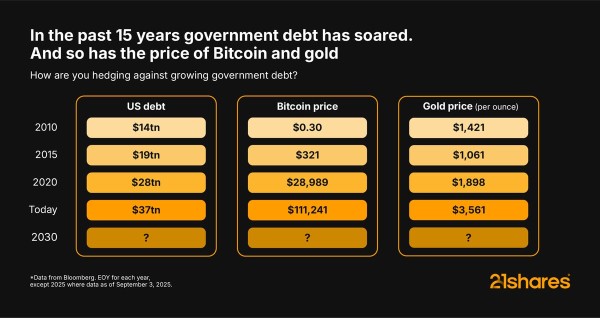
Amid soaring US debt and Gold’s steady gains, Bitcoin has continued to deliver strong returns over the past 15 years. Its scarcity and decentralization make it a hedge that investors can’t ignore, providing new ways to pursue growth, security, and opportunity in an evolving financial landscape.

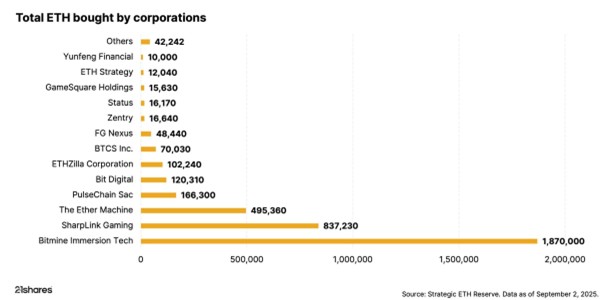
Investors can’t ignore the corporate world’s big bet on Ethereum
Ethereum is stealing the spotlight, as public companies have accumulated over 4.4 million ETH, worth nearly $19 billion, in the past few months. This treasury boom is outpacing Bitcoin’s early adoption and redefining how Wall Street approaches digital assets.


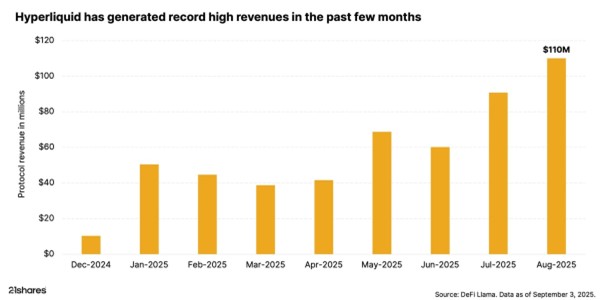
The rise of Hyperliquid: DeFi’s record-breaking powerhouse
Hyperliquid is making waves in DeFi perpetuals by setting new records, leading trading volumes, and propelling its token to all-time highs. Backed by market volatility, high-performance infrastructure, and concentrated liquidity, the platform continues to draw investors and assert its market dominance.

Research Newsletter
Each week the 21Shares Research team will publish our data-driven insights into the crypto asset world through this newsletter. Please direct any comments, questions, and words of feedback to research@21shares.com
Disclaimer
The information provided does not constitute a prospectus or other offering material and does not contain or constitute an offer to sell or a solicitation of any offer to buy securities in any jurisdiction. Some of the information published herein may contain forward-looking statements. Readers are cautioned that any such forward-looking statements are not guarantees of future performance and involve risks and uncertainties and that actual results may differ materially from those in the forward-looking statements as a result of various factors. The information contained herein may not be considered as economic, legal, tax or other advice and users are cautioned to base investment decisions or other decisions solely on the content hereof.


IncomeShares passed three milestones in August. Assets under management climbed to almost $66 million, cumulative fund flows topped $72 million, and turnover across London and Xetra listings reached over $27 million. Palantir paid the highest annualised distribution yield at 57.11%. The sections below break the numbers down in more detail.
Cumulative fund flows
Fund flows track how much money investors put into or take out of IncomeShares ETPs (exchange-traded products). Positive flows mean more money coming in than going out – a sign of demand for the products.
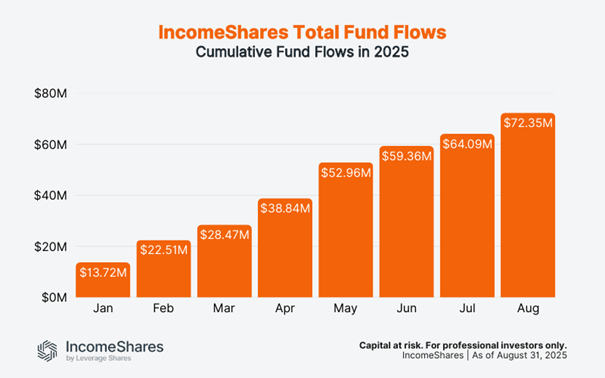
Flows have risen every month this year. In January, they stood at $13.7 million. By the end of August, they reached $72.4 million. That’s over $8 million of new money added in August alone – the biggest increase since May.
Trading turnover
Turnover is the total dollar value of IncomeShares ETPs bought and sold on the exchanges. Higher turnover means more activity and liquidity for investors.
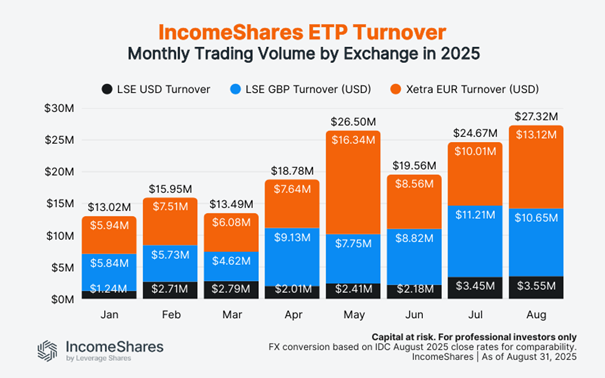
Turnover reached $27.3 million in August – the highest on record and more than double January’s $13.0 million. London listings (USD and GBP combined) made up $14.2 million, with Xetra listings close behind at $13.1 million. Both exchanges have seen steady increases through 2025, showing rising interest in income options strategies across the board.
Note: Figures use IDC FX rates as of the August month-end to convert GBP and EUR into USD. We apply the same August rates to all prior months to compare turnover on a like-for-like basis.
Assets under management (AUM)
AUM is the total value of assets held across all IncomeShares ETPs. It grows when new investors buy in, or when the underlying assets rise in value.
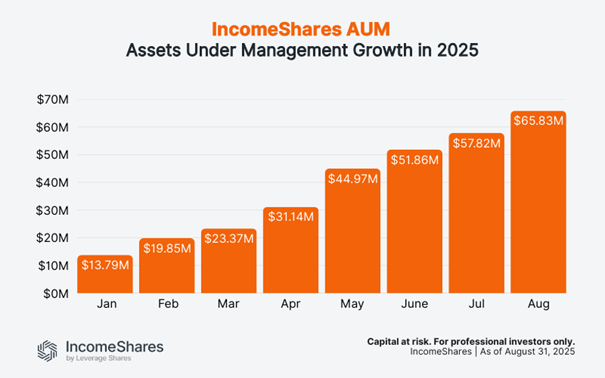
AUM grew from $13.8 million in January to $65.8 million at the end of August. It was also $8 million more than in July. Steady inflows and consistent income distributions are helping the product range build scale.
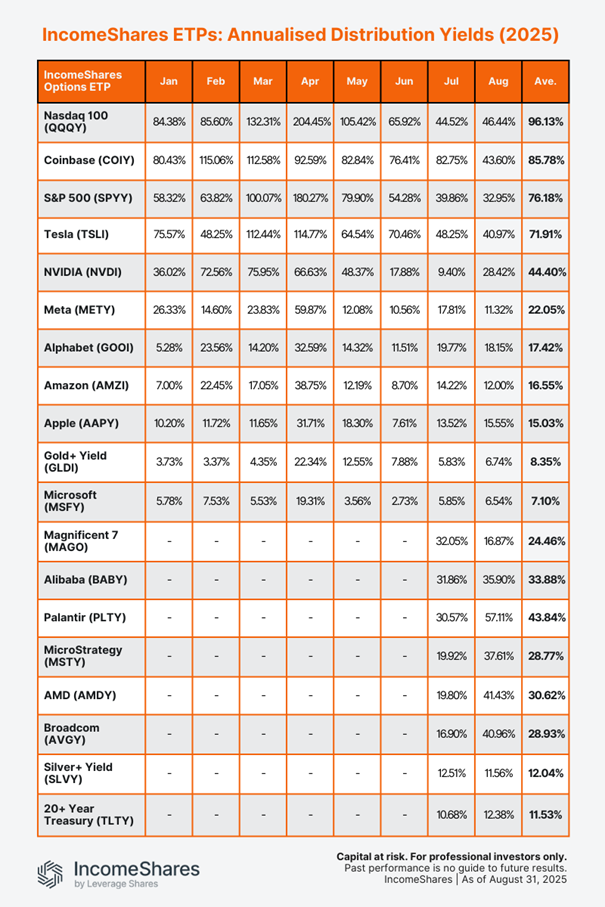
Distribution yields
Distribution yields represent the annualised income paid to investors as a percentage of the current NAV (net asset value), based on the latest month’s yield. IncomeShares ETPs aim to generate this income from selling options. Yields change each month depending on strategy performance and market volatility.
Annualised August yields (ranked highest to lowest):
• Palantir Options ETP (PLTY): 57.11%
• Nasdaq 100 Options ETP (QQQY): 46.44%
• Coinbase Options ETP (COIY): 43.60%
• AMD Options ETP (AMDY): 41.43%
• Tesla Options ETP (TSLI): 40.97%
• Broadcom Options ETP (AVGY): 40.96%
• MicroStrategy Options ETP (MSTY): 37.61%
• Alibaba Options ETP (BABY): 35.90%
• S&P 500 Options ETP (SPYY): 32.95%
• NVIDIA Options ETP (NVDI): 28.42%
• Alphabet Options ETP (GOOI): 18.15%
• Magnificent 7 Options ETP (MAGO): 16.87%
• Apple Options ETP (AAPPY): 15.55%
• 20+ Year Treasury Options ETP (TLTY): 12.38%
• Amazon Options ETP (AMZI): 12.00%
• Silver+ Yield Options ETP (SLVY): 11.56%
• Meta Options ETP (METY): 11.32%
• Gold+ Yield Options ETP (GLDI): 6.74%
• Microsoft Options ETP (MSFY): 6.54%
Our Palantir ETP topped the list with an annualised yield of 57.11% for August, up from 30.57% in July. The stock was volatile in August, trading between $142 and $190. That wider range increased option premiums, which boosted the ETP’s yield. The ETP sells put options on Palantir stock and holds shares – the strategy used for all our single stock ETPs and the Magnificent 7 product.
The Nasdaq 100 ETP paid an annualised yield of 46.44% in August, up slightly from 44.52% in July. At the other end, Gold+ and Microsoft stayed below 7%, reflecting relatively calmer conditions in their underlying assets.
The table below shows the annalised distribution yields for all IncomeShares ETPs so far this year. Note that the bottom eight ETPs launched in late June, so they only have yields for July and August.
Key takeaways
• Fund flows climbed to $72.4 million, with August adding more than $8 million.
• Turnover hit a record $27.3 million, split almost evenly between London and Xetra.
• Palantir topped the yield table at 57%, with Nasdaq 100 and Coinbase also paying above 40%.

Concerned about rising government debt? Bitcoin’s got you covered

N100 ETF följer det amerikanska Nasdaq 100 indexet

IncomeShares Monthly Investor Update – August 2025

CHSJ ETF investerar i CLO-obligationer

HYPE ETP ger exponering mot Hyperliquid

VALOUR ARB SEK spårar priset på kryptovalutan Arbitrum

Månadsutdelande ETFer uppdaterad med IncomeShares produkter

Utdelningar och försvarsfonder lockade i augusti

HANetfs analyserar hur ett fredsavtal kan påverka det europeiska försvaret

De bästa innovations-ETFerna
-
 Nyheter4 veckor sedan
VALOUR ARB SEK spårar priset på kryptovalutan Arbitrum
-
 Nyheter2 veckor sedan
Månadsutdelande ETFer uppdaterad med IncomeShares produkter
-
 Nyheter1 vecka sedan
Utdelningar och försvarsfonder lockade i augusti
-
 Nyheter2 veckor sedan
HANetfs analyserar hur ett fredsavtal kan påverka det europeiska försvaret
-
 Nyheter4 veckor sedan
De bästa innovations-ETFerna
-

 Nyheter3 veckor sedan
HANetfs VD kommenterar Trump-Putin-toppmötet
-

 Nyheter2 veckor sedan
ADLT ETF investerar bara i riktigt långa amerikanska statsobligationer
-

 Nyheter4 veckor sedan
IncomeShares når 60 miljoner dollar i förvaltat kapital – Tillväxtöversikt 2025