
Nyheter
Crude rally leads investors to take profit


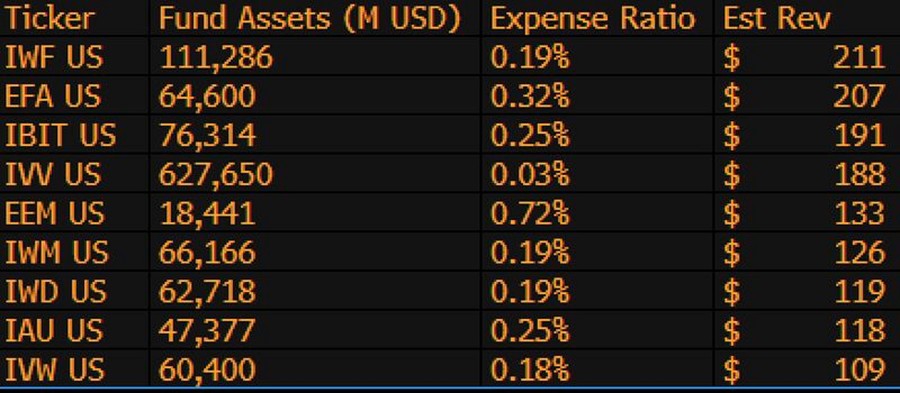
BlackRocks spot Bitcoin ETF (IBIT) genererar nu ~187,2 miljoner dollar i årliga avgifter, enligt Bloomberg. Det är mer än de ~187,1 miljoner dollar i årliga avgifter som deras Core S&P 500 ETF (IVV) drar in, trots att IVV är nästan 9 gånger större, med 624 miljarder dollar i tillgångar jämfört med IBITs 75 miljarder dollar.
Med en kostnadskvot på 0,25 % har IBIT mycket snabbt blivit en seriös inkomstkälla för världens största kapitalförvaltare.
IBIT är nu den tredje mest intäktsgenererande ETFen för BlackRock som har mer än 1 000 ETFer, och är bara 9 miljarder dollar ifrån (och ett praktiskt taget hinder) att vara nummer 1. Bara ännu en galen statistik för en 1,5 år gammal ETF. Här är topp 10-listan för Blackrock/iShares.


Why are major institutions looking to Solana for stablecoin issuance in Europe?

BlackRocks Bitcoin ETF genererar nu mer intäkter än deras S&P 500 ETF

Hur investerar jag i amerikanska småbolag med en ETF?

EMEE ETF är en aktivt förvaltad ETF med fokus på emerging markets

HANetf utökar sitt utbud av försvars-ETFer med fokus på Indo-Stillahavsområdet’

De bästa ETFer som investerar i europeiska utdelningsaktier

YieldMax® lanserar sin andra produkt för europeiska investerare

Big News for Nuclear Energy—What It Means for Investors

Svenska investerare — 21Shares Nasdaq Stockholm-sortiment har just blivit starkare

3EDS ETN ger tre gånger den negativa avkastningen på flyg- och försvarsindustrin
-
 Nyheter2 veckor sedan
De bästa ETFer som investerar i europeiska utdelningsaktier
-
 Nyheter3 veckor sedan
YieldMax® lanserar sin andra produkt för europeiska investerare
-
 Nyheter3 veckor sedan
Big News for Nuclear Energy—What It Means for Investors
-
 Nyheter2 veckor sedan
Svenska investerare — 21Shares Nasdaq Stockholm-sortiment har just blivit starkare
-
 Nyheter3 veckor sedan
3EDS ETN ger tre gånger den negativa avkastningen på flyg- och försvarsindustrin
-
 Nyheter2 veckor sedan
Nordea Asset Management lanserar nya ETFer på Xetra
-

 Nyheter4 veckor sedan
HANetfs VD Hector McNeil kommenterar FCAs kryptonyheter
-
 Nyheter1 vecka sedan
12 000 artiklar om börshandlade fonder