
Nyheter
Commodities end volatile week only slightly down
Commodity ETP Weekly – Commodities end volatile week only slightly down
- Inflows into oil ETPs reach highest level since March 2015 as investors bet on unsustainably low prices.
- Physical gold receives highest inflows since August 2015 as investors hedge against market malaise.
- Industrial metal basket ETPs see highest outflows since July 2015.
Download the complete report (.pdf)
Highlights
- After a violent crash in cyclical commodities and other risk assets, prices started to recover in the second half of the week.
- In contrast to the futures market, ETP investors have been contrarian and have built long positions, particularly in oil.
- Market malaise has maintained strong interest in gold as a haven asset.

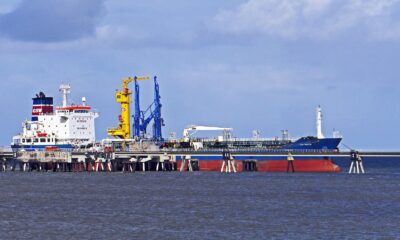
Inflows into oil ETPs reach highest level since March 2015 as investors bet on unsustainably low prices. By Wednesday last week, WTI and Brent were down 28.3% and 25.2% YTD respectively. Such low prices were clearly unsustainable and investors bought US$97.0mn of long oil ETPs and divested US$26.6mn of short oil ETPs to take advantage of a rebound. On Thursday WTI and Brent rebounded 11% and 5%, respectively. One of the catalysts behind the sharp decline in oil prices was news that sanctions on Iran will be lifted, paving the way for Iran to increase its oil exports. Unfortunately Iran has been guiding the market to think that it can raise exports by 1.1mn barrels, whereas in reality, we believe at most it will increase exports by 300,00o barrels. Even factoring in a generous rise in Iranian oil, the market would be in a supply deficit at end-2016 if demand increases to 96.71 mb/d by Q4 2016 from 95.28mb/d in Q4 2015, as the IEA predicts. We believe prices will end the year between the marginal cost of $40 and the fiscal break even cost $70 per barrel.
Physical gold receives highest inflows since August 2015 as investors hedge against market malaise. Gold has traditionally been the first port of call in times of market stress. While most people cannot understand why cyclical assets fell so hard so fast, many realised that gold performs well in times of panic and went long the yellow metal while waiting for an entry point back into other cyclicals. Gold rose 0.7% last week, 3.4% YTD. Inflows into physical gold ETPs rose to US$85.3mn.
Industrial metal basket ETPs see highest outflows since July 2015. Investor panic saw US$8.9mn redemptions from industrial metal baskets. That came even though most industrial metal prices were only marginally down by mid-week and ended the week higher after Chinese GDP data confirmed strong demand from the largest consumer of metals. Both long and short copper ETPs saw outflows of US$2.7mn and US$1.5mn respectively, highlighting polarised views on the metal. The International Copper Study Group forecasts a supply deficit of 0.5% this year, which will be the 6th consecutive year of a supply shortfall. We don’t think that the market can continue to ignore the increasing tightness in the metal and prices are likely to recover after having fallen 23.6% in the past year.
Key events to watch this week. The market will be keenly tuned into the Fed’s post-policy meeting statement and press conference to hear how the US central bank will react to the recent market volatility. The ECB has already hinted that it will offer more QE, but we expect the Fed to hold steady with its announced policy trajectory of continuing to increase rates to ward off inflationary pressures and keep a buoyant labour market in-check. Currently the market is only pricing in one rate increase this year, while the Fed has indicated it will move four times. We expect US dollar strength, which has been weighting on commodity market performance, to fall away when the market gets in line with Fed thinking. The BoJ and RBNZ will also host their policy meetings this week.
Video Presentation
Nitesh Shah, Research Analyst at ETF Securities provides an analysis of last week’s performance, flow and trading activity in commodity exchange traded products and a look at the week ahead.
For more information contact
ETF Securities Research team
ETF Securities (UK) Limited
T +44 (0) 207 448 4336
E info@etfsecurities.com
Important Information
General
This communication has been provided by ETF Securities (UK) Limited (”ETFS UK”) which is authorised and regulated by the United Kingdom Financial Conduct Authority.


Nyheter
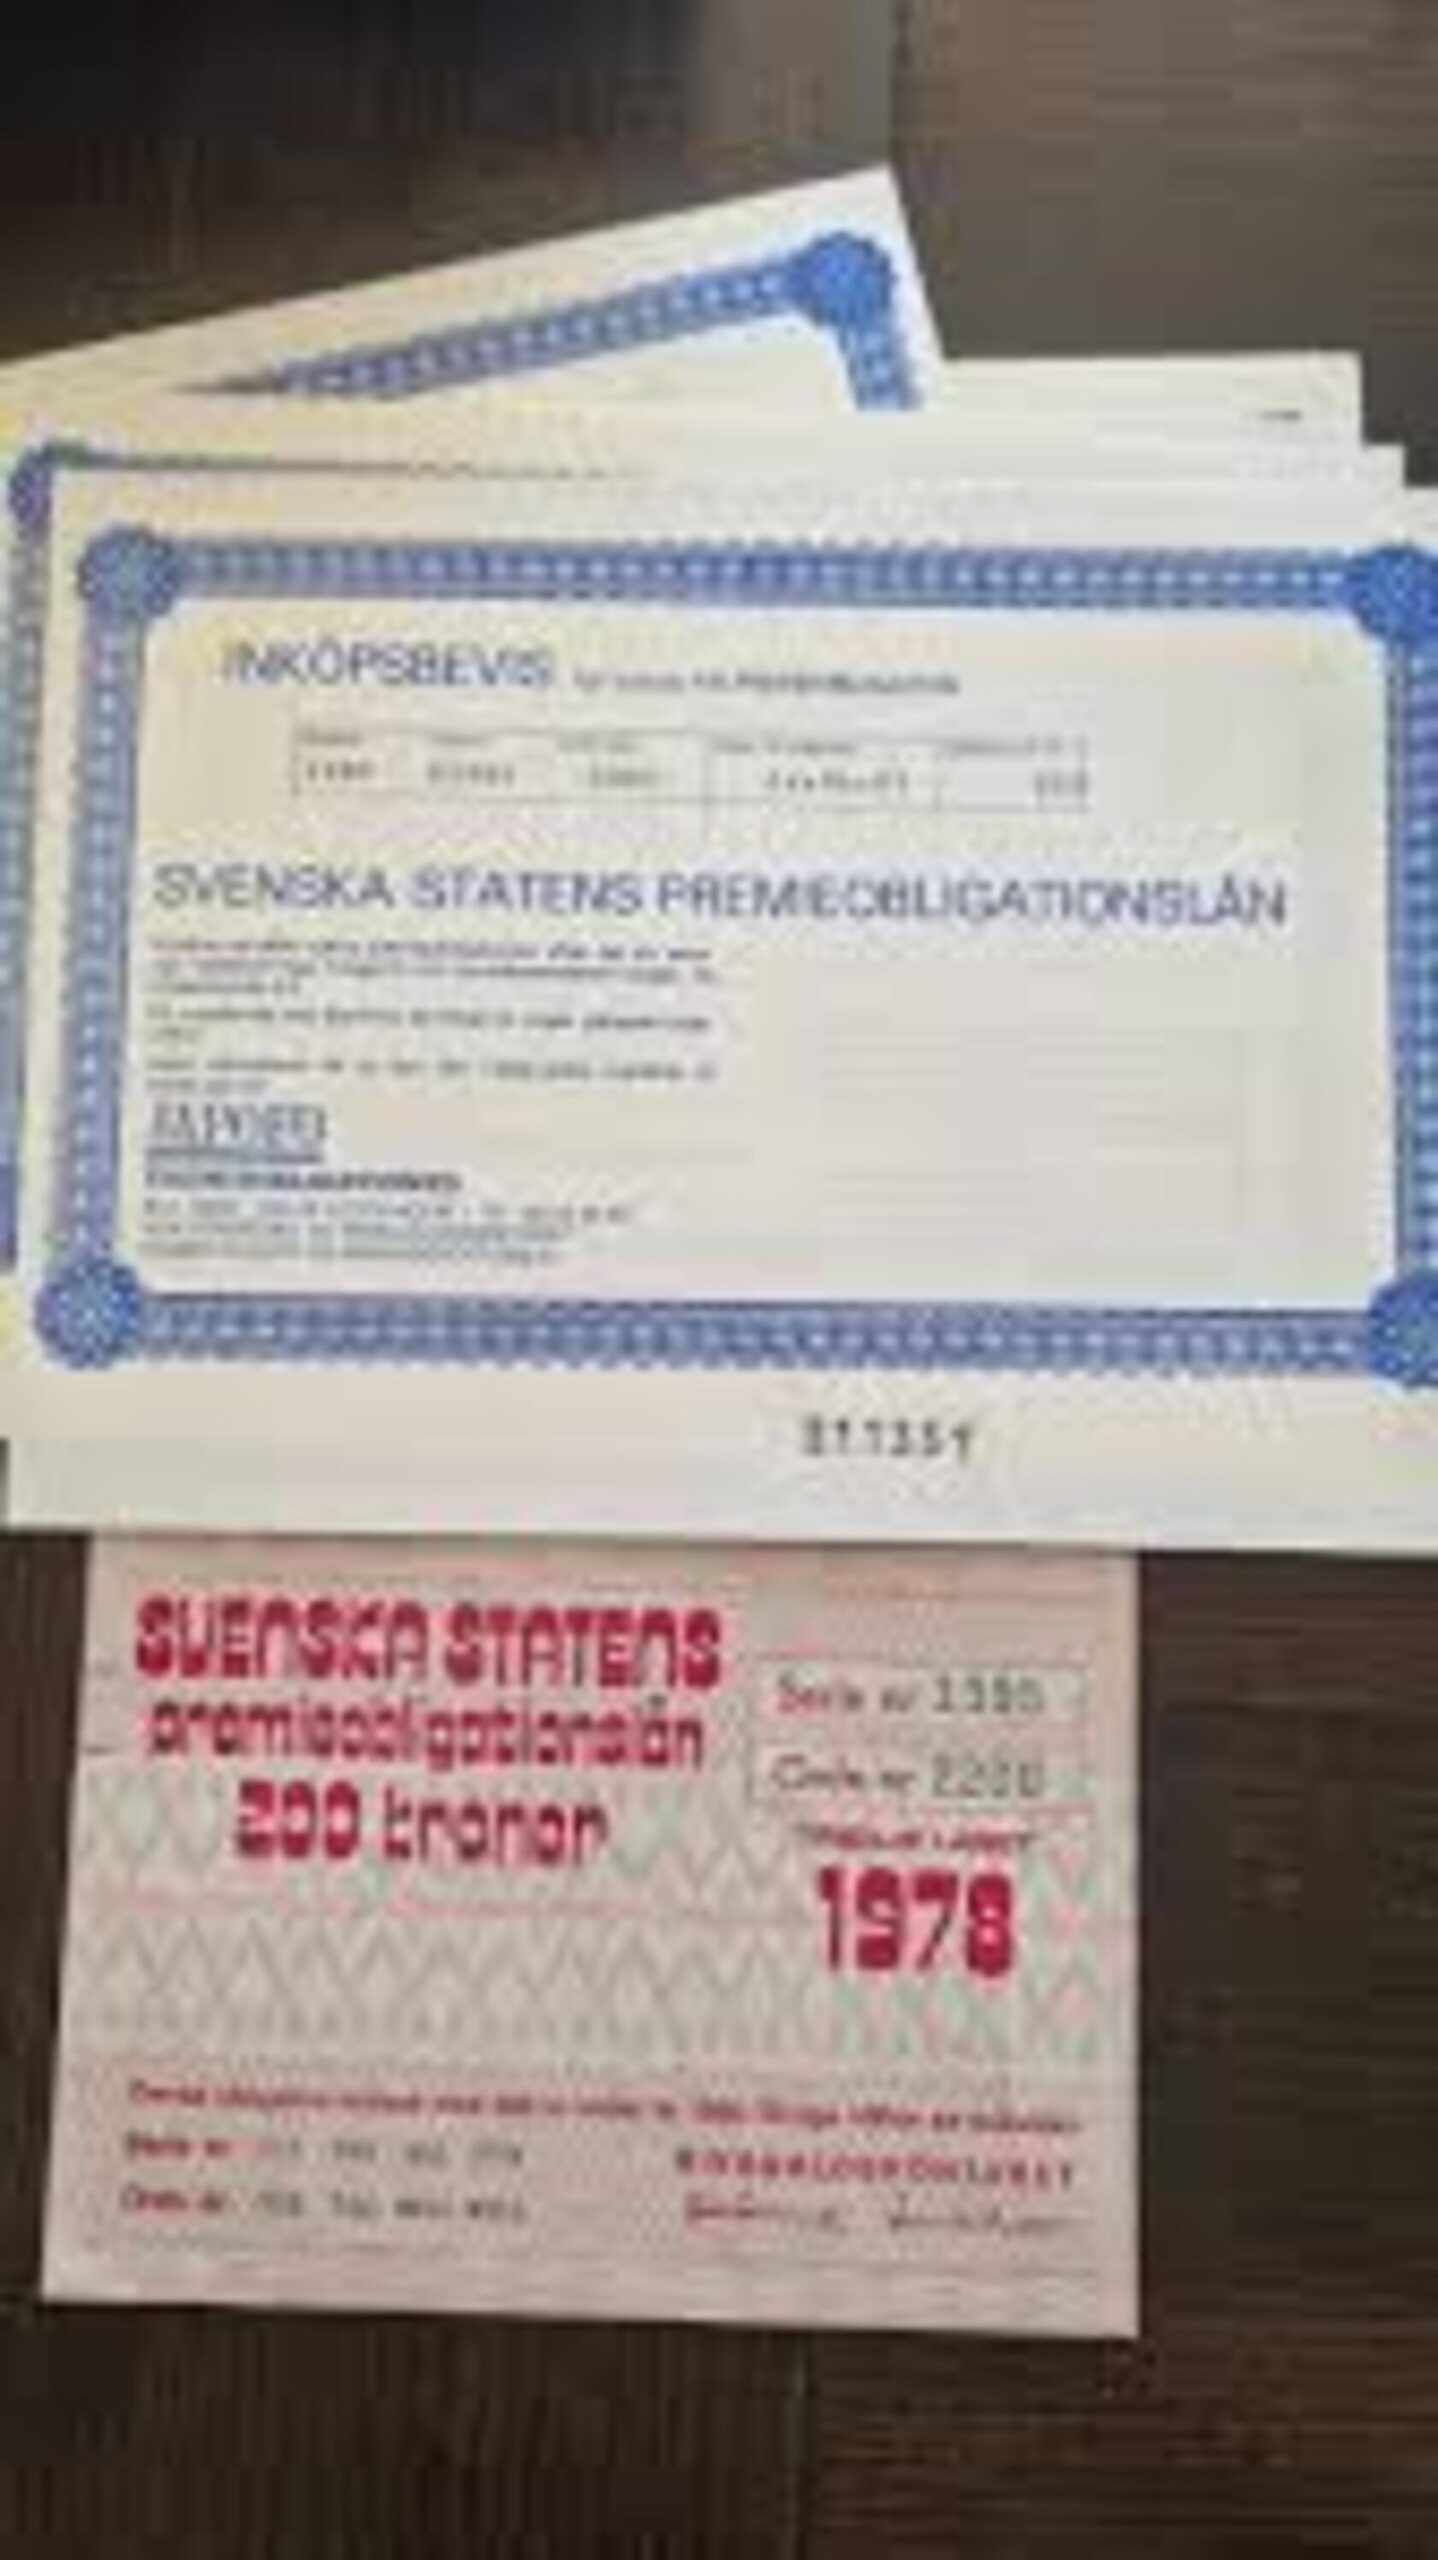
När staten bjöd på vinstchans: Historien om premieobligationen – och hur konceptet lever vidare globalt


HEQQ ETF mål är att ge långsiktig kapitaltillväxt

När staten bjöd på vinstchans: Historien om premieobligationen – och hur konceptet lever vidare globalt

OTUS ETF ger exponering mot en portfölj av globala aktier

Defiance utökar sitt europeiska utbud med lanseringen av Europas första minnes-ETF

KBOT ETF investerar i humanoida robotar

USA satsar 2 miljarder dollar på kvantdatorer – så kan investerare dra nytta av utvecklingen

Extrema skillnader: Varför presterar Europas kvantdator-ETFer så olika?

QQCC ETF följer företag världen över som är aktiva inom kvantberäkning

Fastställd utdelning i MONTDIV maj 2026

Varför Plus500 är en dröm för finans-affiliate
-
 Nyheter4 veckor sedan
USA satsar 2 miljarder dollar på kvantdatorer – så kan investerare dra nytta av utvecklingen
-
 Nyheter3 veckor sedan
Extrema skillnader: Varför presterar Europas kvantdator-ETFer så olika?
-
 Nyheter3 veckor sedan
QQCC ETF följer företag världen över som är aktiva inom kvantberäkning
-
 Nyheter4 veckor sedan
Fastställd utdelning i MONTDIV maj 2026
-
 Nyheter3 veckor sedan
Varför Plus500 är en dröm för finans-affiliate
-

 Nyheter3 veckor sedan
ETFer för fotbolls-VM 2026
-

 Nyheter3 veckor sedan
21shares produkter nu finns tillgängliga hos Revolut
-

 Nyheter6 dagar sedan
Den osynliga flaskhalsen i AI-boomen: Varför elinfrastruktur är nästa stora megatrend