
Nyheter
An alternative proposal to the Yale endowment model
ETF Securities Asset Allocation Research An alternative proposal to the Yale endowment model
Summary
Over the past 60 years, portfolio management has significantly gained in complexity and sophistication with active funds such as the Yale endowment fund not always outperforming a passive index tracking strategy.
Nowadays, it is possible to construct an equivalent strategy to the Yale model that is more transparent, more liquid, passively managed and cheaper to implement.
Adding precious metals to this alternative model improves return by 19% and enhances the Sharpe ratio by 46%.
Download the complete report
Early stage of portfolio construction
Since 1950, portfolio construction has been through 3 distinct phases1 and is in what looks like its fourth phase since the global financial crisis in 2008.
1 Increasing Institutional Portfolio Complexity and the Resulting Shift from a Product to a Solutions Mindset – Citi Business Advisory Services

The first phase ran from the early 1950’s to mid-1990. Rather than holding 100% in equities or bonds, investors searched for an optimal mix to diversify their portfolio risk. Based on the Modern Portfolio Theory, the generally accepted rule of thumb for optimal weights were 60% equities and 40% bonds.
(Click to enlarge)
Over the past 10 years, the 60/40 model has provided a Sharpe ratio of 0.435, more than twice higher than the Sharpe ratio of a global equity index thanks to the lower volatility of the 60/40 benchmark of 9.7% compared to 16.9% for the MSCI World.
In 2000, the Yale University Investments Office promoted the idea that investors should diversify in asset classes other than equities and bonds. Alternative assets such as private equity or hedge funds have higher return potential and diversification power as they are less liquid, therefore less volatile and less subject to strong correction. The outperformance of the Yale fund made the model popular among institutional investors.
Active versus passive portfolio management
The Yale endowment fund was created to provide support to the operating budget of the university scholars. Actively managed, the fund has progressively increased its exposure to alternative assets from 15% in 1950 to more than 75% today. As of June 2014, the fund was holding 15.4% in equities, 8.4% in bonds and cash and 76.2% in alternative assets: private equity (33%), hedge funds (17.4%) and real assets (25.8%).

(Click to enlarge)
Over the past 10 years to June 2015, the fund returned 10% per year compared to 7% for the 60/40 benchmark. It is worth noting that the fund did worse than the benchmark during the financial crisis in the year to June 2009. The fund target weights for 2016 are more or less the same as in 2014: 18.5% in equities, 8.5% in bonds and cash and 73% in alternative assets.
Low risk investors such as pension funds may however see the Yale model as too aggressive, refrained by the cost to replicate such an illiquid portfolio. Compared to endowment funds, pension funds have a larger investment pool and a shorter investment horizon to generate income for their clients.
Alternatives to the Yale endowment model

Because the Yale endowment fund is actively managed and invested in funds that are not listed on exchanges, the model is not replicable. Based on the same concept, we constructed an alternative portfolio with 20% equities, 5% bonds and 75% in alternative liquid assets. The 75% is equally allocated to private equity, hedge funds and real estate.
(Click to enlarge)
Since March 2005, the alternative portfolio returned 8% per year on average, 39% above the 60/40 benchmark over the same period. It is interesting to note that adding a basket of precious metals into the alternative portfolio increases the portfolio return by 19% to 9.5%. The addition of the precious metals basket also enhances the alternative portfolio risk/return profile as the Sharpe ratio of the portfolio increases to 0.524 from 0.359 without precious metals.

(Click to enlarge)
Low risk investors may find a core/satellite portfolio more appealing. We illustrate that a core/satellite strategy which holds 70% in core assets such as the 60/40 benchmark and 30% in alternative assets as a satellite provides an annual return of 7.4% comparable to the alternative portfolio which provides a return of 8%. The volatility of the core/satellite strategy is however much lower than the volatility of both alternative portfolios, enhancing the portfolio Sharpe ratio to 0.525. The 30% in the satellite are equally allocated to private equity, hedge funds, real estate and a basket of precious metals.
The new generation of portfolio models
The global financial crisis in 2008 drastically changed investor behaviour and portfolio management. Prior to the crisis, while investors were increasing their portfolio diversification toward alternative assets, they also concentrated their risk exposure toward equity risk essentially and saw their returns plummet as the financial market collapsed. The Yale endowment fund fell 24.6% in the year to June 2009 while the alternative portfolio fell 19.8% (with precious metals) and the 60/40 benchmark was down 12%. The real added-value of active diversification across asset classes is therefore questioned.
New types of portfolio management have emerged since and among them is the concept of diversification across risk factors, known as smart beta. Instead of using a classification by asset class, securities are classified by risk exposure. Two securities can then provide diversification despite being part of the same asset class as long as they are not exposed to the same risk.
Our proprietary contrarian model2 discussed in our previous note is a long only portfolio of commodities that takes a smart approach to traditional allocation strategies with commodities. The smart beta commodity portfolio has returned twice the annual return of the Yale fund over the past ten years to June 2015 while the alternative portfolio with precious metals has outperformed the fund by 11% over the same period.
2 How to make the best of commodities: the contrarian model – ETF Securities (02 February 2016)
(Click to enlarge)
In this note, we have shown that it is possible to construct an alternative portfolio that outperforms the Yale endowment fund when adding a basket of precious metals. As opposed to the Yale endowment fund, the alternative portfolio with precious metals is passively managed, more liquid and more transparent. Adding precious metals to the alternative portfolio improves the portfolio return and enhances its Sharpe ratio. Over the past sixty years, portfolio management has significantly gained in complexity and sophistication. Managers need to find innovative and cost efficient solutions that truly diversify investors’ portfolio risk. Portfolio allocation shifts from being asset class based to risk factor based and from active to passive management. The real added-value of active funds over passive funds continues to be debated.
Portfolio performance
This table shows how the different portfolios studied in the current and previous asset allocation notes have recently performed. In each section, the assets or portfolios are benchmarked against the portfolio in bold.
(Click to enlarge)
Important Information
General
This communication has been issued and approved for the purpose of section 21 of the Financial Services and Markets Act 2000 by ETF Securities (UK) Limited (“ETFS UK”) which is authorised and regulated by the United Kingdom Financial Conduct Authority (the “FCA”).
The information contained in this communication is for your general information only and is neither an offer for sale nor a solicitation of an offer to buy securities. This communication should not be used as the basis for any investment decision. Historical performance is not an indication of future performance and any investments may go down in value.


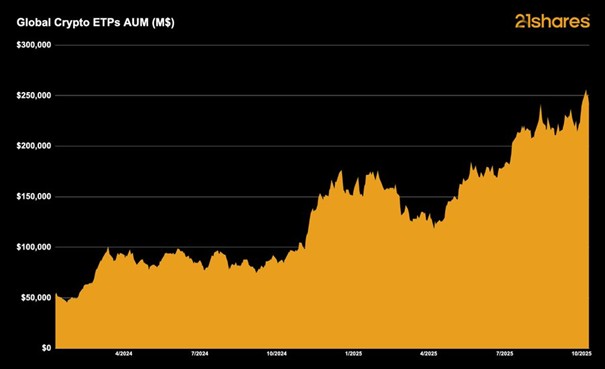
I början av året förutspådde 21shares att krypto-ETPer skulle driva ytterligare institutionell adoption och nå 250 miljarder dollar i förvaltat kapital globalt. Den milstolpen har just nåtts.
Research Newsletter
Each week the 21Shares Research team will publish our data-driven insights into the crypto asset world through this newsletter. Please direct any comments, questions, and words of feedback to research@21shares.com
Disclaimer
The information provided does not constitute a prospectus or other offering material and does not contain or constitute an offer to sell or a solicitation of any offer to buy securities in any jurisdiction. Some of the information published herein may contain forward-looking statements. Readers are cautioned that any such forward-looking statements are not guarantees of future performance and involve risks and uncertainties and that actual results may differ materially from those in the forward-looking statements as a result of various factors. The information contained herein may not be considered as economic, legal, tax or other advice and users are cautioned to base investment decisions or other decisions solely on the content hereof.


Globala krypto-ETPer förvaltade tillgångar når 250 miljarder dollar

YGLD ETP spårar priset på guld och ger en löpande avkastning

Investera i Stacks med en börshandlad produkt

VALOUR FLR SEK följer priset på kryptovalutan FLR
BlackRock utökar sitt utbud av iShares iBonds UCITS ETFer med sex nya lanseringar

HANetf och Infrastructure Capital Advisors samarbetar för att lansera aktivt förvaltad preferensavkastnings-ETF i Europa

IN0A ETF spårar S&P 500 med fokus på företag med höga ESG-betyg

De bästa lågvolatilitets ETFer på marknaden
PLTY ETP utfärdar optioner mot aktier i Palantir
Time in Bitcoin beats timing Bitcoin
-
 Nyheter4 veckor sedan
HANetf och Infrastructure Capital Advisors samarbetar för att lansera aktivt förvaltad preferensavkastnings-ETF i Europa
-
 Nyheter4 veckor sedan
IN0A ETF spårar S&P 500 med fokus på företag med höga ESG-betyg
-
 Nyheter3 veckor sedan
De bästa lågvolatilitets ETFer på marknaden
-

 Nyheter4 veckor sedan
PLTY ETP utfärdar optioner mot aktier i Palantir
-

 Nyheter4 veckor sedan
Time in Bitcoin beats timing Bitcoin
-

 Nyheter4 veckor sedan
HANetf kommenterar kopparuppgången
-

 Nyheter2 veckor sedan
Fokus mot en helt ny börshandlad produkt i september 2025
-

 Nyheter3 veckor sedan
M5TYs senaste utdelningstakt (55 %) belyser covered call-strategins inkomstpotential