
Nyheter
Agriculture stocks on the cusp of recovery

ETF Securities Equity Research – Agriculture stocks on the cusp of recovery
Summary
- Decline in overall production expenses (-2%) to cushion the fall in cash receipts
- The expected increase in direct US government farm program payments in 2016 will benefit producers
- The weaker US dollar will benefit US agricultural exports providing a strong catalyst for US farm income
- The uptick in profitability coupled with the rising sentiment indicator appears favourable for agricultural producers
Farm income outlook less bearish
A sustained period of high crop prices from 2008 to 2012 led to a bout of investment by agricultural producers, since then falling soft commodity prices have revealed high debt loads and narrowing margins. However the drop in input expenses coupled with a turnaround in sentiment is painting a more optimistic picture for agricultural producers heading into 2016.
Our analysis focusses on the S-net ITG agriculture index, which is diversified across Seeds Chemicals & Fertilizers (53%), Commodity Agricultural Products (30%), Equipment (13%) and Livestock (3%) with 70% of the constituents from the United States.
In the latest farm income outlook released by the United States Department of Agriculture (USDA), US net farm income, a key indicator of U.S. farm well-being, is forecast to decline by 3% in 2016. While this will be the third consecutive year in decline, it is not as severe as the declines of -27% and -38% witnessed in the prior years 2014 and 2015 respectively. Cash receipts are forecast to fall 2.5%, falling prices being the key contributor to this price fall as highlighted in the accompanying chart.
Global nitrogen fertilizer supply is poised to grow as cheap energy prices fuel production increases, providing a boost to their bottom line. Although it is worth noting that the recent squeeze on farmers margins does not eliminate the risk of farmers skipping application of fertiliser or shifting acreage from chemical intensive corn to other crops. We believe the fall in fertiliser costs is likely to benefit both fertiliser producers and farmers.

(Click to enlarge) Source: USDA, Economic Research Service, Farm income and wealth statistics, ETF Securities
Lower expenses buffer slide in cash receipts
Overall farm production expenses are forecast (USDA) to decline for the second consecutive year. Occurrences of multiyear reductions in farm production expenses are rare, the last time being 1984-86. This drop in expenses for inputs such as feed, livestock/ poultry purchases and fuel are forecast to outweigh the increase in interest expenses and hired labour costs thereby alleviating falling cash receipts. More importantly input costs (currently in 2nd year of decline) tend to lag behind commodity price swings (that have been in decline for 4 years).

(Click to enlarge) Source: USDA, Economic Research Service, Farm income and wealth statistics, ETF Securities
In addition, US farmers are poised to benefit from a 31.4% ($13.9bn) increase in direct government farm payments in 2016. The 2014 farm bill eliminated direct payments worth $5bn annually and replaced them with a net suite of safety net programs that will be triggered in 2016 if farm prices continue to fall.
Lower US dollar to benefit exports
Agricultural exports have been a major catalyst for the strong U.S. farm income in prior years, accounting for more than 30% of gross cash farm income. As majority of commodities are priced in US dollars, the appreciation of the dollar against the local currency of non-US growers has made the commodities more expensive for the foreign based buyer. Although its difficult to quantify just how much buyers have been sourcing lower cost soft commodities we have seen anecdotal evidence of this behaviour. For example, Brazil’s soya bean exports surpassing US soya bean exports in 2015 are likely due to the Brazilian Real’s depreciation. We expect a continuation of US Dollar weakness in 2016 benefitting farm income which has been squeezed by recent USD strength.
Outlook for Agricultural commodities
The correlation of agricultural producers with livestock, grains and softs has depicted a cyclical relation over time. Current correlation with livestock remains high at 80%, followed by grains at 64% and lower for softs at 30%.

(click to enlarge)
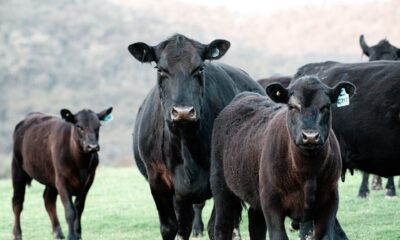
Livestock related commodities account for approximately half of the farmer’s cash receipts while the other half comes from crops (namely corn), so farm income would benefit if these specific commodities rise.
- Livestock sector ended 2015 as the worst performer among agricultural commodities despite the impact of avian influenza, market prices are expected lower in 2016 according to USDA.
- The price outlook for grains – namely corn, wheat and soya bean prices remain subdued since their inventory levels remain are at record highs.
- Sugar prices are expected higher owing to the reduced sugar supply from Brazil and India driving expectations for a larger world market deficit in 2015/16.
- Dry conditions emanating from the El Nino coupled with a rebound in the real is lending buoyancy to Arabica coffee prices in 2016.
- Cocoa is forecasted to be in a supply deficit in 2016.
- While cotton has been negatively impacted from lower import demand into China, the crop is expected to remain in a deficit this year.
Shift in sentiment signals an opportunity
Despite the pessimism surrounding the agriculture industry, agricultural producers are currently trading at 20x earnings and 3x book value, in line with their respective 10-year average. Profitability of these companies has been volatile given their exposure to the vagaries of the weather. We are currently in one of the most extreme El Niño events on record, dating back to 1950. According to the Australian Bureau of Meteorology, out of the past 26 El Niño events since 1900 approximately 40% have been followed by a La Niña. If this came to pass, wheat, corn, soybeans, coffee and cocoa will benefit from favourable weather thereby negatively impacting prices while sugar prices will benefit on the upside.
Net profit margins have been in a downward trend since the slump in commodity prices ensued in 2011 but the last quarter in 2015 has seen an uptick of 3.1% over the prior year. Net debt to assets remains high at 31x. USDA has reported growth in farm real estate loan volumes throughout 2015, commercial banks and the farm credit system has remained cooperative and credit to the sector has not been curtailed until now.
Our sentiment indicator (based on consensus data) has been rising since 2014, highlighting a renewed sign of optimism in holding agriculture producer stocks.

(Click to enlarge) Source: Bloomberg, ETF Securities
In summary we believe agricultural producers are modestly valued, with profitability starting to turn the corner in-line with shifting positive sentiment. Despite the pessimism that permeates through the farming industry, farm income credit has not been curtailed. While net farm income is forecast to decline for the third consecutive year, the lag in declining expenses is expected to catch up and help alleviate the decline. 2016 has seen a positive turnaround for majority of commodities and is lending support for the price outlook of agricultural commodities.
Important Information
General
This communication has been issued and approved for the purpose of section 21 of the Financial Services and Markets Act 2000 by ETF Securities (UK) Limited (“ETFS UK”) which is authorised and regulated by the United Kingdom Financial Conduct Authority (the “FCA”).


Even buying Bitcoin at its yearly peak since 2020 would still have doubled your investment, proving the power of long-term growth versus trying to time the market.


Why Solana matters: Exploring its use cases and growing adoption
Solana’s surge isn’t just market speculation; it’s driven by real-world adoption. From payments and DeFi to tokenization, the blockchain is seeing record engagement, reflected in its all-time high total value locked (TVL).


How Raydium and Jupiter are powering Solana DeFi
Raydium and Jupiter are the pillars of Solana’s DeFi ecosystem, delivering deep liquidity, seamless trading, and efficient execution that keep the network thriving. They make crypto markets faster, cheaper, and more accessible for everyone.


Research Newsletter
Each week the 21Shares Research team will publish our data-driven insights into the crypto asset world through this newsletter. Please direct any comments, questions, and words of feedback to research@21shares.com
Disclaimer
The information provided does not constitute a prospectus or other offering material and does not contain or constitute an offer to sell or a solicitation of any offer to buy securities in any jurisdiction. Some of the information published herein may contain forward-looking statements. Readers are cautioned that any such forward-looking statements are not guarantees of future performance and involve risks and uncertainties and that actual results may differ materially from those in the forward-looking statements as a result of various factors. The information contained herein may not be considered as economic, legal, tax or other advice and users are cautioned to base investment decisions or other decisions solely on the content hereof.


Time in Bitcoin beats timing Bitcoin

WMMV ETF en lågvolatilitetsfond som handlas i euro och pund
UBS AM lanserar UBS Treasury Yield Plus ETFer
COINUNI ETP spårar kryptovalutan Uniswap

ETF- och ETP-noteringar den 16 september 2025: nytt på Xetra och Börse Frankfurt

Utdelningar och försvarsfonder lockade i augusti

Månadsutdelande ETFer uppdaterad med IncomeShares produkter

HANetfs analyserar hur ett fredsavtal kan påverka det europeiska försvaret

ADLT ETF investerar bara i riktigt långa amerikanska statsobligationer

Septembers utdelning i XACT Norden Högutdelande
-
 Nyheter2 veckor sedan
Utdelningar och försvarsfonder lockade i augusti
-
 Nyheter3 veckor sedan
Månadsutdelande ETFer uppdaterad med IncomeShares produkter
-
 Nyheter4 veckor sedan
HANetfs analyserar hur ett fredsavtal kan påverka det europeiska försvaret
-
 Nyheter4 veckor sedan
ADLT ETF investerar bara i riktigt långa amerikanska statsobligationer
-
 Nyheter2 veckor sedan
Septembers utdelning i XACT Norden Högutdelande
-

 Nyheter3 veckor sedan
Fastställd utdelning i MONTDIV augusti 2025
-

 Nyheter2 veckor sedan
HANetf kommenterar mötet mellan Kina, Ryssland och Nordkorea vid militärparad
-

 Nyheter3 veckor sedan
AICT ETF investerar i obligationer utgivna av företag från tillväxtmarknader