
Nyheter
Agriculture stocks on the cusp of recovery
ETF Securities Equity Research – Agriculture stocks on the cusp of recovery
Summary
- Decline in overall production expenses (-2%) to cushion the fall in cash receipts
- The expected increase in direct US government farm program payments in 2016 will benefit producers
- The weaker US dollar will benefit US agricultural exports providing a strong catalyst for US farm income
- The uptick in profitability coupled with the rising sentiment indicator appears favourable for agricultural producers
Farm income outlook less bearish
A sustained period of high crop prices from 2008 to 2012 led to a bout of investment by agricultural producers, since then falling soft commodity prices have revealed high debt loads and narrowing margins. However the drop in input expenses coupled with a turnaround in sentiment is painting a more optimistic picture for agricultural producers heading into 2016.
Our analysis focusses on the S-net ITG agriculture index, which is diversified across Seeds Chemicals & Fertilizers (53%), Commodity Agricultural Products (30%), Equipment (13%) and Livestock (3%) with 70% of the constituents from the United States.
In the latest farm income outlook released by the United States Department of Agriculture (USDA), US net farm income, a key indicator of U.S. farm well-being, is forecast to decline by 3% in 2016. While this will be the third consecutive year in decline, it is not as severe as the declines of -27% and -38% witnessed in the prior years 2014 and 2015 respectively. Cash receipts are forecast to fall 2.5%, falling prices being the key contributor to this price fall as highlighted in the accompanying chart.
Global nitrogen fertilizer supply is poised to grow as cheap energy prices fuel production increases, providing a boost to their bottom line. Although it is worth noting that the recent squeeze on farmers margins does not eliminate the risk of farmers skipping application of fertiliser or shifting acreage from chemical intensive corn to other crops. We believe the fall in fertiliser costs is likely to benefit both fertiliser producers and farmers.

(Click to enlarge) Source: USDA, Economic Research Service, Farm income and wealth statistics, ETF Securities
Lower expenses buffer slide in cash receipts
Overall farm production expenses are forecast (USDA) to decline for the second consecutive year. Occurrences of multiyear reductions in farm production expenses are rare, the last time being 1984-86. This drop in expenses for inputs such as feed, livestock/ poultry purchases and fuel are forecast to outweigh the increase in interest expenses and hired labour costs thereby alleviating falling cash receipts. More importantly input costs (currently in 2nd year of decline) tend to lag behind commodity price swings (that have been in decline for 4 years).

(Click to enlarge) Source: USDA, Economic Research Service, Farm income and wealth statistics, ETF Securities
In addition, US farmers are poised to benefit from a 31.4% ($13.9bn) increase in direct government farm payments in 2016. The 2014 farm bill eliminated direct payments worth $5bn annually and replaced them with a net suite of safety net programs that will be triggered in 2016 if farm prices continue to fall.
Lower US dollar to benefit exports
Agricultural exports have been a major catalyst for the strong U.S. farm income in prior years, accounting for more than 30% of gross cash farm income. As majority of commodities are priced in US dollars, the appreciation of the dollar against the local currency of non-US growers has made the commodities more expensive for the foreign based buyer. Although its difficult to quantify just how much buyers have been sourcing lower cost soft commodities we have seen anecdotal evidence of this behaviour. For example, Brazil’s soya bean exports surpassing US soya bean exports in 2015 are likely due to the Brazilian Real’s depreciation. We expect a continuation of US Dollar weakness in 2016 benefitting farm income which has been squeezed by recent USD strength.
Outlook for Agricultural commodities
The correlation of agricultural producers with livestock, grains and softs has depicted a cyclical relation over time. Current correlation with livestock remains high at 80%, followed by grains at 64% and lower for softs at 30%.

(click to enlarge)
Livestock related commodities account for approximately half of the farmer’s cash receipts while the other half comes from crops (namely corn), so farm income would benefit if these specific commodities rise.
- Livestock sector ended 2015 as the worst performer among agricultural commodities despite the impact of avian influenza, market prices are expected lower in 2016 according to USDA.
- The price outlook for grains – namely corn, wheat and soya bean prices remain subdued since their inventory levels remain are at record highs.
- Sugar prices are expected higher owing to the reduced sugar supply from Brazil and India driving expectations for a larger world market deficit in 2015/16.
- Dry conditions emanating from the El Nino coupled with a rebound in the real is lending buoyancy to Arabica coffee prices in 2016.
- Cocoa is forecasted to be in a supply deficit in 2016.
- While cotton has been negatively impacted from lower import demand into China, the crop is expected to remain in a deficit this year.
Shift in sentiment signals an opportunity
Despite the pessimism surrounding the agriculture industry, agricultural producers are currently trading at 20x earnings and 3x book value, in line with their respective 10-year average. Profitability of these companies has been volatile given their exposure to the vagaries of the weather. We are currently in one of the most extreme El Niño events on record, dating back to 1950. According to the Australian Bureau of Meteorology, out of the past 26 El Niño events since 1900 approximately 40% have been followed by a La Niña. If this came to pass, wheat, corn, soybeans, coffee and cocoa will benefit from favourable weather thereby negatively impacting prices while sugar prices will benefit on the upside.
Net profit margins have been in a downward trend since the slump in commodity prices ensued in 2011 but the last quarter in 2015 has seen an uptick of 3.1% over the prior year. Net debt to assets remains high at 31x. USDA has reported growth in farm real estate loan volumes throughout 2015, commercial banks and the farm credit system has remained cooperative and credit to the sector has not been curtailed until now.
Our sentiment indicator (based on consensus data) has been rising since 2014, highlighting a renewed sign of optimism in holding agriculture producer stocks.

(Click to enlarge) Source: Bloomberg, ETF Securities
In summary we believe agricultural producers are modestly valued, with profitability starting to turn the corner in-line with shifting positive sentiment. Despite the pessimism that permeates through the farming industry, farm income credit has not been curtailed. While net farm income is forecast to decline for the third consecutive year, the lag in declining expenses is expected to catch up and help alleviate the decline. 2016 has seen a positive turnaround for majority of commodities and is lending support for the price outlook of agricultural commodities.
Important Information
General
This communication has been issued and approved for the purpose of section 21 of the Financial Services and Markets Act 2000 by ETF Securities (UK) Limited (“ETFS UK”) which is authorised and regulated by the United Kingdom Financial Conduct Authority (the “FCA”).


• Expanding Geopolitical Conflict Throws Crypto in Turmoil, Hong Kong ETFs Revive Hope
• Ethereum’s Most Anticipated Application of the Year is Live
Expanding Geopolitical Conflict Throws Crypto in Turmoil, Hong Kong ETFs Revive Hope
The latest Consumer Price Index (CPI) report released last Wednesday revealed a hotter-than-expected inflation rate of 3.5%, exceeding forecasts of 3.4%. This marks the fourth consecutive month where inflation has surpassed expectations, dimming hopes of rate cuts in the near future, resulting in a sustained high interest environment. This is further evidenced by interest rate futures currently pricing in just two rate cuts for the entirety of 2024, a significant shift from four months ago, when markets were predicting a more hawkish approach. Further, the conflict between Iran and Israel escalated more this weekend, as Iran launched a drone strike towards Israel, who are said to be potentially preparing for ‘retaliation’. This rise in geopolitical tensions coincided with a decline in the crypto market as Bitcoin (BTC) and Ethereum (ETH) prices fell by 8.22% and 11.29% respectively.
That said, it’s worth remembering that Bitcoin is viewed as a flight to safety during geopolitical conflicts. For instance, BTC grew by almost 17% during Russia’s invasion of Ukraine. This was driven by the fact that the average Russian citizen was able to withdraw their capital out of banks promptly before the imposed sanctions. Similarly, Ukrainians leveraged Bitcoin’s decentralized nature to navigate the overall shutdown of their financial system, while leveraging it to resume raising donations, showcasing its value as a decentralized and globally accessible asset immune to disruptions.
However, Bitcoin’s response to Iran’s recent escalation may have been adverse. This is given the gravity and the complexity of the geopolitical situation and its potential to entangle several other actors into the conflict, potentially affecting a broader swath of the world, including global trade and economic stability. Nevertheless, Bitcoin’s properties uniquely position it to serve a dual function as both a risk-on and risk-off asset. This duality could explain why its behavior diverged from that of gold in recent days, facing a drawdown last week versus benefiting from Russia’s conflict in 2022, as shown below in Figure 1.
Figure 1: BTC vs Gold Performance in 2022 vs 2024 – On a Weekly Timeframe
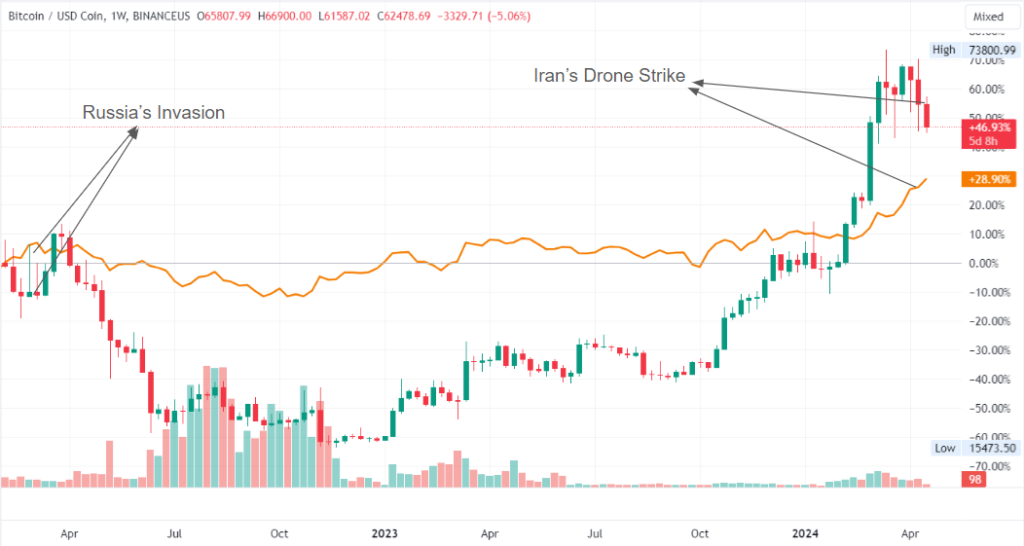
Source: TradingView
Finally, while the industry showed signs of a tentative recovery following last week’s economic challenges, evidenced by BTC soaring to nearly $67K on Monday, it’s crucial to maintain vigilance and closely monitor Israel’s response as it could have additional repercussions on the global market. Bitcoin faces a pivotal week with the highly anticipated Bitcoin Halving event scheduled in just four days, which will cut the issuance of new BTC in half, further tightening its already limited supply. This scarcity narrative is often seen as a bullish signal, which potentially bolsters Bitcoin’s position as a store of value and a hedge against inflation, as investors seek refuge in the current environment.
Adding to the positive sentiment, the Hong Kong Securities and Futures Commission (SFC) recently granted conditional approval for the launch of the first spot Bitcoin and Ethereum ETFs. The investment vehicle could unlock up to $25B in demand from Chinese investors via the Southbound Stock Connect program, according to Matrixport. The approval could also expand BTC’s market penetration into the wealth management sector in Hong Kong valued at $1.15T. The combined effect of the halving and the ETF approvals could provide a much-needed boost to the industry’s current momentum. A trend which is evident in Figure 2 below, indicating that flows into BTC have remained positive since the beginning of the year.
Figure 2 – *BTC Monthly Balance Change vs BTC Monthly Issuance vs ETF Cumulative Flows
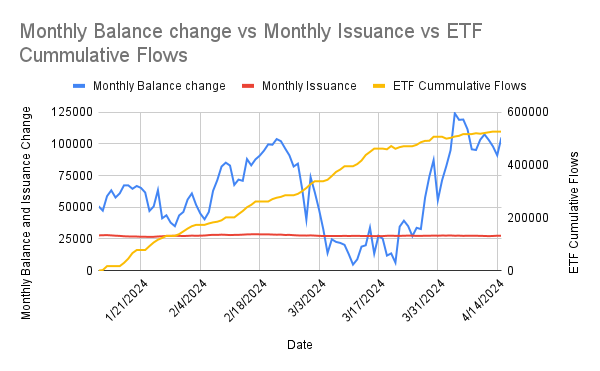
Source: Glassnode
*Monthly Balance Change includes different cohort of investors that hold >1, >10, >100, >1K BTC
Ethereum’s Most Anticipated Application of the Year is Live
EigenLayer, a protocol that allows ETH users to “re-stake” their existing staked ETH to validate the security of external networks known as Actively Validated Services (AVS), has finally deployed on mainnet. EigenLayer has been long anticipated as it enables capital efficiency by allowing users to earn additional yield on top of their ETH staking yield. Further, it allows younger protocols to borrow the security assurances of Ethereum. This is crucial, as it circumvents the need for non-established protocols to develop their own security measures from scratch. This translates to a more cost-efficient approach while simultaneously bolstering their decentralization, as newer projects can anchor their security to Ethereum’s.
By opting to earn additional yield, users subject themselves to heightened smart contract risks, as they become exposed to the vulnerabilities of both Ethereum and the additional protocol relying on its security. Further, a large portion of ETH could end up being “re-staked” in EigenLayer instead of just validating the security of Ethereum, creating a problem of misalignment. In simpler terms, some validators might focus on maximizing their profits by pursuing strategies that prioritize short-term gains over the long-term security of the network. Moreover, the growing enthusiasm for the protocol suggests that a significant portion of the crypto economy might rely on Ethereum’s security assurances. Currently, 14% of all staked ETH is being allocated towards Eigen’s re-staking strategy. The continuation of this trend could lead to centralization, posing a risk as Ethereum might inadvertently become a single point of failure over a longer time horizon.
Wide-spread slashing is another concern. In essence, if a substantial amount of ETH is restaked in a single protocol, then a slashing event due to malicious or unintended behavior could significantly impact honest ETH stakers. Thus, Eigen proposed a slashing committee, comprising esteemed ETH developers and trusted community members, empowered to veto such occurrences and safeguard Ethereum’s integrity.
The final risk concerns a new breed of tokens known as Liquid Restaking Tokens (LRTs), which operate atop EigenLayer. LRTs, akin to Liquid Staking Tokens (LSTs) issued by the established Lido protocol in 2021, aim to unlock similar capital efficiency by allowing users to use their re-staked ETH as collateral for lending and borrowing. Given that restaked ETH in Eigen can’t be used across DeFi platforms, users have turned to LRT protocols like Ether.fi and Renzo to seek higher levels of capital flexibility, with their restaked assets. For context, LRTs grew exponentially by a factor of 28 throughout Q1, increasing from nearly 100K units to the current figure of 2.8M, as can be seen below in Figure 3, showing its soaring demand.
Figure 3 – Growth of Liquid Restaking Tokens (LRTs) on EigenLayer
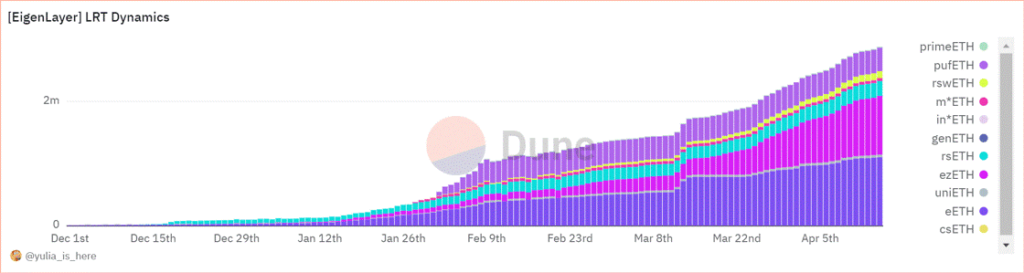
Source: @yulia_is_here on Dune
While LRTs can offer amplified gains through leveraged lending, they can also exacerbate losses, potentially increasing systemic risk in market downturns. Since some LRT protocols can’t offer withdrawal yet, users may be forced to swap their LRT token into ETH on thinly traded secondary markets and intensify their drawdowns.
All in all, the impact of Eigenlayer is not to be understated, as the excitement surrounding the new primitive has propelled it to become the second largest protocol on Ethereum by Total Value Locked (TVL), boasting an impressive $12.6B. This already eclipses the TVL of established players like Solana by fourfold, highlighting the immense potential and adoption that EigenLayer is witnessing despite its brief existence. Further, the excitement building up to its launch since they unveiled their roadmap in March has propelled the Ethereum validator entry queue to its highest level since September. The queue now necessitates a minimum waiting period of ~12 days before new validators can join the network, as seen below in Figure 4. Nevertheless, keep an eye out as we prepare to release a more in-depth exploration of EigenLayer risks over the coming weeks.
Figure 4: Ethereum Validator Entry Queue in Days
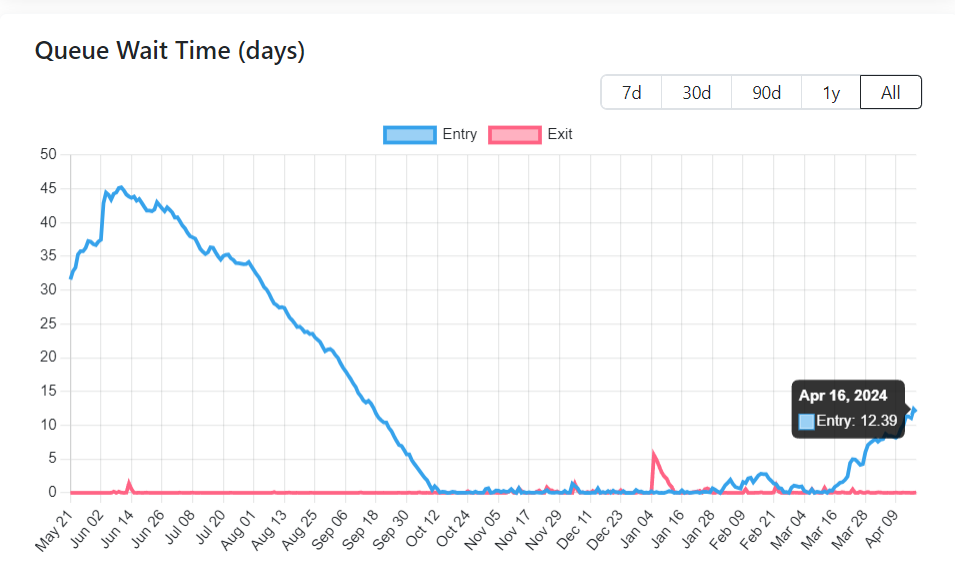
Source: ValidatorQueue
Bookmarks
Have you read our latest report, The Bitcoin Halving and Beyond? Click here to get a digital copy.

This Week’s Calendar
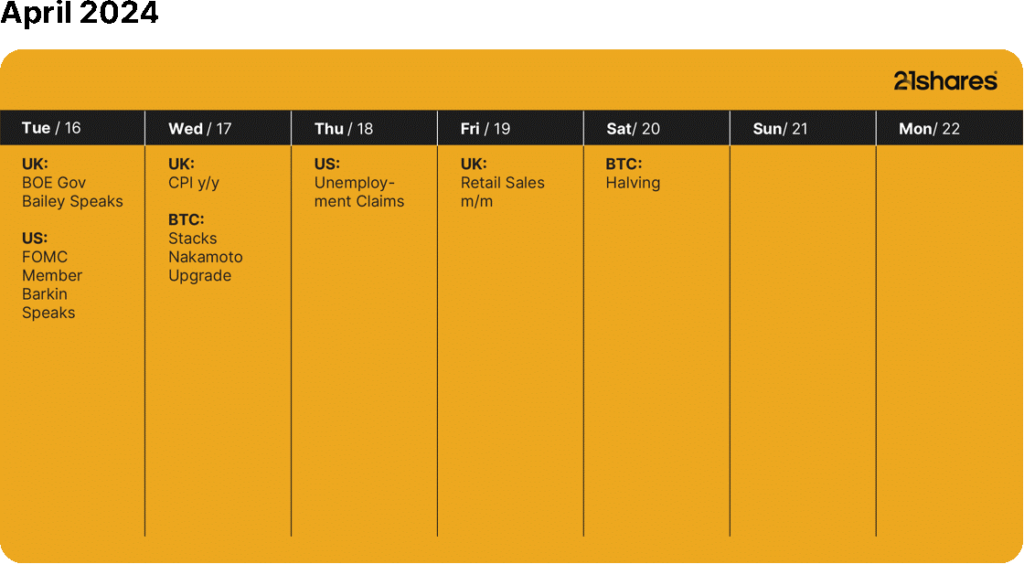
Source: Forex Factory, 21Shares
Research Newsletter
Each week the 21Shares Research team will publish our data-driven insights into the crypto asset world through this newsletter. Please direct any comments, questions, and words of feedback to research@21shares.com
Disclaimer
The information provided does not constitute a prospectus or other offering material and does not contain or constitute an offer to sell or a solicitation of any offer to buy securities in any jurisdiction. Some of the information published herein may contain forward-looking statements. Readers are cautioned that any such forward-looking statements are not guarantees of future performance and involve risks and uncertainties and that actual results may differ materially from those in the forward-looking statements as a result of various factors. The information contained herein may not be considered as economic, legal, tax or other advice and users are cautioned to base investment decisions or other decisions solely on the content hereof.


ETFGI, ett ledande oberoende forsknings- och konsultföretag som täcker trender i det globala ETF-ekosystemet, rapporterar att ETFmarknaden i Europa firar sitt 24-årsjubileum med rekordtillgångar på nästan 2 biljoner US-dollar. De första europanoterade ETF:erna gjorde sin debut den 11 april 2000. Dessa två ETFer var baserade på Euro Stoxx 50– och Stoxx Europe 50-indexen, och de var noterade på Deutsche Boerse i Tyskland.
Tillgångar som investerats i ETF-branschen i Europa nådde rekordhöga 1,96 biljoner USD i slutet av mars. Under mars samlade ETF-branschen i Europa nettoinflöden på 11,02 miljarder USD, vilket ger årets nettoinflöden till 49,52 miljarder USD, enligt ETFGIs mars 2024 europeiska ETFer och ETPers industrilandskapsrapport, den månatliga rapporten som är en del av en årlig betald forskningsprenumerationstjänst. (Alla dollarvärden i USD om inget annat anges.)
Höjdpunkter
- Tillgångar som investerats på ETFmarknaden i Europa nådde ett rekord på 1,96 Tn i slutet av mars och slog det tidigare rekordet på 1,90 Tn i slutet av februari 2024.
- Tillgångarna ökade med 7,8 % YTD 2024, från 1,82 Tn USD i slutet av 2023 till 1,96 Tn USD.
- Nettoinflöden på 11,02 miljarder USD i mars 2024.
- YTD nettoinflöden på 49,52 miljarder USD är tredje högsta någonsin efter YTD nettoinflöden på 59,30 miljarder USD 2021 och YTD nettoinflöden på 49,73 miljarder USD 2022.
- Artonde månaden med på varandra följande nettoinflöden.
”S&P 500-indexet ökade med 3,22 % i mars och är upp 10,56 % YTD 2024. De utvecklade marknaderna exklusive det amerikanska indexet ökade med 3,62 % i mars och steg 5,26 % YTD 2024. Spanien (upp 10,72 %) och Italien (upp 6,34 %) såg de största ökningarna bland de utvecklade marknaderna i mars. Emerging markets-indexet ökade med 1,50 % under mars och steg 2,08 % YTD 2024. Peru (upp 10,27 %) och Columbia (upp 8,19 %) såg de största ökningarna bland tillväxtmarknaderna i mars”, enligt Deborah Fuhr, managing partner, grundare och ägare av ETFGI.
Tillgångstillväxt i ETF-branschen i slutet av mars
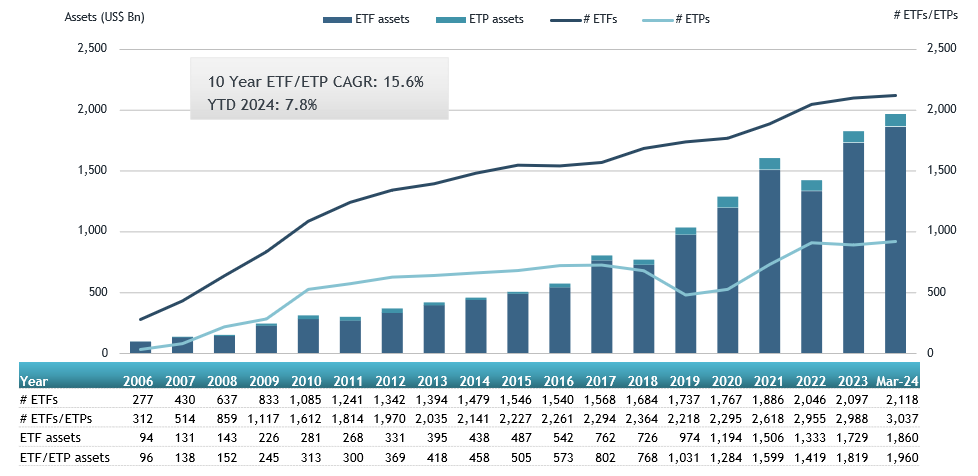
Källa: ETFGI
I slutet av mars hade ETFmarknaden i Europa 3 037 produkter, med 12 209 noteringar, tillgångar på $1,96 Tn, från 99 leverantörer listade på 29 börser i 24 länder.
Under mars samlade ETFer nettoinflöden till 11,02 miljarder USD. Aktie-ETFer samlade nettoinflöden på 9,81 miljarder USD under mars, vilket förde YTD nettoinflöden till 39,30 miljarder USD, högre än 19,38 miljarder USD i nettoinflöden av eget kapital YTD 2023. Ränte-ETFer rapporterade nettoinflöden på 719,00 USD YTD under 1 mars, vilket gav 25 USD nettoinflöden. miljarder, lägre än 15,49 miljarder USD i nettoinflöden YTD år 2023. Råvaru-ETFer rapporterade nettoutflöden på 75,35 miljoner USD under mars, vilket förde YTD nettoutflöden till 2,32 miljarder USD, lägre än 1,67 miljarder USD i nettoinflöden YTD 2023. på 670,27 miljoner USD under månaden, vilket samlade ett nettoinflöde för året i Europa på 2,33 miljarder USD, högre än 2,17 miljarder USD i nettoinflöden YTD 2023.
Betydande inflöden kan tillskrivas de 20 bästa ETFerna av nya nettotillgångar, som samlat in 9,63 miljarder USD under mars. iShares Core S&P 500 UCITS ETF – Acc (CSSPX SW) samlade in 918,91 miljoner USD, det största enskilda nettoinflödet.
Topp 20 ETFer efter nettoinflöden i mars 2024: Europa
| Namn | Kortnamn | Assets ($ Mn) Mar-24 | NNA ($ Mn) YTD-24 | NNA ($ Mn) Mar-24 |
| iShares Core S&P 500 UCITS ETF – Acc | CSSPX SW | 84,308.60 | 4,744.81 | 918.91 |
| UBS ETF (LU) MSCI United Kingdom UCITS ETF (GBP) A-acc – Acc | UKGBPB SW | 2,485.72 | 653.33 | 753.94 |
| Invesco MSCI USA ESG Universal Screened UCITS ETF – Acc | ESGU LN | 2,188.25 | 792.66 | 741.48 |
| Xtrackers II EUR Overnight Rate Swap UCITS ETF – 1C – Acc | XEON GY | 7,281.96 | 2,089.43 | 596.35 |
| HSBC S&P 500 UCITS ETF | HSPX LN | 6,756.08 | 661.46 | 562.23 |
| iShares MSCI EM ESG Enhanced UCITS ETF | EEDM LN | 5,000.88 | 886.95 | 556.22 |
| Vanguard FTSE All-World UCITS ETF | VWRD LN | 24,771.34 | 1,410.78 | 545.51 |
| Invesco S&P 500 UCITS ETF – Acc | SPXS LN | 25,176.99 | 939.08 | 497.72 |
| iShares MSCI ACWI UCITS ETF – Acc | ISAC LN | 12,806.01 | 1,453.06 | 469.35 |
| iShares USD Treasury Bond 0-1yr UCITS ETF | IBTU LN | 14,990.95 | 1,433.49 | 431.07 |
| iShares € High Yield Corp Bond UCITS ETF | IHYG LN | 7,694.75 | 1,427.77 | 413.53 |
| SPDR S&P 500 UCITS ETF | SPY5 GY | 12,491.17 | 3,418.58 | 388.74 |
| iShares Core MSCI World UCITS ETF – Acc | IWDA LN | 75,051.88 | 3,236.70 | 382.75 |
| Amundi Bloomberg Equal-weight Commodity ex-Agriculture UCITS ETF – Acc | COMO FP | 1,668.95 | 367.30 | 378.26 |
| iShares STOXX Europe Small 200 UCITS ETF (DE) | SCXPEX GY | 916.86 | 401.43 | 357.42 |
| Amundi MSCI Japan UCITS ETF – Acc | LCUJ GY | 4,400.85 | 158.96 | 343.86 |
| UBS ETF (CH) – MSCI Switzerland (CHF) A-dis – Acc | SWICHA SW | 1,126.17 | 354.69 | 335.87 |
| SPDR MSCI World UCITS ETF – Acc | SPPW GY | 5,653.51 | 715.38 | 324.95 |
| Amundi S&P 500 Climate Net Zero Ambition PAB UCITS ETF | ZPA5 GY | 3,965.66 | 925.46 | 320.42 |
| JPMorgan US Research Enhanced Index Equity ESG UCITS ETF – Acc | JREU LN | 7,047.30 | 1,230.55 | 315.09 |

Källa ETFGI
De 10 bästa ETPerna av nya nettotillgångar samlade ihop 1,69 miljarder USD under mars. WisdomTree Physical Silver – Acc (PHAG LN) samlade in 832,90 miljoner USD, det största enskilda nettoinflödet.
Topp 10 ETPer efter nettoinflöden i mars 2024: Europa
| Namn | Kortnamn | Assets ($ Mn) Mar-24 | NNA ($ Mn) YTD-24 | NNA ($ Mn) Mar-24 |
| WisdomTree Physical Silver – Acc | PHAG LN | 2,057.21 | 793.35 | 832.90 |
| iShares Physical Silver ETC – Acc | SSLN LN | 785.65 | 254.30 | 245.97 |
| Xtrackers IE Physical Gold ETC Securities – Acc | XGDU LN | 3,640.08 | 231.87 | 167.72 |
| AMUNDI PHYSICAL GOLD ETC (C) – Acc | GOLD FP | 4,575.61 | 307.29 | 127.12 |
| Xtrackers Physical Gold ETC (EUR) – Acc | XAD5 GY | 2,202.38 | 92.10 | 80.28 |
| WisdomTree Copper – Acc | COPA LN | 1,667.78 | 337.85 | 68.51 |
| Xtrackers Physical Gold Euro Hedged ETC – Acc | XAD1 GY | 1,335.65 | 5.06 | 50.49 |
| SG ETC FTSE MIB -3x Daily Short Collateralized – Acc | MIB3S IM | 33.07 | 88.10 | 40.49 |
| 21Shares Toncoin Staking ETP | TONN SW | 40.81 | 39.94 | 39.94 |
| Invesco Physical Gold ETC – EUR Hdg Acc | SGLE IM | 564.18 | 59.65 | 33.11 |

Källa: ETFGI
Investerare har tenderat att investera i Equity ETFs under mars.

Geopolitical Conflict on the Rise, while Ethereum Receives its Biggest Boost

H4Z7 ETF investerar i fastighetsbolag från utvecklade länder

ETFmarknaden i Europa firar sitt 24-årsjubileum med tillgångar på två biljoner USD

JPNY ETF spårar en korg bestående av 400 japanska aktier

Tillgång till obligationsmarknaden för företagsobligationer från utvecklade marknader

De mest populära börshandlade fonderna mars 2024

3 ETF:er du nog inte visste finns

FUIG ETF investerar i hållbara företagsobligationer som följer Parisavtalet
ETFmarknaden i Europa firar sitt 24-årsjubileum med tillgångar på två biljoner USD

Ny fond ger tillgång till företag från tillväxtmarknader exklusive Kina
-
 Nyheter3 veckor sedan
De mest populära börshandlade fonderna mars 2024
-
 Nyheter3 veckor sedan
3 ETF:er du nog inte visste finns
-
 Nyheter2 veckor sedan
FUIG ETF investerar i hållbara företagsobligationer som följer Parisavtalet
-
 Nyheter2 dagar sedan
ETFmarknaden i Europa firar sitt 24-årsjubileum med tillgångar på två biljoner USD
-
 Nyheter4 veckor sedan
Ny fond ger tillgång till företag från tillväxtmarknader exklusive Kina
-
 Nyheter4 veckor sedan
Fonder för att investera i batteriboomen…
-

 Nyheter6 dagar sedan
Försvarsfond når förvaltad volym på 500 MUSD
-

 Nyheter3 veckor sedan
Den största källan till elektricitet i Europa