Följ oss

Nyheter

Steel: U.S. Strong Despite Global Oversupply

Publicerad

den

Steel: U.S. Strong Despite Global Oversupply Overview: The U.S. steel industry has been a developing, positive theme in 2016. Steel impacts the industrial metals components of VanEck's actively and passively managed natural resources strategies. As of March 31, 2016, steel-related companies accounted for approximately $250 million of the firm's assets under management.

Steel: U.S. Strong Despite Global Oversupply Overview: The U.S. steel industry has been a developing, positive theme in 2016. Steel impacts the industrial metals components of VanEck’s actively and passively managed natural resources strategies. As of March 31, 2016, steel-related companies accounted for approximately $250 million of the firm’s assets under management.

The global steel industry is oversupplied and is facing significant headwinds. 2015 was arguably a turbulent year for the industry, given these major negatives: China’s economic slowdown, falling prices, and a glut of foreign steel imports into the U.S. (mainly from China).

Despite the negative view for the global steel industry, we believe that the U.S. steel industry has bottomed and unique investment opportunities exist. Thus far in 2016, the U.S. steel industry has performed well, and, we believe, there are further compelling upside opportunities. In short, we see these positive signs: (1) a continuation of a strengthening U.S steel price environment (Chart A); (2) fundamentally better operating and financial conditions via improved capacity utilization (Chart B); and (3) the potential for an industry-wide multiple rerating, which has not occurred in a long time.

Chart A: U.S. Steel Prices Rebound in 2016 ($/ton)

VanEck2

Source: CRU, Morgan Stanley Research. HRC represents ”hot rolled coil”; CRC is ”cold rolled coil”; and HDG is ”hot dipped galvanized steel.” All represent types of steel. Data as of 4/30/2016.

Chart B: U.S. Steel Industry Operating Conditions/Rates (% Capacity Utilization)

VanEck3

Source: AISI, Morgan Stanley. Capacity utilization is a metric used to measure the rate at which potential output levels are being met or used; this chart demonstrates improvement thus far in 2016. Data as of 4/30/2016.

Flood of Supply from China

The global steel industry is oversupplied, with about 33% idle spare capacity. During the period from 2012 to 2015, global steel production increased from 1,554 million metric tons (mmt) per annum to 1,667 mmt per annum, a 113 mmt (or 7.3%) jump, of which 94 mmt came from new capacity in China.

The magnitude of this increase in global supply is best understood when stacked against demand. The U.S. is the world’s third largest consumer of steel, with a 120 mmt to 130 mmt per annum market, while the European Union is the second largest market at 140 mmt to 150 mmt per annum. (China is both the world’s largest consumer and producer.)

China’s Overcapacity Problem

China’s demand for steel began to wane just at the time that the country began aggressively increasing its domestic production. The net result was that steel once destined for the Chinese domestic market found its way onto the export market with Chinese exports increasing from 42 mmt per annum in 2012 to 100 mmt per annum in 2015 (see Chart C).

Chart C: China’s Net Steel Exports

VanEck4

Source: VanEck, Bloomberg. Data as of 4/30/2016.

Predictably, the increase in Chinese steel export volumes depressed international steel export prices. This placed significant price pressure on domestic steel prices in countries that are large importers of steel, such as the U.S.

U.S. Steel Prices’ 2015 Collapse

At the end of 2015, steel (hot rolled coil) exports from China traded at $250/ton and imports into the U.S. reached record highs of 30% of demand, compared with a more normalized level of 18% to 20%. With cheaper imported steel flooding the U.S. market, domestic prices collapsed from $480/ton to around $370/ton (-23%) between July 2015 and January 2016.

These low prices (last seen during the 2008/2009 global financial crisis) threw the U.S. steel industry into a crisis of reduced orders, idle mills, and significant layoffs. To protect itself, the industry turned to trade protection measures to help combat low-priced imports. The Leveling the Playing Field Act, passed in 2015, seeks to maintain a fair marketplace for U.S. steelmakers as it restores and strengthens anti-dumping rules and countervailing duties.

As a result, in March 2016 the U.S. Department of Commerce announced that both government subsidies and dumping were occurring and accordingly levied tariffs in the range of 282% to 493%. These are more than enough to lock out Chinese steel from the U.S. market.

Upside Potential for U.S. Steel Prices

Looking out post the implementation of these policies, we expect current U.S. domestic steel prices to have additional upside. We believe that the price of domestic steel could improve because: (1) the removal of ”dumped and government subsidized” steel from the domestic market will normalize the mix between domestic supply and imports; (2) inventories will be drawn down; and (3) upward pressure on raw material prices, such as coking coal and iron ore, will continue.

However, looking ahead to 2017, we do expect the market to soften as higher prices translate into increased supply either from the U.S. domestic market (U.S. steel utilization rate is around 74%) or from increased imports. Finally, the strong automotive and non-residential markets alone are not sufficient to offset a potential increase in U.S domestic supply and so a resurgence in demand from other industries, such as the energy industry, will be required.

Trade Protection Taking Shape

In conclusion, although the U.S steel industry has performed well to date in 2016, we believe the opportunity has more near-term upside potential as the enforcement of all trade protection laws is still in its early stages. As authorities eventually implement these policies for steel, it would not be surprising to see additional trade protection announcements being made covering other key U.S. commodities.

Charl Malan

by Charl Malan, Senior Analyst

Malan has more than 20 years of industry experience and is a member of the Hard Assets Team that manages VanEck’s Natural Resources Equity strategy. Malan specializes in base and industrial metals, and also serves on the gold and precious metals team. Read full bio.

IMPORTANT DISCLOSURE

* Any discussion of specific securities mentioned in this post is neither an offer to sell nor a solicitation to buy these securities.

This content is published in the United States for residents of specified countries. Investors are subject to securities and tax regulations within their applicable jurisdictions that are not addressed on this content. Nothing in this content should be considered a solicitation to buy or an offer to sell shares of any investment in any jurisdiction where the offer or solicitation would be unlawful under the securities laws of such jurisdiction, nor is it intended as investment, tax, financial, or legal advice. Investors should seek such professional advice for their particular situation and jurisdiction. You can obtain more specific information on VanEck strategies by visiting Investment Strategies.

The views and opinions expressed are those of the author(s), but not necessarily those of VanEck, and these opinions may change at any time and from time to time. Non-VanEck proprietary information contained herein has been obtained from sources believed to be reliable, but not guaranteed. Not intended to be a forecast of future events, a guarantee of future results or investment advice. Historical performance is not indicative of future results. Current data may differ from data quoted. Any graphs shown herein are for illustrative purposes only. No part of this material may be reproduced in any form, or referred to in any other publication, without express written permission of VanEck.

Fortsätt läsa
Annons
Klicka för att kommentera

Skriv en kommentar

Din e-postadress kommer inte publiceras. Obligatoriska fält är märkta *

Nyheter

Time in Bitcoin beats timing Bitcoin

Publicerad

den

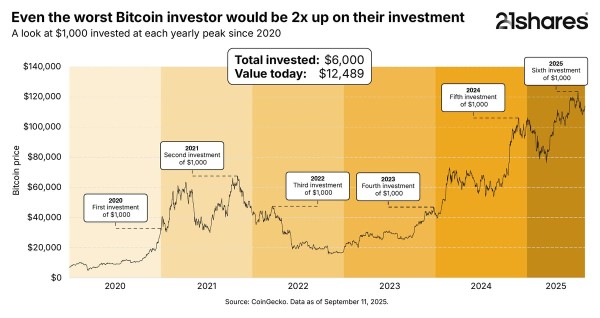
Even buying Bitcoin at its yearly peak since 2020 would still have doubled your investment, proving the power of long-term growth versus trying to time the market.

Even buying Bitcoin at its yearly peak since 2020 would still have doubled your investment, proving the power of long-term growth versus trying to time the market.

Why Solana matters: Exploring its use cases and growing adoption

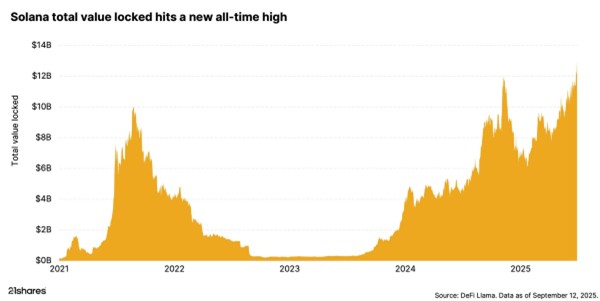
Solana’s surge isn’t just market speculation; it’s driven by real-world adoption. From payments and DeFi to tokenization, the blockchain is seeing record engagement, reflected in its all-time high total value locked (TVL).

How Raydium and Jupiter are powering Solana DeFi

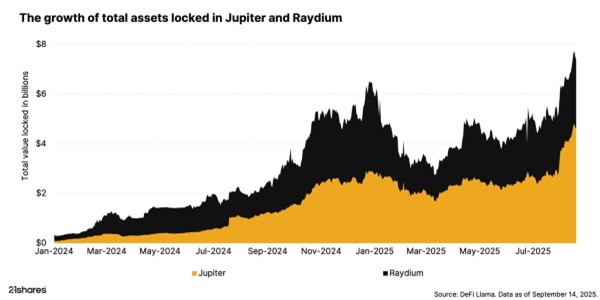
Raydium and Jupiter are the pillars of Solana’s DeFi ecosystem, delivering deep liquidity, seamless trading, and efficient execution that keep the network thriving. They make crypto markets faster, cheaper, and more accessible for everyone.

Research Newsletter

Each week the 21Shares Research team will publish our data-driven insights into the crypto asset world through this newsletter. Please direct any comments, questions, and words of feedback to research@21shares.com

Disclaimer

The information provided does not constitute a prospectus or other offering material and does not contain or constitute an offer to sell or a solicitation of any offer to buy securities in any jurisdiction. Some of the information published herein may contain forward-looking statements. Readers are cautioned that any such forward-looking statements are not guarantees of future performance and involve risks and uncertainties and that actual results may differ materially from those in the forward-looking statements as a result of various factors. The information contained herein may not be considered as economic, legal, tax or other advice and users are cautioned to base investment decisions or other decisions solely on the content hereof.

Fortsätt läsa

Nyheter

WMMV ETF en lågvolatilitetsfond som handlas i euro och pund

Publicerad

den

Amundi MSCI World Minimum Volatility Screened Factor UCITS ETF UCITS ETF Acc (WMMV ETF) med ISIN IE0001DKJVC2, försöker spåra MSCI World Minimum Volatility Select ESG Low Carbon Target-index. MSCI World Minimum Volatility ESG Reduced Carbon Target-index spårar aktier från utvecklade länder över hela världen som är valda enligt låg volatilitet och ESG-kriterier (miljö, social och företagsstyrning). Indexet har som mål att minska utsläppen av växthusgaser och ett förbättrat ESG-poäng jämfört med jämförelseindex. Jämförelseindex är MSCI World-index.

Amundi MSCI World Minimum Volatility Screened Factor UCITS ETF UCITS ETF Acc (WMMV ETF) med ISIN IE0001DKJVC2, försöker spåra MSCI World Minimum Volatility Select ESG Low Carbon Target-index. MSCI World Minimum Volatility ESG Reduced Carbon Target-index spårar aktier från utvecklade länder över hela världen som är valda enligt låg volatilitet och ESG-kriterier (miljö, social och företagsstyrning). Indexet har som mål att minska utsläppen av växthusgaser och ett förbättrat ESG-poäng jämfört med jämförelseindex. Jämförelseindex är MSCI World-index.

Den börshandlade fondens TER (total cost ratio) uppgår till 0,25 % p.a. Amundi MSCI World Minimum Volatility Screened Factor UCITS ETF UCITS ETF Acc är den enda ETF som följer MSCI World Minimum Volatility Select ESG Low Carbon Target-index. ETFen replikerar det underliggande indexets prestanda genom fullständig replikering (köper alla indexbeståndsdelar). Utdelningarna i ETF:n ackumuleras och återinvesteras.

Denna ETF lanserades den 30 oktober 2024 och har sin hemvist i Irland.

Investeringsmål

Amundi MSCI World Minimum Volatility Screened Factor UCITS ETF Acc försöker replikera, så nära som möjligt, oavsett om trenden är stigande eller fallande, resultatet för MSCI World Minimum Volatility Select ESG Low Carbon Target Index (”Indexet”). Delfondens mål är att uppnå en tracking error-nivå för delfonden och dess index som normalt inte kommer att överstiga 1 %.

Handla WMMV ETF

Amundi MSCI World Minimum Volatility Screened Factor UCITS ETF UCITS ETF Acc (WMMV ETF) är en europeisk börshandlad fond. Denna fond handlas på Deutsche Boerse Xetra.

Det betyder att det går att handla andelar i denna ETF genom de flesta svenska banker och Internetmäklare, till exempel DEGIRONordnet, Aktieinvest och Avanza.

Börsnoteringar

BörsValutaKortnamn
XETRAEURWMMV
XETRAGBPWMMX

Största innehav

Denna fond använder fysisk replikering för att spåra indexets prestanda.

NamnValutaVikt %Sektor
T-MOBILE US INCUSD2.00 %Communication Services
MOTOROLA SOLUTIONS INCUSD1.86 %Information Technology
MCKESSON CORPUSD1.57 %Health Care
ZURICH INSURANCE GROUP AGCHF1.56 %Financials
CISCO SYSTEMS INCUSD1.56 %Information Technology
WASTE MANAGEMENT INCUSD1.47 %Industrials
UNITEDHEALTH GROUP INCUSD1.42 %Health Care
MICROSOFT CORPUSD1.35 %Information Technology
KDDI CORPJPY1.32 %Communication Services
REPUBLIC SERVICES INCUSD1.32 %Industrials

Innehav kan komma att förändras

Fortsätt läsa

Nyheter

UBS AM lanserar UBS Treasury Yield Plus ETFer

Publicerad

den

UBS Asset Management lanserar EUR och USD Treasury Yield Plus UCITS ETFer· ETFerna syftar till att öka avkastningen samtidigt som riskegenskaperna hos deras referensindex bibehålls

· UBS Asset Management lanserar EUR och USD Treasury Yield Plus UCITS ETFer

· ETFerna syftar till att öka avkastningen samtidigt som riskegenskaperna hos deras referensindex bibehålls

· En egenutvecklad regelbaserad modell används för att bredda investeringsuniversumet för att förbättra tillgången till en större uppsättning möjligheter

UBS Asset Management (UBS AM) tillkännager idag lanseringen av två nya ETF:er som syftar till att leverera förbättrad avkastning, samtidigt som riskprofilen för deras underliggande statsobligationsindex bevaras. UBS EUR Treasury Yield Plus UCITS ETF och UBS USD Treasury Yield Plus UCITS ETF syftar till att överträffa sina respektive Bloomberg Treasury-index genom att rikta in sig på högre optionsjusterad spread (OAS), samtidigt som de bibehåller en strikt anpassning till duration, kreditkvalitet och landsexponering1.

Portföljkonstruktion

· Universumsdefinition: Varje ETF börjar med sitt respektive Bloomberg Treasury Index (EUR eller USD) och utökar uppsättningen möjligheter till att inkludera högkvalitativa statsobligationer, överstatliga obligationer och agentobligationer (SSA), vilka kan erbjuda en högre avkastning än statsobligationer.
· Optimering: SSA-obligationerna väljs ut med hjälp av en egenutvecklad regelbaserad modell som maximerar OAS samtidigt som strikta begränsningar för rating, land, sektor, duration och kurvrisk följs.

· Dynamisk allokering: Portföljförvaltaren kan använda sitt eget omdöme för att ytterligare förbättra portföljens avkastning och/eller riskprofil.

André Mueller, chef för kundtäckning, UBS AM, sa: ”De snabbt ökande tillgångarna i förbättrade ränte-ETF:er signalerar en växande investerarefterfrågan på fonder som går utöver traditionella passiva riktmärken. UBS AM har långvarig expertis inom regelbaserade strategier, så jag är glad att vi för första gången kan erbjuda denna möjlighet till ett bredare spektrum av kunder genom det bekväma, transparenta och effektiva ETF-omslaget.”

Fonden är registrerad för försäljning i Österrike, Danmark, Finland, Frankrike, Tyskland, Irland, Italien, Liechtenstein, Luxemburg, Nederländerna, Norge, Spanien, Sverige, Schweiz och Storbritannien.

ETFShare classTERISINBörsValutaBloomberg Ticker
UBS EUR Treasury Yield Plus UCITS ETF EUREUR acc0.15%LU3079566835SIX SwissEUREUTYP SW
Borsa ItalianaEURETY IM
XETRAEURCHSW GY
EUR   dis0.15%LU3079566918XETRAEURCHSZ GY
UBS USD Treasury Yield Plus UCITS ETF USDUSD acc0.15%LU3079567056SIX SwissUSDUSTYP SW
Borsa ItalianaEURUTY IM
XETRAEURCHSY GY
USD   dis0.15%LU3079567130XETRAEURCHSX GY
London Stock ExchangeGBPUTYP LN

Fortsätt läsa

21Shares

Prenumerera på nyheter om ETFer

* indicates required

21Shares

21Shares

Populära