
Nyheter
Special Market Commentary around Celsius
The crypto market endured another brutal meltdown as Celsius – one of the biggest custodian managers within the space – announced they’ll pause withdrawals due to the extreme market conditions. The company, which as recently as the 17th of May had more than $11.7B of users’ AUM, was heavily invested in multiple risky DeFi strategies. Celsius is a CeFi entity offering lucrative yields for depositors and borrowers by participating in riskier strategies such as Terra’s Anchor, stakehound or badgerdao. It is estimated that they lost a figure north of $100M in the hacks that plagued the two latest aforementioned protocols, while managing to get out of UST without incurring substantial damages.
On-chain forensics from the past 48 hours has also illustrated that Celsius had borrowed the DAI stablecoin against locking a WBTC position on MakerDAO, combined with holding a massive position of stETH (liquid-staking derivative of ETH) on Lido Finance worth almost $475M. The company has been topping up its loan vault with additional BTC collateral to reduce the liquidation price. On the contrary, the secondary market for trading stETH against ETH has been in turmoil as the peg broke, potentially instigating the firm to exit its derivative position at a loss.
With this brief coverage in mind, we’ll seek to provide three case scenarios for how we believe the crypto market could rebound going forward – with an exclusive focus on the two biggest assets by market cap. We’ll include the different factors and triggers that could play a role in dictating what type of recovery the industry could embark on.
TL;DR
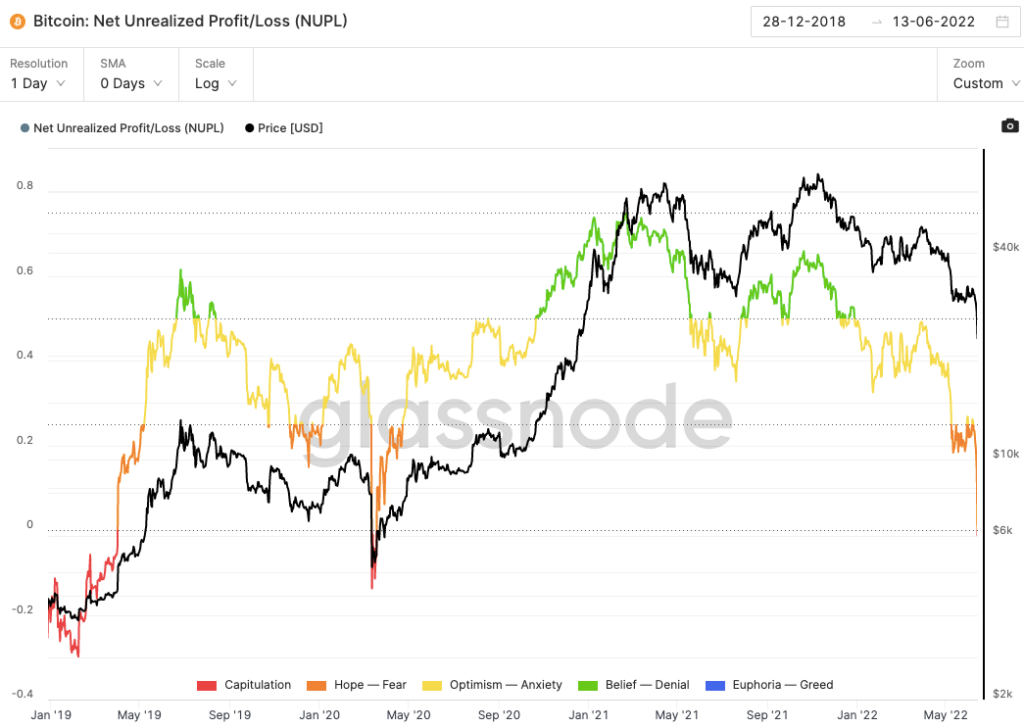
- Bright spot suggesting we’re nearing the bottom lies in the fact that both BTC and ETH NUPL* have reached near-capitulation areas of previous market cycles which gradually preceded a price reversal.
Regulatory clarity could provide a way forward for the restructuring of the crypto industry so that further implosions like UST and Celsius don’t re-materialize, while ensuring proper operational oversight takes place.
- Bitcoin and Ethereum have strong fundamentals with continuous development and user growth including institutions over the past year, complemented by a resilient NFT market.
- The key potential trigger for further drawdown is Celsius’s liquidity crisis and its contagion effect. On the flip side, the merge could be the potential fuel for Ethereum to gain a wider spectrum of investors thanks to cementing its scarcity, as well as living up to the ESG standards which will help paint the asset in a more-favorable light with institutional clients.
1) Best Case — Market Bottoms and Starts to Recover
Market Market Sentiment Indicators
Bitcoin
• NUPL* is showing an upward trend. The current level at -0.01 in the capitulation phase could be a bottoming signal
• Bitcoin reserve risk* has reached the level of 2019 market bottom
• Bitcoin production cost is currently at $30,000. Miners are more inclined to hold their
Bitcoin position instead of selling it. Miners’ Bitcoin reserves have increased by 19K YTD.
Ethereum
• Total Ethereum staked on Beacon Chain has reached 12.8M (182% YTD Growth), which shows the confidence from investors towards the future of Ethereum.
Derivatives Data
Bitcoin
• $539M liquidations in Bitcoin and Futures long liquidations dominance has dropped from 81% to 78%, which could be a sign of capitulation
• Future short liquidations increase, and the funding rate turns negative. A potential short squeeze could push Bitcoin prices up.
Ethereum
• $336M liquidations in Ethereum. Asset’s funding rate that has gone negative and Open interest has dropped – meaning traders could be capitulating and have closed out their positions.
Potential Market Triggers
Bitcoin
• More regulatory clarity from regulators after the crypto bill from Senator Lummis. The paper has built a foundation for future crypto regulation. Regulatory clarity can help crypto to be more accessible for retail and institutional investors.
• Another centralized lending platform BlockFi has reassured users their funds are safe. Celsius’s liquidity crisis does not represent other centralized platforms that will face the same issue.
Ethereum
• The merge helps Ethereum become less energy-intensive which can attract more institutional investors
• Continuous interest from institutions. A16z is launching a $4.5B crypto fund and Huobi launching a $1B investment arm. Huge interest in NFTs amid the crypto market crash. The NFT Market has seen a 54% increase in volume. Ethereum’s blue-chip NFT leads the chart, Bored Ape Yacht club hitting $5.8 million in sales on 13 June.
2) Neutral Case – Near the Bottom
Market Market Sentiment Indicators
Bitcoin
• NUPL* at -0.01 shows that the market hasn’t reached full capitulation. Based on the 2020 drawdown bottoming at -0.14 NUPL, the market could see further downside towards the level near -0.14 NUPL
• Bitcoin reserve risk is close to the level in 2020 (0.0011 vs. 0.0012)
Ethereum
• Daily transactions on Ethereum are at a similar level to the bottom in May 2021.
Derivatives Data
Bitcoin
• Open interest has dropped from $14.6B to $10.7B. While there are still a large number of outstanding contracts, we may see further volatility before we reach the bottom.
Ethereum
• Open interest has dropped from $5.9B to $4.7B. However, there is no significant sign of a decrease in the leverage ratio. Therefore, we may see more volatility before the leveraged positions get liquidated.
Potential Market Triggers
Bitcoin
• Nexo offers Celsius to buy their crypto asset. Users’ fund could be protected without crashing the market if Celsius accept the offer.
• Interest rate hikes. The Fed is likely to boost rates to 75 basis points, which would drive capital away from the crypto market and further towards safer-haven assets.
Ethereum
• The merge may postpone as developers delay the “difficulty bomb”*. The further selloff on $ETH and $stETH is due to uncertainty on the exact launch date of the merge.
3) Worst Case – Further Drawdowns
Market Market Sentiment Indicators
Bitcoin
• NUPL is trading 1% below the capitulation phase while 2020 bottomed at 14% below capitulation. Due to macro uncertainties, we may see NUPL drops lower than the 2020 level
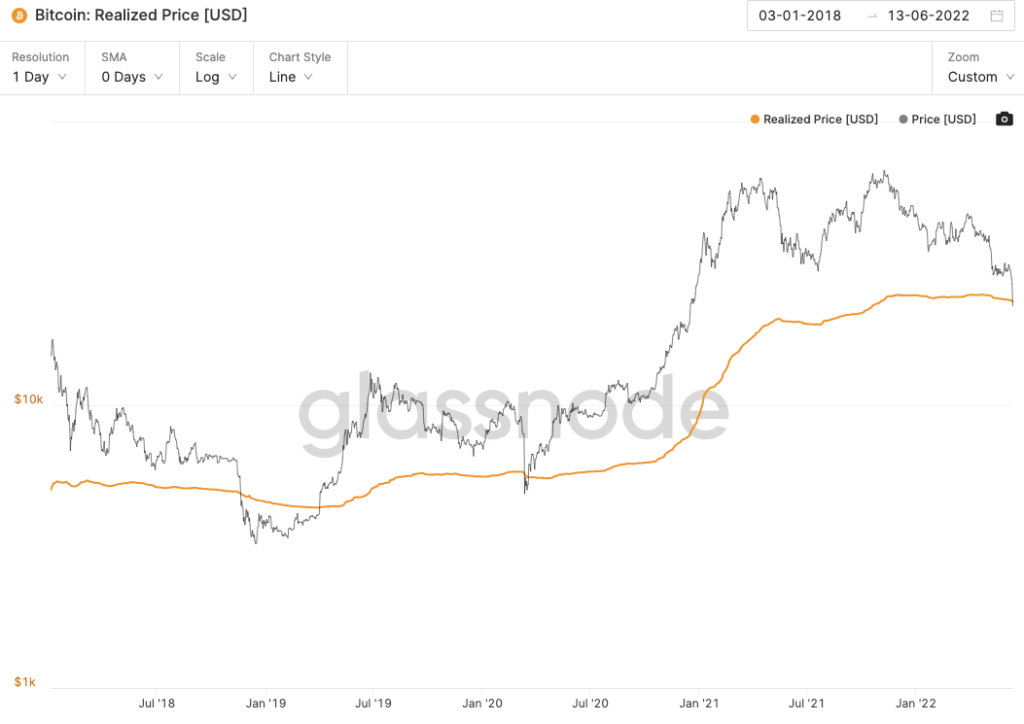
• The market bottomed in 2020 by trading 15% below the realized price, while the current
Bitcoin price is trading 3% below.*
Ethereum
• NUPL is trading -23% in the capitulation phase while 2020 bottomed at -91% level.
• Ethereum is trading 32% below its realized price while the 2020 market bottomed at 48% deviation from the realized price.
Derivatives Data
Bitcoin
• DVOL* has jumped from 75 to 106 from 12 – 14 Jun. The metric shows a 5.5% daily volatility of bitcoin. The high volatility indicates that Bitcoin has not yet capitulated and could have a further downside.
Ethereum
• Futures long liquidations dominance has no sign of decreasing, which may herald that the long traders have not yet capitulated.
Potential Market Triggers
Bitcoin
• Contagion of Celsius’s insolvency will lead to huge selling pressure and liquidations of their wrapped Bitcoin position
• Celsius’s partners, such as Nuri Banking, will also be affected if it goes bankrupt. Customers’ Bitcoin deposits may not be recovered.
• Tether has close ties with Celsius, including an investment in the company as well as lending on the platform.
• The depeg of $USDD* could lead to 14k Bitcoin selling pressure for saving the peg.
Ethereum
• Contagion of Celsius’s insolvency will also lead to selling pressure on $stETH. It will create a greater price deviation on stETH/ETH pair on Curve Finance. • A minor bug was found during the Ropsten testnet merge. The merge will be delayed to a later date. Exploits amongst DeFi protocols will also hurt Ethereum’s TVLand users’ confidence. 3 out of 5 largest DeFi hacks happened in 2022.
Metrics/Terms Description
• NUPL: Difference between Relative Unrealized Profit and Relative Unrealized Loss. NUPL below 0 indicates capitulation in the market
• Reserve Risk: Assess the confidence of long-term holders relative to the price via dividing the price of Bitcoin by the opportunity cost of holding the asset.
• Realized Price: Realized Cap divided by the current supply.
• DVOL: Measure the implied volatility in Bitcoin.
• TVL: Total Value Locked in DeFi.
• Difficulty Time Bomb: Increase the block difficulty, which will affect the merge if implemented before the merge is completed.
• USDD: An overcollateralized algorithmic stablecoin in the Tron ecosystem.
• stETH: Representation of underlying Ethereum that has been staked in Ethereum Beacon Chain – issued through LidoFinance
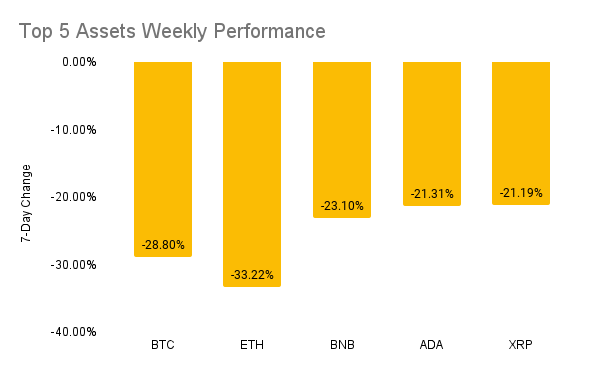
Weekly Returns
The returns of the top five cryptoassets over the last week were as follows — BTC (-28.8%), ETH (-33.22%), BNB (-23.10%), ADA(-21.31%), XRP (-21.19%).
Our View
Bitcoin and Ethereum are close to the bottom. Even though the price of Bitcoin and Ethereum have dropped 67% and 75% from all-time highs, they will be here to stay given the strong fundamentals and increasing use cases.
Referring to the NUPL chart for Bitcoin and Ethereum, we are close to the bottom by comparing the current NUPL level and the NUPL level during the bottom in 2020. We expect the NUPL level to bottom higher than in the previous cycles due to the higher lows formed from previous bottoming cycles.
Another metric that supports our view is the realized price of Bitcoin and Ethereum. Bitcoin is trading 3% below its realized price. By comparing to previous bottoms in 2019 and 2020, the market bottomed when Bitcoin was trading at 15% and 30% below its realized price. On the other hand, Ethereum is trading at 32% below its realized price. During market bottoms in 2018 and 2020, Ethereum traded at 48% and 67% below the realized price. Given an uptrend in the actual/realized price, we believe Bitcoin and Ethereum could dive lower but will not be at the same level of deviation from the realized price compared to previous cycles.
The potential event that can cause further drawdown of both markets is Celsius’s liquidity crisis. The firm has been using a liquid staking platform, Lido Finance, to provide returns for clients depositing their Ethereum. In return, Celsius received the liquid staking token, stETH, and used it as collateral to borrow stablecoins on several DeFi protocols to generate extra yield. However, the stETH token has recently deviated from the 1:1 peg with $ETH and caused a potential liquidation of Celsius’s position. Therefore, Celsius has been selling $320M crypto, including $WBTC and ETH, to repay the stablecoin loans. If $stETH continues to dive lower from the current exchange rate with $ETH, we may see a larger selloff in the crypto market as Celsius may potentially become insolvent. On the flipside, Nexo has offered to acquire Celsius’s assets so that Celsius will not have to liquidate their holdings and exacerbate the selling pressure.
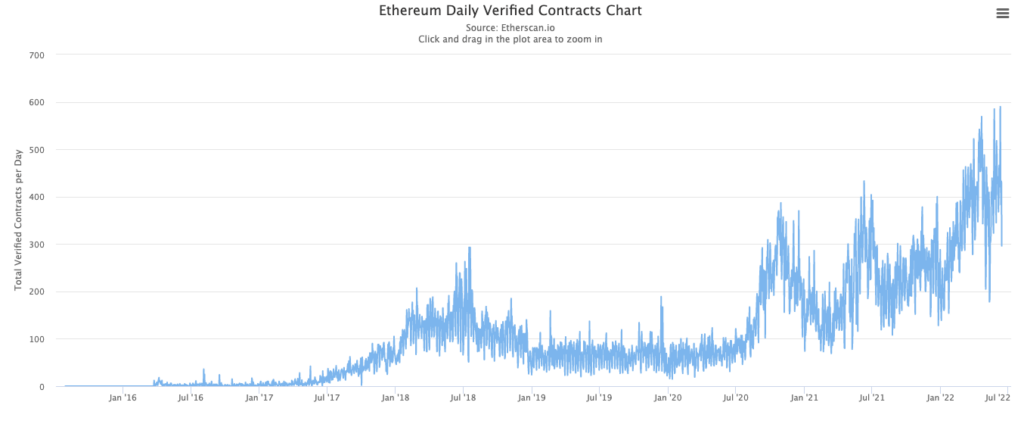
Despite the turbulence in the market, the fundamentals of Bitcoin and Ethereum continue to see steady growth. Bitcoin’s number of active addresses has experienced 26% YTD growth, with 2 countries adopting the asset as legal tender. As for Ethereum serving as a smart contract platform, the network attracted 4,000 monthly active open-source developers as of Jan 2022. The increasing number of developers also resonates with the steady growth in the number of daily smart contracts. As of 14 June, more than 3,300 applications were built on top of Ethereum. DeFi sector has been one of the key innovations in the crypto space. Ethereum has more than $50B TVL, and institutions are also tapping their toes into DeFi as we saw how Jane Street has used Clearpool to borrow $25M $USDC, while Tesla has used MakerDao to borrow $7.8M for real estate financing.
Research Newsletter
Each week the 21Shares Research team will publish our data-driven insights into the crypto asset world through this newsletter. Please direct any comments, questions, and words of feedback to research@21shares.com
Disclaimer
The information provided does not constitute a prospectus or other offering material and does not contain or constitute an offer to sell or a solicitation of any offer to buy securities in any jurisdiction. Some of the information published herein may contain forward-looking statements. Readers are cautioned that any such forward-looking statements are not guarantees of future performance and involve risks and uncertainties and that actual results may differ materially from those in the forward-looking statements as a result of various factors. The information contained herein may not be considered as economic, legal, tax or other advice and users are cautioned to base investment decisions or other decisions solely on the content hereof.


Nyheter
AI minskar gapet mot försvaret då flödena av europeiska tematiska ETFer når 13,1 miljarder dollar hittills i år

Flödena av europeiska tematiska UCITS-ETFer fortsätter att öka uppåt i takt med att investerare dras mot högt övertygande megatrender, med AI (Artificiell Intelligens), försvar, energi (specifikt uran) och Kinas internet och e-handel alla i ledande positioner.
Viktiga punkter
- AI minskar gapet på försvaret då flödena av europeiska tematiska ETFer når 13,1 miljarder dollar hittills i år
- Försvaret fortsätter att dominera under första till tredje kvartalet (+9,86 miljarder dollar)
- AI toppar nettoinflödena för augusti och september
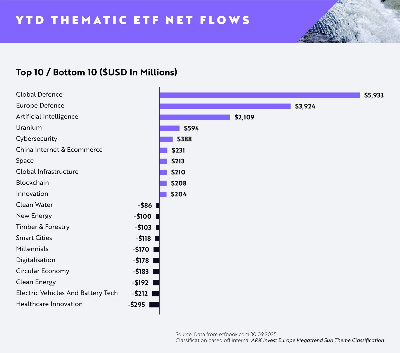
Globala försvars-ETFer fortsätter att leda flödena hittills i år (YTD) med +5,93 miljarder dollar i nettoflöden, med europeiska försvars-ETFer på andra plats med +3,92 miljarder dollar i nettoflöden.
Emellertid har ETFer inom artificiell intelligens sett en anmärkningsvärd ökning i efterfrågan sedan slutet av första halvåret 2025, med dominerande inflöden under augusti och september för att nå nästan +2,11 miljarder dollar i nettoflöden hittills i dag. Detta motsvarar en ökning med cirka 133 % i nettoflöden sedan slutet av första halvåret jämfört med Global Defence på +23 % och European Defence på 29 %.
Investerarnas aptit för försvar är fortsatt stark då geopolitiska risker och moderna krigföringskrav driver strukturella medvindar för sektorn. Försvarsentreprenörer i framkant inom avancerad flyg- och rymdteknik, cybersäkerhet och drönarteknik tar en växande andel av de globala upphandlingsbudgetarna.
I Europa är allokeringarna fortfarande höga då regeringar över hela kontinenten reagerar på nya säkerhetsrealiteter med ökade utgiftsåtaganden. Investerare verkar fokuserade på lokala ledare med exponering mot underrättelsesystem, försvarselektronik och strategisk tillverkning.
Den ökade efterfrågan på ETFer inom artificiell intelligens visar att innovationstakten inom generativa modeller och företags-AI fortfarande är en viktig magnet för kapital. Investerare föredrar plattformar med skalbar AI-infrastruktur och exponering mot verkliga applikationer inom programvara, halvledare och robotteknik.
På andra håll rankades uran-ETFer på fjärde plats med +594 miljoner dollar i nettoflöden, medan cybersäkerhets-ETFer rankades på femte plats med +388 miljoner dollar. Båda teman fortsätter att attrahera kapital tack vare tydliga men hållbara drivkrafter: uran från den förnyade satsningen mot kärnkraft i övergången till ren energi och cybersäkerhet från eskalerande digitala hot och växande efterfrågan på motståndskraftig infrastruktur.
Rahul Bhushan, VD och global chef för investeringsprodukter på ARK Invest, kommenterade flödena: ”Investerare ompositionerar sig aktivt mot innovationsdrivna, strukturellt drivna teman i en föränderlig makromiljö. Med geopolitiska risker, genombrott inom generativa modeller och AI-ledd innovation uttrycker investerare starka åsikter om megatrender snarare än breda, odifferentierade exponeringar. Det är tydligt att tematiska ETFer inte längre bara är taktiska satsningar, de är centrala strategiska exponeringar.”


HANetfs Hector McNeil förklarar hur ETFer genererar hög avkastning med covered calls

JPEY ETF högavkastande företagsobligationer vautasäkrade till Euro

AI minskar gapet mot försvaret då flödena av europeiska tematiska ETFer når 13,1 miljarder dollar hittills i år

XMME ETF – Levler MSCI EM by Xtrackers

34GI ETF bara eurodenominerade företagsobligationer med förfall 2024

De bästa lågvolatilitets ETFer på marknaden

Fokus mot en helt ny börshandlad produkt i september 2025

M5TYs senaste utdelningstakt (55 %) belyser covered call-strategins inkomstpotential
Could Bitcoin be the key to your dream house?

Börshandlade fonder för europeiska small caps
-
 Nyheter4 veckor sedan
De bästa lågvolatilitets ETFer på marknaden
-
 Nyheter3 veckor sedan
Fokus mot en helt ny börshandlad produkt i september 2025
-
 Nyheter4 veckor sedan
M5TYs senaste utdelningstakt (55 %) belyser covered call-strategins inkomstpotential
-

 Nyheter4 veckor sedan
Could Bitcoin be the key to your dream house?
-
 Nyheter3 veckor sedan
Börshandlade fonder för europeiska small caps
-

 Nyheter2 veckor sedan
Levler noterar ytterligare fyra börshandlade fonder i Sverige
-
 Nyheter4 veckor sedan
The Investment Case for TLT (Long-Dated Treasury Bonds)
-

 Nyheter3 veckor sedan
Miners Find Their Mojo as Gold Consolidates