
Nyheter
Rymdfonder landar vid rätt tidpunkt

Virgin Galactic skapade historia förra söndagen genom att skjuta upp de första passagerarna, inklusive miljardärgrundaren Richard Branson, i rymden. Denna händelse markerar ett stort steg framåt för den växande rymdturismen. Det är därför rymdfonder landar vid rätt tidpunkt.
Även om Virgin Galactic avbröt biljettförsäljningen efter en dödlig olycka 2014 som resulterade i designförändringar av rymdfarkosten, har många redan betalat upp till 250 000 dollar för att säkra sina biljetter på en framtida resa. Företaget planerar att återuppta biljettförsäljningen senare i år.
Det hittills aktuella diagramet liknar rymdflygning efter att ha kraschat till negativt territorium i april och maj. SPCE (Virgin Galactics ticker) har ökat med nästan 34% jämfört med 16,7% för S&P 500.
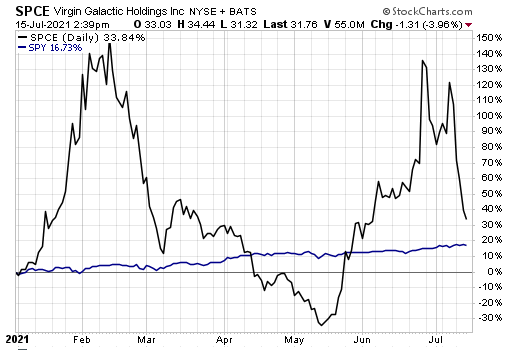
Källa Stockcharts.com
Olika rymdfonder
Flera ETF:er erbjuder exponering för denna innovativa industri och har fått stöd av SPCE:s meteoriska uppgång i år. Procure Space ETF (UFO) spårar ett nivåviktat index för flygindustrin som ligger globalt och var den första fonden som erbjuder ren exponering för rymdindustrin.
SPDR S&P Kensho Final Frontiers ETF (ROKT) erbjuder exponering för aktier som är involverade i rymdutforskning såväl som djuphavet. Cirka 65% av portföljen allokeras till företag som enbart är involverade i utforskning av rymden, medan 5% erbjuder exponering för företag som enbart är involverade i djuphavsutforskning. De återstående 30% av portföljen tilldelas företag som är involverade i båda branscherna.
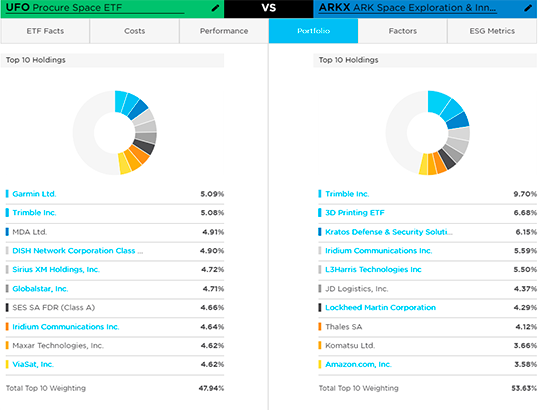
ETF-jämförelsesverktyget belyser likheterna och skillnaderna mellan dessa rymdfonder. ROKT var först på marknaden och lanserades i oktober 2018, men UFO har samlat nästan sex gånger så mycket tillgångar trots sin högre avgift. UFOs europeiska motsvarighet heter YODA ETF.
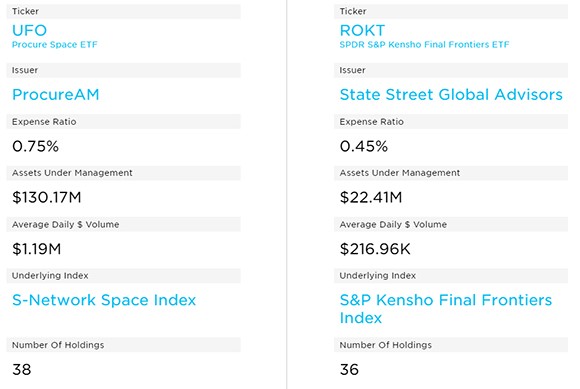
Båda ETF:erna är ganska koncentrerade, med mindre än 40 innehav och cirka 40% eller mer innehas av de tio bästa namnen. Endast två av de tio bästa innehaven överlappar varandra mellan dessa rymdfonder.
Olika sätt att definiera universum
UFO och ROKT erbjuder båda exponering för företag som är involverade i utforskning av rymden, men var och en har sitt eget sätt att definiera vad det betyder. UFO investerar huvudsakligen i företag som får minst hälften av sina intäkter eller vinster från ett eller flera segment av rymdindustrin.
ROKTs rymdrelaterade innehav härrör från S&P Kensho Space Index, som spårar företag som producerar produkter och tjänster som möjliggör rymdresor och prospektering, eller som är involverade i leveranskedjan för dessa produkter och tjänster.
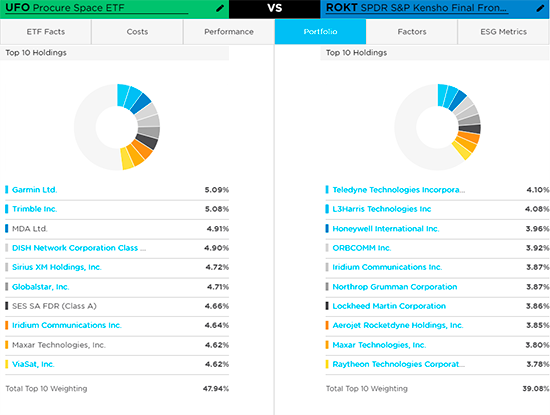
De resulterande portföljerna är helt olika, med ROKT som innehar 56% av portföljen inom flyg- och försvarsnamn. Även om företag i denna bransch är involverade i skapandet av produkter och tjänster som möjliggör utforskning av rymden, är det inte nödvändigtvis huvudfokus för deras verksamhet. Detta innebär att prisrörelser kan drivas av andra faktorer som förändringar i försvarsutgifterna.
UFO: s fokus på företag som får de flesta av sina intäkter från rymdrelaterade industrier innebär att det har en högre viktning i företag som arbetar med satellitkommunikationsteknik. I synnerhet ett innehav, Globalstar (GSAT), har stigit med 331% i år, vilket har ökat UFO:s värde under det senaste året.
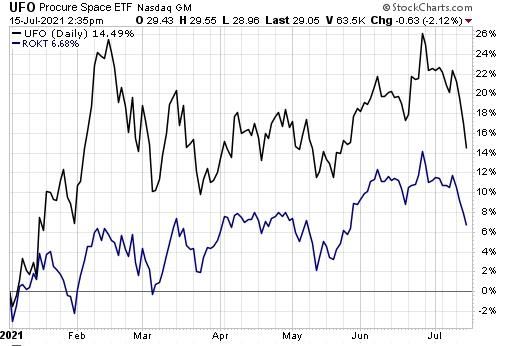
Källa Stockcharts.com
ARK erbjuder aktivt alternativ
Även om UFO var den första pure-play rymd-ETF, lanserades ARK Space Exploration & Innovation ETF (ARKX) tidigare i år, med djärv väg där ingen ETF-emittent har gått tidigare. ARKX är den första aktivt förvaltade fonden som riktar sig mot rymdutforskningsindustrin.
ARKX och UFO har båda en årlig förvaltningskostnad på 0,75%. Trots ARKXs nykomlingsstatus har den fått se sina tillgångar öka i hög hastighet och samlat över 600 miljoner dollar sedan mars. Fondens storlek ger den en fördel när det gäller kostnader med en genomsnittlig spread på 0,06% mot UFO:s 0,24%.
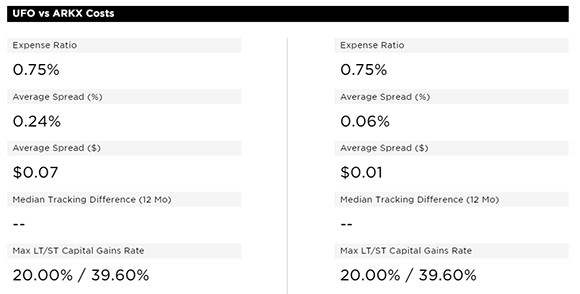
ARKX är också en mycket koncentrerad portfölj med över hälften av portföljen i topp 10. Mellan UFO och ARKX överlappar bara två namn inom de 10 bästa innehaven. Virgin Galactic är inte en av dem. Den 12 juli innehades inte aktien i ARKX-portföljen.
ARKXs val att inte hålla Virgin Galactic på måndagen var en fördel. Dess aktiekurs sjönk mer än 17% på en dag efter att företaget meddelade att det skulle sälja upp till 500 miljoner dollar i stamaktier. Handeln med aktien stoppades till och med kort på grund av volatilitet.
Men med tanke på ARKXs resultat sedan starten har fondens aktiva mandat hittills inte adderat ett mervärde. Sedan starten har fonden tappat 1,4%, jämfört med en 3,2% vinst för UFO under samma tidsram.
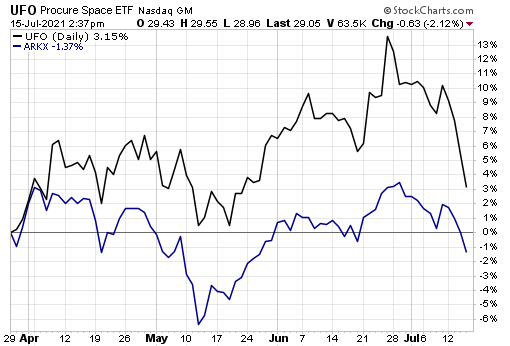
Källa: StockCharts.com
” till oändligheten … och vidare! ”
Även om rymdrelaterade ETF:er redan har haft en bra utveckling i år, är utsikterna fortfarande ljusa. Morgan Stanley förutspår intäkterna från den globala rymdindustrin från den nuvarande nivån på 350 miljarder dollar till 1 biljon dollar fram till 2040.
Morgan Stanley förutspår att de viktigaste möjligheterna kommer från bredbandsinternet via satellit, vilket utgör 50% av den beräknade tillväxten i rymdekonomin.
Som med alla tematiska ETF:er måste investerare se bortom namnet. Att bedöma hur olika rymdfonder eller det index den spårar definierar universum är avgörande för att förstå vilka faktorer som kan driva resultat framöver. Om Morgan Stanleys förutsägelse går ut kan UFO leva länge och blomstra med starka konkurrerande ETF:er som rider precis bakom.
Handla YODA
Procure Space UCITS ETF är en europeisk börshandlad fond är en europeisk börshandlad fond som handlas på flera olika börser, till exempel Borsa Italiana, Deutsche Boerse Xetra och London Stock Exchange. Av den anledningen förekommer olika kortnamn på samma börshandlade fond.
Det betyder att det går att handla andelar i denna ETF genom de flesta svenska banker och Internetmäklare, till exempel DEGIRO, Nordnet och Avanza.
Handla ARKX
ARK Space Exploration & Innovation ETF (CBOE: ARKX) finns endast att handla i USA. Av den anledningen finns den inte i utbudet hos svenska nätmäklare. IG erbjuder erbjuder emellertid handel i ARK Space Exploration & Innovation ETF (CBOE: ARKX)
Handla ROKT
SPDR S&P Kensho Final Frontiers ETF (ROKT) finns endast att handla i USA. Av den anledningen finns den inte i utbudet hos svenska nätmäklare. IG erbjuder erbjuder emellertid handel i SPDR S&P Kensho Final Frontiers ETF (ROKT)
Handla UFO
Procure Space ETF (UFO) finns endast att handla i USA. Av den anledningen finns den inte i utbudet hos svenska nätmäklare. IG erbjuder erbjuder emellertid handel i Procure Space ETF (UFO).


The UK is shaking up crypto. This month, the Financial Conduct Authority (FCA) proposed lifting its ban on crypto exchange-traded notes for retail investors, a positive step in a global race to regulate digital assets and provide consumer protection.


Key metrics show Bitcoin’s rally isn’t over
Bitcoin is above $100K, and key indicators suggest a growing momentum and a potential for further upside. The Bitcoin Fear & Greed Index sits at 62, reflecting a sentiment that remains near neutral. This lack of extreme greed suggests that the rally may still have room to run in the near term.


Apple wants to enter Circle’s orbit. Why are stablecoins the tech world’s new darling?
Stablecoin issuer Circle made a blockbuster debut on the New York Stock Exchange earlier this month. Now, tech giants like Apple, Meta, and Google are reportedly exploring stablecoin integrations, marking another major step toward merging digital assets with mainstream technology.


Research Newsletter
Each week the 21Shares Research team will publish our data-driven insights into the crypto asset world through this newsletter. Please direct any comments, questions, and words of feedback to research@21shares.com
Disclaimer
The information provided does not constitute a prospectus or other offering material and does not contain or constitute an offer to sell or a solicitation of any offer to buy securities in any jurisdiction. Some of the information published herein may contain forward-looking statements. Readers are cautioned that any such forward-looking statements are not guarantees of future performance and involve risks and uncertainties and that actual results may differ materially from those in the forward-looking statements as a result of various factors. The information contained herein may not be considered as economic, legal, tax or other advice and users are cautioned to base investment decisions or other decisions solely on the content hereof.


SGS5 ETP spårar priset på silverterminer

GIGU ETF investerar aktivt i USD-denominerade företagsobligationer
UK looking to lift the retail ban on crypto ETPs

AMEM ETF, de ledande aktierna från tillväxtmarknaderna i en enda transaktion
21Shares noterarar fem nya krypto-ETPer Nasdaq Stockholm

Montrose befäster sin position som den populäraste ETFen

BNP Paribas Asset Management lanserar Europe Defense ETF

Global X noterar Europafokuserad försvarsfond

Kommer Nordea att lansera nya börshandlade fonder?
Nu introduceras fem nya europeiska börser på Nordnet – courtagefri handel under maj
-
 Nyheter3 veckor sedan
Montrose befäster sin position som den populäraste ETFen
-
 Nyheter3 veckor sedan
BNP Paribas Asset Management lanserar Europe Defense ETF
-
 Nyheter4 veckor sedan
Global X noterar Europafokuserad försvarsfond
-
 Nyheter3 veckor sedan
Kommer Nordea att lansera nya börshandlade fonder?
-

 Nyheter4 veckor sedan
Nu introduceras fem nya europeiska börser på Nordnet – courtagefri handel under maj
-

 Nyheter3 veckor sedan
BlackRock lanserar europeisk försvars-ETF för europeiska investerare
-
 Nyheter4 veckor sedan
YieldMax™ tillkännager första utdelningen för YYYY
-
 Nyheter4 veckor sedan
Rivstart för Montrose ETF-satsning!