
Nyheter
Overweight industrial metals and underweight energy

ETF Securities Portfolio Insights: Overweight industrial metals and underweight energy
Highlights
- For the third quarter 2017, our equity model suggests increasing allocation in US large caps and French equities while underweighting emerging market stocks mainly.
- The bond model proposes keeping the weights unchanged compared to the benchmark while our contrarian model on commodities underweights energy, overweighting industrial metals, precious metals and livestock.
- Our tactical portfolio outperformed the strategic and the 60/40 benchmarks by 0.9% and 0.5% per year respectively, improving the Sharpe by 36% on average.
Political uncertainties around the world have started to fade. However, centres of tension remain as criticisms over the Trump presidency are growing and as the US economic growth may be near peak. While the French and Dutch elections have defeated the risk of a populist victory, the Brexit negotiations remain full of uncertainties. The UK is unlikely to find in the US the trade partner it is seeking for. The country went through a tough test in early June as the Conservative party lost its majority during the general election. While market volatility is still at its lowest level ever, inflation is gradually rising in the US, EU and UK, increasing the risk of central bank policy errors.
Q3 2017 positioning
In Q2 2017, the market volatility index (VIX) fell below its lower band (-1x standard deviation), indicating that the level of risk on the equity market is low and that investors can have a higher allocation to equities (55%) compared to bonds (35%) similar to the strategic benchmark. For Q3 2017, volatility rose above its lower band making the tactical portfolio switch back to a more balanced split at 45% each. Commodities remain at 10% in both strategic and tactical portfolios.
Within the equity space, we have amended our model as we found, in our note Momentum for short-term tactical play, CAPE for the longer run, that the mean reversion strategy underneath the traditional CAPE (Cyclically Adjusted Price to Earning) valuation model based on 10 years earnings period works best when the investment horizon is longer than 4 years. For shorter investment horizons, such as in the tactical portfolio, a momentum strategy using a version of the CAPE indicator based on a shorter earning period of 5 years instead of 10 provides better results. For Q3, the model therefore suggests overweighting US large caps, France, Spain, the Netherlands and Denmark as valuations of these countries remain elevated compared to the 5-year medians of their real earnings. Valuations peaked in mid-2014 and abated until early 2016, before rising again. At the other end of the spectrum, the model reduces its allocation in Brazil, Russia, Italy, South Africa and Mexico. Italy shows the largest differential between its CAPE ratio and its 5-year median, reflecting its troublesome banking sectors and political instability with a potential new election next year. The domestic equity market is likely to remain undervalued as long as these risks remain unsettled.
The below table highlights how our tactical positions have changed for the past three quarters compared to the strategic benchmark and our new positions for this quarter.

(click to enlarge)
For Q3 2017, the bond model suggests to remain neutral in all categories. This contrasts with the second quarter where the model was overweighting all of them as inflation expectations and interest rate expectations in the US and the EU were signalling a turning point. The CDS (Credit Default Swap) of each bond continues to hover around its historical average.
Our commodity contrarian model, for Q3, is reducing the weight of all energy commodities except WTI crude and is taking a short exposure to Brent and gasoline. This is in line with our view that oil will continue to trade range between US$40/bbl. and US$55/bbl. as the attempt from the OPEC and non-OPEC agreement to restrain the increase in global oil production continues. On the other hand, the model is increasing its allocation in copper, zinc and lead, and is taking a short exposure to aluminium and tin. Fundamentals should remain price supportive as copper is likely to end this year in deficit for the ninth consecutive year. The model is also shifting from underweight all precious metals except palladium in Q2 to overweight palladium only in Q3, taking a short exposure to palladium at the same time as we see the price rally was overdone. Lastly, the model is increasing the weight of live cattle and is taking a short exposure to corn and lean hogs.
Portfolio performance
The tactical portfolio has the lowest level of volatility compared to the balanced 60/40 portfolio, and the strategic benchmark, improving the Sharpe ratio to 0.61 compared to 0.51 for the 60/40 and 0.40 for the strategic portfolio.

(click to enlarge)
The tactical portfolio outperforms the 60/40 and the strategic benchmarks by 0.5% and 0.9% per year since January 2005.

(click to enlarge)
Each asset class in the tactical portfolio also outperforms its equivalent in the 60/40 and strategic benchmarks. The bond component outperforms by 0.5% on average, the equity by 0.3% and the commodity by 4.5%, illustrating the efficiency of our fundamental-based models in improving the risk/return profile of the asset class as well as the tactical portfolio.
In addition, the tactical portfolio provides higher protection from the downside risk with a maximum drawdown of -25.4% compared to -33% for the 60/40 and -37% for the strategic benchmark.
Finally, the portfolio recovers faster to its previous peak (2 years versus around 3 years for both benchmarks).
Portfolio methodologies
Our strategic benchmark follows a long-only strategy with 60 investments across three asset classes: commodities (25), equities (28) and bonds (7). As illustrated below, the initial weights are based on the weighting methodology of:
• The Bloomberg Commodity Index for commodities
• The MSCI AC World Index for equities
• The Barclays bond indices for bonds

(click to enlarge)
For more information contact:
ETF Securities Research team
ETF Securities (UK) Limited
T +44 (0) 207 448 4336
E info@etfsecurities.com
Important Information
This communication has been issued and approved for the purpose of section 21 of the Financial Services and Markets Act 2000 by ETF Securities (UK) Limited (“ETFS UK”) which is authorised and regulated by the United Kingdom Financial Conduct Authority (the “FCA”).


During and after the US market close on Friday, cryptocurrency markets experienced their largest liquidation event on record, with an estimated USD 19 billion in leveraged positions unwound across futures and perpetual swap markets.
What Happened
The selloff began following President Trump’s announcement of an additional 100% tariff on Chinese imports, a move that triggered a sharp risk-off reaction across global markets. U.S. equities had their worst session since April, and with traditional markets closed for the weekend, crypto became the only major market still open for price discovery.
Nearly 90% of liquidations were long positions, underscoring how leveraged bullish sentiment had become across digital assets.
By asset:
• Bitcoin (BTC) saw over $5 billion in positions liquidated, falling roughly 12.5% intraday, from highs of ~$122,600 to lows near $107,000.
• Ethereum (ETH) recorded around $4 billion in liquidations, declining more than 20% from $4,400 to ~$3,500.
• Solana (SOL) experienced $1.8 billion in liquidations and dropped as much as 22% before recovering some ground.
While Bitcoin’s percentage price decline is in line with historical shocks, and only took the price back to where it was two weeks ago, it was a three-standard deviation move vs the past three years during which the asset saw broader institutional adoption. Moreover, the episode represents the largest forced liquidation event in crypto’s history in both size and concentration of long positions.
Liquidity Dynamics: The Perfect Storm
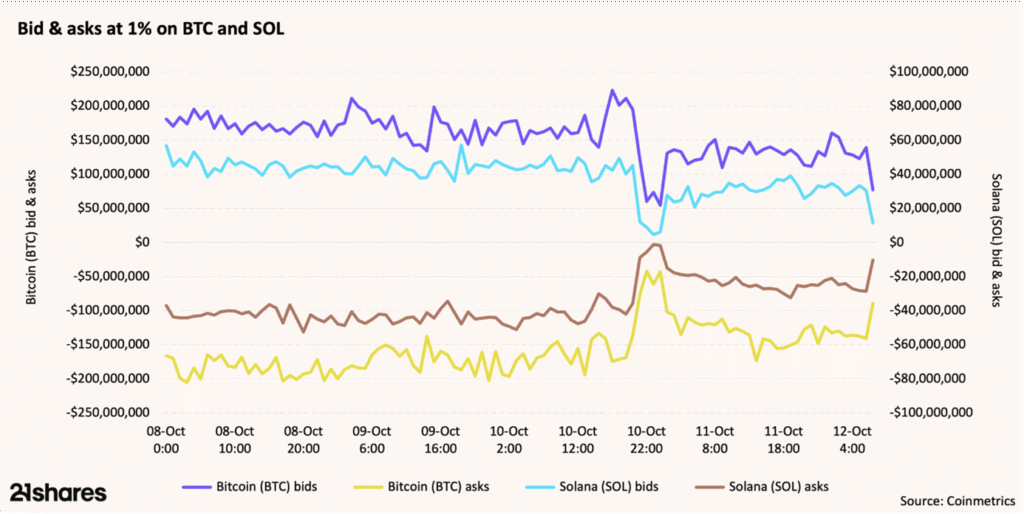
The scale of the move was amplified by fragile liquidity across both spot and derivatives markets. Order books were thin heading into the weekend, leaving markets especially vulnerable to shocks.
The timing compounded the impact:
• The announcement hit just after the U.S. cash equity close and before a long weekend (Columbus Day), when liquidity naturally declines.
• With most global asset classes offline, crypto became the only outlet for risk repricing.
• As liquidity thinned, automated liquidations triggered a domino effect across exchanges.
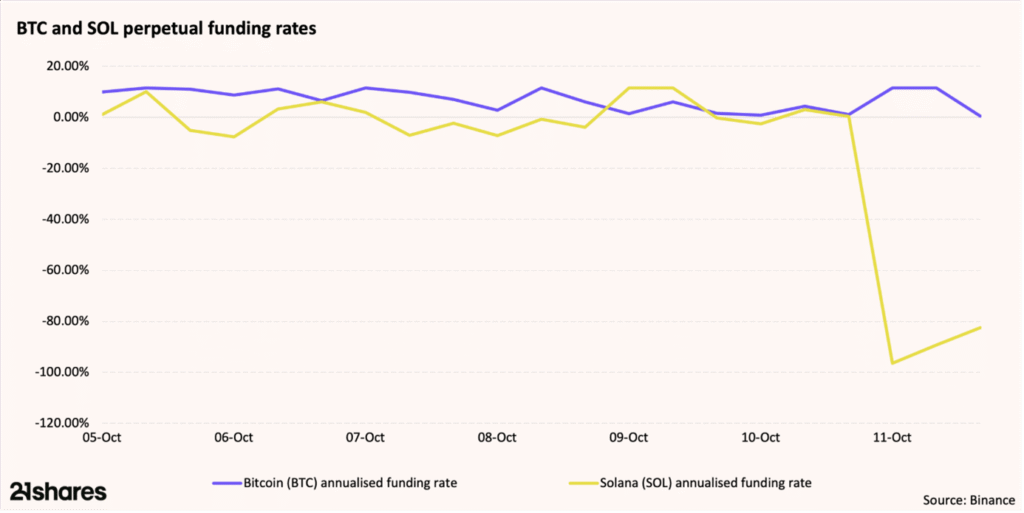
Funding rates flipped sharply negative—particularly in Solana—signaling an abrupt pivot from leveraged longs to short positioning. In some altcoins, liquidity deteriorated so severely that price wicks reached near-zero levels before stabilizing.
Complicating matters, several major exchanges experienced infrastructure strain as trading volumes surged over 140% to ~$180 billion in a matter of hours. APIs froze, oracles glitched, and order books briefly went dark. This led to mispriced liquidations and system-wide stress, highlighting again that crypto’s operational fragility often lies not in blockchains themselves, but in the centralized trading infrastructure that sits around them.
What We’re Hearing from the Market
Market participants describe Friday’s events as a systemic deleveraging that caught even sophisticated funds off guard. Several leveraged traders and funds reportedly suffered heavy losses, and rumors persist of at least one major market maker being forced to unwind positions.
Some internal exchange estimates suggest total liquidations—including unreported DeFi exposures—could approach USD 30 billion once weekend trading is fully accounted for.
Volatility spiked dramatically, with Bitcoin implied volatility reaching levels not seen since the FTX collapse. While unsettling, such spikes are often short-lived and tend to normalize as market depth recovers.
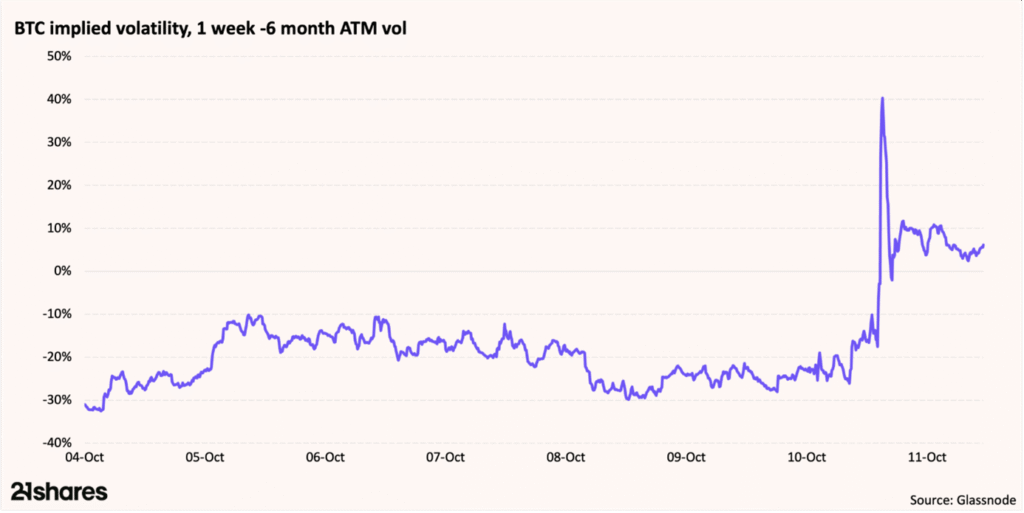
Source: Glassnode
Looking Ahead
Despite the record size of liquidations, the price impact was moderate by historical standards, with Bitcoin’s drawdown smaller than those seen during prior major deleveraging events. Markets had been trading at all-time highs just days earlier, so a correction of this magnitude is not entirely unexpected.
So far, crypto markets appear to be stabilizing, though volumes remain light and sentiment cautious.
Key areas we’re watching in the near term include:
• Asian equity and futures markets as they reopen Monday, which may influence crypto sentiment.
• CME futures basis and funding rates as indicators of capital flows and arbitrage activity.
• Ethereum staking queues, which could become further stretched if the selloff continues.
Historically, large-scale liquidation events have been followed by periods of consolidation lasting one to two months before recovery. The previous two major liquidation cycles saw drawdowns of 19–24% over ~60 days, with full recovery typically taking three to five months.
Currently, Bitcoin funding rates remain within normal ranges, suggesting arbitrage desks continue to operate efficiently. However, with Solana’s funding still deeply negative, we could see a short squeeze if sentiment turns and liquidity returns.
Our View
While last week’s events highlight ongoing structural fragilities—particularly in leverage and centralized infrastructure—they also demonstrate that core blockchain networks remained resilient throughout.
For investors, this underscores the value of crypto exposure via regulated, physically backed ETPs over leveraged trading venues, where forced liquidations and operational risks can amplify volatility.
Overall, we view the selloff as a healthy, if painful, reset of speculative excess. As macro uncertainty persists, disciplined position sizing and diversification across regulated products remain key.
Research Newsletter
Each week the 21Shares Research team will publish our data-driven insights into the crypto asset world through this newsletter. Please direct any comments, questions, and words of feedback to research@21shares.com
Disclaimer
The information provided does not constitute a prospectus or other offering material and does not contain or constitute an offer to sell or a solicitation of any offer to buy securities in any jurisdiction. Some of the information published herein may contain forward-looking statements. Readers are cautioned that any such forward-looking statements are not guarantees of future performance and involve risks and uncertainties and that actual results may differ materially from those in the forward-looking statements as a result of various factors. The information contained herein may not be considered as economic, legal, tax or other advice and users are cautioned to base investment decisions or other decisions solely on the content hereof.


Crypto market update: record liquidations amid tariff shock

Hur investera i Blockchain med hjälp av börshandlade fonder

XTMT ETF ger exponering mot aktier från Taiwan

Handla WisdomTrees ETFer utan courtage hos SAVR

XDPU ETF – Levler S&P 500 by Xtrackers

HANetf och Infrastructure Capital Advisors samarbetar för att lansera aktivt förvaltad preferensavkastnings-ETF i Europa

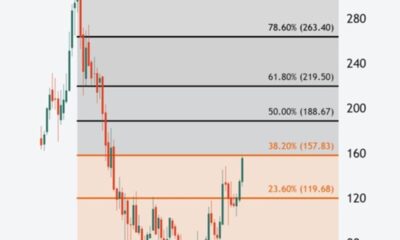
Vägen tillbaka till rekordnivåer är kantad av Fibonacci-motståndsnivåer

IN0A ETF spårar S&P 500 med fokus på företag med höga ESG-betyg

YSLV ETP ställer ut köpoptioner på silver för att skapa en löpande avkastning

De bästa lågvolatilitets ETFer på marknaden
-
 Nyheter4 veckor sedan
HANetf och Infrastructure Capital Advisors samarbetar för att lansera aktivt förvaltad preferensavkastnings-ETF i Europa
-
 Nyheter4 veckor sedan
Vägen tillbaka till rekordnivåer är kantad av Fibonacci-motståndsnivåer
-
 Nyheter4 veckor sedan
IN0A ETF spårar S&P 500 med fokus på företag med höga ESG-betyg
-
 Nyheter4 veckor sedan
YSLV ETP ställer ut köpoptioner på silver för att skapa en löpande avkastning
-
 Nyheter3 veckor sedan
De bästa lågvolatilitets ETFer på marknaden
-

 Nyheter4 veckor sedan
PLTY ETP utfärdar optioner mot aktier i Palantir
-

 Nyheter4 veckor sedan
Time in Bitcoin beats timing Bitcoin
-

 Nyheter4 veckor sedan
Investera i NEAR med en börshandlad produkt