
Nyheter
Outlook 2015 Global Recovery to Drive Cyclical Assets

Outlook 2015 Global Recovery to Drive Cyclical Assets
Summary
Cyclical asset exposures will give the best investment opportunities in 2015 on the back of the increasing momentum of the global economic recovery. While the recovery will be led by the US and emerging Asia, it will be gradual and not likely to be a straight line. Numerous risks remain, particularly the growth and deflation threats for the Eurozone and Japan, alongside the fading economic momentum in the UK economy. Accordingly, those commodities and currencies poised to benefit from US and Chinese growth are likely to be the main beneficiaries in 2015. Our favoured assets are cyclical commodities like industrial metals and energy and the US Dollar.
COMMODITIES IN 2015 – CYCLICAL COMMODITIES TO OUTPERFORM
Economic recovery to support cyclical commodity demand. Cyclical commodities are likely to be the main beneficiaries of the ongoing rise of economic activity in the US and China in 2015. With China continuing to stimulate its economy and budgeting for more commodity-intensive infrastructure spending we believe the outlook for cyclical commodities looks strong.
Local governments in China were reluctant to make large spending decisions in 2014 because of the central government’s clampdown on the use of third-party funding vehicles. Now that local governments are able to borrow under their own name, we believe commodity-intensive infrastructure spending will accelerate in 2015. Commodity performance has lagged traditional economic activity indicators like the US leading index amongst others, and we expect this to mean revert.

Supply likely to become constrained if price weakness persists. With so many commodities trading at or below their marginal cost of production, we believe that unless we see price increases, production will eventually be cut. While in the shortterm companies and mines can continue to produce even if prices are trading below marginal costs, it is not sustainable in the long-term. Unprofitable operations will have to be shut down or downsized, reducing production to contain costs. In turn, tighter supply will drive better price performance. We expect the recent correction in commodity prices to be transitory and believe commodities are attractively valued at current levels.
Most of the factors that have hit commodity prices over the past months are temporary, and we believe the price correction creates tremendous opportunities for medium to long-term investors.

Geopolitical risk and supply disruptions will remain in focus in 2015. While the geopolitical environment remains tense in a number of regions, and likely to weigh on the economic outlook, it is likely to be a supportive influence for a number of commodities. Demand for defensive assets like gold, primarily as a portfolio hedge will likely remain resilient, in view of the global risks, especially with the price of this hedge so close to the marginal cost of production. In our central scenario, we don’t expect geopolitical risk to significantly interfere with continued economic growth and the demand for cyclical assets.
At the same time, geopolitical risks could cause supply disruptions across a number of commodities particularly the Platinum Group Metals (PGMs) and oil. While supply remains abundant across most commodity sectors, contributing to price weakness, we feel that the most aggressive supply forecasts have already been priced in.

Supply shocks have played a central role in the metal sector in 2014, with South Africa suffering a 5-month long strike and Indonesia introducing an ore export ban. Significant production is located in emerging markets, which makes supply consistency an ongoing uncertainty. Supply disruptions are quite common in the commodity space and they are likely to continue to be a key driver of prices in 2015. Industrial metal and precious metal markets should also benefit from continued growth in Chinese demand (we feel that the negativity over a Chinese slowdown is overdone), and supply not achieving growth expectations of the market. As noted above, a worsening geopolitical outlook could also moderate some of the supply expectations for commodities, particularly in the energy and metals sectors, helping lift prices in 2015. The recent price weakness reflects transitory investor capitulation and we believe that a broad range of commodity markets appear attractively priced, particularly those linked to a cyclical upswing.
PRECIOUS METALS
Industrial precious metals to outperform. We expect the strengthening of economic growth in US and China to support the demand for the more industrial precious metals in 2015, with palladium, platinum and silver the key beneficiaries in our view. PGMs, particularly palladium, will likely remain the best performing precious metals as increasing loadings for emission controls, notably in emerging markets, will provide support to prices. While persistent weakness in the Eurozone and in Japan is likely to weigh to some degree on platinum and silver prices in HY1 2015, we expect those metals to experience a partial recovery in HY2 2015.
Platinum and Palladium
Tight supply and improving demand fundamentals will continue to benefit PGMs. Given the geographical
concentration of PGM supply, issues such as government intervention, geopolitical instability, unreliable infrastructure and social tensions in South Africa and Russia have the potential to substantially disrupt production for prolonged amounts of time, in turn significantly impacting prices. South Africa is well known for the elevated level of worker activism and government intervention in the mining industry, which have substantially affected production in the past, with this year’s 5-month strike further corroborating this issue. Russia has also contributed to the general uncertainty around PGMs supply, first with its secrecy over the status and amount of Gokhran’s (the stateowned precious metals repository) palladium stocks and more recently with the tensions surrounding the Ukraine.
PGM markets are expected to be in deficit in 2014 (13% for platinum and 15% for palladium), and those deficits are forecast to deepen even further in 2015. A 5-month strike in South Africa last year, coupled with flat mine supply from Russia, have substantially reduced the amount of platinum and palladium available on the open market. However, demand fundamentals favoured palladium over platinum in 2014 and this trend is likely to persist into 2015. While autocatalyst demand has held up quite well considering continued weakness in the Eurozone, platinum’s biggest autocatalyst market, overall demand for platinum turned out to be substantially lower than expected, especially in the jewellery sector. China, the biggest single contributor to platinum demand, imported 19% less platinum in the first 10 months of 2014, as jewellery demand faltered.
Meanwhile, palladium demand surprised on the upside. Strong auto sales in the US and China, the two biggest markets for gasoline cars, coupled with a pick-up in investment interest in the metal buoyed demand.

Going into 2015, we expect palladium to continue to outperform platinum. While we believe that platinum price will return to trade above the US$1,300oz level, palladium appears to be in a better position to benefit from a pick-up in China and US economic growth, the two biggest global auto markets.
We expect demand for autocatalysts to remain strong in 2015 and target a palladium price of US$900oz in H1 2015.
Silver
US policy normalisation to drive silver price higher. After falling to the lowest level in over five years, near US$14/oz, after Swiss voters rejected a proposal to boost central bank gold reserves, silver price has recovered slightly and it is now trading around US$16/oz. Historically, silver volatility has tended to track US Dollar volatility, a product of silver’s historical use as a monetary metal and its strong links to gold.
After falling below 10% earlier in the year, silver volatility has been driven higher by the rising US Dollar volatility and it is now standing above 35%.

Over the past decade, there have been six occasions where silver volatility has spiked above the 50% level. This 50% level is based on the annualised variation in daily silver price returns, when averaged over a 30-day period. Each time after it has sustainably retraced back through that level, the returns over the subsequent three month period have averaged 10% and have not ever been negative. While silver stocks remain elevated, they have fallen by 4% since the beginning of October. We expect industrial demand to rise and buttress price action over the next few months as the recovery in the US and China gains momentum.
We maintain our positive view on silver and expect it to achieve a target price of US$21/oz by H2 2015.
Gold
Gold likely to sustain modest gains. The outlook for the gold price in 2015 is especially uncertain. Ordinarily, a positive economic environment, in which some major central banks will likely raise interest rates, will be a gold negative scenario.
However, demand for defensive assets like gold, primarily as a portfolio hedge will likely remain resilient in 2015, especially with the price of this hedge so close to the marginal cost of production, which stands at US$1,100oz according to our calculations. After a weak start to 2014, demand of gold from India and China is showing signs of recovery. Imports from Hong Kong rose for a third consecutive month in October on increasing jewellery sales, after a depreciation of the Renminbi at the beginning of the 2014, coupled with a rising gold price, slowed purchases in the first part of 2014.
India returned to be the world’s biggest buyer of gold in 2014, after the imposition of import duties in 2013 dampened demand for the metal and saw China rising to the pole position. India unexpectedly scrapped the 80:20 rule on gold imports at the end of November. Responding to a widening current account deficit the Indian authorities introduced draconian restrictions on gold imports last year, requiring 20% of all imports to be reexported.
Gold is bought in India for weddings as part of the bridal trousseau and gifts. The main wedding season runs from November through May. Demand also climbs during the festival season that runs from late August to October. While the recent change in the regulation is unlikely to be a game changer for gold, the Indian Bullion and Jewellers Association expect demand for gold to return to 900 tons a year, a 9% upside from current levels. While in our central scenario, we don’t expect geopolitical risk to significantly interfere with continued economic growth and the demand for cyclical assets, the geopolitical environment remains tense in a number of regions.
Additionally, with weak economic activity in the Eurozone and Japan we believe the expansionary monetary policy of the European Central Bank (ECB) and Bank of Japan (BOJ) will also prompt demand for gold from investors in these regions as low or negative deposit rates increase the appeal of holding gold.

The accompanying weakening of the euro and yen will also boost returns of foreign investors holding dollar denominated assets.
With recycling having fallen to the lowest level since Q3 2008, we believe the current gold price represents a floor below which it is unlikely to fall without triggering a further loss in supply.
Recycling has accounted for 37% of total gold supply on average over the past 5 years but recent weakness in the gold price has seen recycling falling by 15% yoy in the first three quarters of 2014.
In general, we expect gold to end 2015 in the range of US$1250-US$1300/oz, as long as US interest rate rises are modest and gradual.
INDUSTRIAL METALS
Supply disruptions key for industrial metals in 2015. Supply shocks have played a central role in the industrial metal space last year, with Indonesia introducing an ore export ban, Russia threatening to restrict exports and the Philippines assessing the opportunity-cost of following Indonesia’s example. Significant production is located in emerging markets, which makes supply consistency an ongoing uncertainty. However, concerns about European and Chinese growth, markets digesting higher US rate expectations and US Dollar strength, and optimistic supply expectations have driven metal prices down together with other cyclical assets in Q4 2014. Several metals are now trading below their marginal cost of production.
Chinese imports rose in October from a month earlier, at the same time as production has been increasing. While SHFE stockpiles rose in October from a month earlier, inventory levels are lower by nearly 50% over the past year.
While the International Copper Study Group (ICSG) expects a 10% increase in mine supply to prompt a surplus in the copper market in 2015, we believe supply expectations are overblown.
Sustained weakness in the copper price has already prompted some producers to downsize production. Indeed, Codelco, the world’s largest copper miner, has recently announced that it will cut production by 5% in 2015. We expect more miners to follow Codelco’s example as low price expectations prompt companies to cut back on expansionary and maintenance capex. Lower inventory levels in 2014 compared to a year prior (8% vs 12% of production) are also likely to support a recovery in the copper market.
After range-trading over the past year, we expect investors to focus on tightening supply-demand fundamentals in 2015. We expect the copper price to trade around the US$7,000/t level in 2015 and break above that level in 2016 when lack of capital expenditure will sharply curtail available supply.
Nickel
Indonesian ban to drive nickel market into deficit in 2015. After rising over 50% to US$21,000, nickel price corrected together with other cyclical assets at the end of August. Indonesia, the biggest nickel producer with over 30% of global mine supply, introduced an ore export ban in January 2014 to favour the domestic processing of metal commodities.
Meanwhile, fears that tensions with Russia could affect supply from the country, contributed to buoy prices in the first part of the year.

China is the biggest consumer of nickel accounting for about 50% of demand. The country is estimated to have entered the ban with about eight months of nickel ore inventory, somewhat limiting the potential rise in nickel price in 2014. We expect China to have exhausted the majority of those inventories now, providing upside potential for nickel price in 2015. Since the introduction of the ban, China has turned to the Philippines, the 2nd largest global producer, to keep its nickel pig iron industry well supplied, despite the difference in quality between Indonesian and Filipino nickel. Indonesia provides higher grade nickel which is only available in limited amounts in the Philippines. However, on November 26, the Philippines Government’s Natural Resource Committee approved a bill to ban the exports of unprocessed ore, which could potentially remove a further 400,000 tonnes a year of nickel from the market. Should this export ban be implemented, the overall impact on world mine production would be substantial.
We expect the absence of Indonesian ore from the market to contribute to supply tightness until 2016 when new production from China, the Philippines and Russia eases some of the supply constraint. With the Indonesian ore export ban remaining in place, we expect inventories to be slowly absorbed and for prices to trend higher towards the levels seen around May 2014.
Zinc
Mine closures and rising demand to drive the next leg of the zinc bull market. Planned mine closures, coupled with strong demand for galvanised steel, are expected to drive the price of zinc higher in 2015. Approximately 1.5 million tonnes of zinc production will be taken off the market by 2016 due to mine depletion, equivalent to about 12% of 2013 production. The zinc market is expected to remain tight until 2015 when higher prices support the development of new projects in Australia, Indonesia and Russia.
Provisional data provided by the International Lead and Zinc Study Group (ILZSG) indicate the zinc market was in a 309kt deficit (equivalent to 3% of global zinc demand in 2014) in the first three quarters of 2014. Metal usage increased by 7.4% over the same period, driven by a strong increase of demand from China (+13.8%) and the US (+9.2%). The increasing use of galvanised steel is projected to amplify zinc consumption in 2015, particularly in China. China is zinc’s biggest consumer, with approximately 46% of refined demand in 2013. Over 40% of zinc demand comes from galvanising steel as an anti-rust protection for car manufacturing and construction. Despite concerns over the Chinese property market, demand indicators in the other sectors remain robust.

With automobiles production in China up 7.2% yoy in the first 11 months of 2014 and the latest government policies boosting infrastructure and durable goods consumption, we believe zinc is well positioned to benefit from a pick-up in Chinese growth.
Meanwhile, LME inventories have declined by 254kt last year and are now 27% below the levels seen at the beginning of the 2014. Should demand from China remain strong and inventories continue to fall, we believe zinc could return to trade at the levels last seen in November 2010. We target a price of US$2,510 per metric tonne in 2015.
ENERGY
Falling oil prices will have a substantial impact on commodities in 2015. Energy is one of the biggest cost lines in the production of most commodities and lower oil prices could release some of the cost pressure on producers, in turn weighing on commodity prices.

However, we expect the move to the downside in oil has been exaggerated. As China eases policy to boost growth, the US economy recovers and production responds to lower prices, energy commodities should recover from current beaten down levels.
Oil
Modest tightening of oil supply expected. Weak global demand for oil and distillates combined with ample global supply of crude has weighed on both Brent and WTI prices over the past few months, prompting them to fall below US$60.
Although OPEC resisted calls to cut production in November, highlighting the need for oil prices to find a new equilibrium, we believe the cartel will eventually have to reduce supply to help stabilise global oil prices. The cartel jointly produces approximately 40% of global oil output. While the US is gaining an increasing share of global output (by displacing oil imports through its own production) and Russia remains a formidable player, we believe it is too early to write off OPEC as an irrelevant cartel when it comes to setting global prices. While there appears to be a clear split between Gulf OPEC members and the remaining countries in terms of cutting oil production to sustain oil prices, we expect the OPEC oil cartel will eventually commit to cutting back on oil production.
OPEC has historically played a fundamental role in keeping oil prices above US$100/bbl but shale oil might have changed the shape of the industry permanently. Oil productivity and costs vary considerably across different shale formations, with striking variances within areas of the same formation. While the marginal cost of production of oil as measured by the 90th percentile of the cost curve of the 50 largest oil and gas companies was estimated to be around US$92/bbl in 2011, shale oil has become increasingly cheaper to produce with the marginal cost now likely in the range of US$60-US$70/bbl. The IEA estimates 82% of crude oil and condensates production from the United States is still profitable at a price of US$60/bbl or lower. However, the number of operating oil rigs appears to be quite sensitive to sustained price changes. Historically, oil rigs have taken about 16 weeks to adjust to lower oil prices.
During periods of strong declines in WTI crude price, like during the 2008 crisis, oil rigs have halved in the following four months and we expect a similar pattern to occur in 2015. This could potentially benefit oil prices, particularly WTI, by relieving some of the excess supply in the market.

We also expect OPEC countries to suffer from current low prices as the majority of the cartel’s countries are estimated to require oil prices of at least US$90-US$100/bbl to balance their government budgets. While some countries can run budget deficits, the appetite to do so will wear thin as the cost of financing starts to increase. Other OPEC countries like Venezuela risk potential bankruptcy with oil prices at current levels. Indeed, while Russian production reached a post-Soviet era high last month, the impact of depressed oil prices could severely impair the economy and send it into a sustained recession.
We expect price weakness to continue through at least the first half of 2015, and target a price of US$70/bbl for WTI and of US$75/bbl for Brent until production adjusts to lower prices.
Natural Gas
Measured price climb in 2015. Cold weather enveloped the US early in 2014 prompting the Henry Hub natural gas benchmark to jump to the highest level in five years as working gas inventory levels dwindled to 54.7% below the five-year average. The rally proved to be temporary and since then robust US shale gas production has reduced the inventory deficit to 3% and put pressure on natural gas prices.
Between January and March 2015, natural gas prices will be heavily dependent on weather forecasts and the impact of heating demand on inventory levels. Currently with natural gas stocks approximately 3% below the five year average and consensus forecasts for mild weather this winter season, the market has plunged 28% to US$3.0/MMBtu. If mild weather forecasts persist and the drawdown of inventories remain below historical averages the US natural gas price is set to be restrained at these levels until March. However should a cold weather pattern develop and regional temperatures decline, it is likely that speculative inflows and a rapid price appreciation will ensue, similar to what we saw in November 2014 when prices rallied 16%.
By Q2 2015, after the end of the heating season, market focus should return to medium-term fundamentals. The demand picture is centred on the US economic recovery which should gather momentum in 2015 as the GDP growth rate increases to 3% according to the OECD. The increase in GDP growth in 2015 will accentuate the current trend of rising natural gas demand from industrial and electricity producers. These firms in recent years have increased natural gas consumption as the US shale revolution continues to drive the overall cost of natural gas down. Furthermore, natural gas demand should get a boost from the implementation of environmental policies which will require outdated coal-fired power plants that fail to meet regulatory standards across the US to be replaced by natural gas–fired capacity.
Despite natural gas demand in the US looking healthy in 2015 we do not believe this will translate directly into a strong price appreciation. Instead we expect a steady climb in prices as demand offsets the continued expansion of domestic shale gas output.

Future growth in shale gas output is believed to rise as reflected in the latest drilling productivity report released by the EIA which predicts 20.4% growth in shale gas production in January compared to the same time last year. This report is based on the seven most prolific shale gas regions in the US and while there are other areas to consider these regions accounted for 95% of the oil and gas production growth in the US during 2011-13.
On balance, we believe that strong demand will outweigh rising structural supply to tighten the market in the second half of 2015. Under our central scenario, US natural prices will climb to around the US$3.6/MMBtu level in the second half of 2015 from US$3.0/MMBtu currently.
AGRICULTURE
Agricultural outlook remains varied and tied to weather. The fortunes of the agricultural sector are clearly significantly tied to weather. Sea temperatures across the Pacific are close to El Niño thresholds.

While an atmospheric response has not full materialised, a mild El Niño weather event looks likely this Northern Hemisphere winter. An El Niño weather event can make some parts of the world hotter and dryer than normal, while increasing precipitation elsewhere.

Planting decisions for the 2015 crop have largely been made in 2014 and so the main drivers of supply of most agricultural commodities this year will be weather, use of fertilizer, the timeliness of the harvest and export policies. However, given the current losses that farmers are likely bearing in wheat, corn and soy we believe that production will be cut in 2016 through a conscious decision to plant less in 2015. That will provide support for grain prices in 2016.
Soybeans
An El Niño weather event would be bearish for soybeans. Brazil and Argentina, which jointly produce almost half of the world’s soybean supply, are likely to face beneficial growing conditions in the event of an El Niño, while India which only produces 4% of global supply will face negative growing conditions. On balance an El Niño will prove to be price negative for soybeans.

Wheat
An El Niño weather event would be mildly bullish for wheat. Australia, which produces 4% of global wheat supply, could continue to face drought if El Niño emerges. However, much of the harvest will be complete in the first few weeks of January, limiting its impact. The effects of El Niño are less significant in South America and with a weak El Niño forecast we believe there will be no impact in that region.

Corn
An El Niño weather event would be mildly bearish for corn. The effects of El Niño on corn are less significant, but could be mildly positive on growing in South America and parts of Australia and hence slightly price bearish.

Arabica Coffee
Arabica coffee to benefit from a potential El Niño weather event. Arabica coffee production is highly concentrated in Brazil, particularly in the Minas Gerais region. Arabica coffee prices almost doubled in 2014 because a drought in Brazil hampered production. While the recent rain has helped growing conditions for the 2015 crop, dry weather that could accompany an El Niño in the key growing areas could set back the progress, providing another catalyst for price gains.

Sugar
El Niño would be beneficial for sugar prices. Sugar production is also highly concentrated in Brazil and India. Both countries could see below-normal rainfall during an El Niño episode and drier conditions could drive prices higher.
However, the El Niño will likely be a mild event and unlikely to detract the sugar market from another year of supply surplus.

Cocoa
An El Niño weather event would be mildly bullish for cocoa. Although El Niño does not directly impact the weather in major cocoa growing regions in Africa (which produce 70% of global supply), according to the International Research Institute for Climate and Society, the change in weather patterns elsewhere can transmit to Africa via so-called “teleconnections”. Indonesia, which produces 10% of global cocoa supply, will be more directly affected. Dry warm weather in Indonesia could drive prices higher.

CURRENCIES IN 2015 – CENTRAL BANKS IN FOCUS
Divergent central banks’ action key for currencies in 2015. The global interest rate cycle is turning. Interest rates in many developed economies have been hovering near their lowest levels in recorded history for nearly six years. In our view, as economic momentum gathers pace, interest rate settings will be adjusted higher toward historically normal levels.
We believe it is no surprise that the central banks that have embarked on the most aggressive stimulus in recent years now are reaping the benefits of those actions in the form of better underlying growth. As can clearly be seen below, the US Federal Reserve (Fed) and the Bank of England (BOE) have seen the greatest balance sheet expansions.
The ECB and the BOJ have been behind the stimulus curve but are likely to make up for that in 2015, as they become ever more aggressive with fresh measures to fight the deflationary inertia in their respective economies.

While the global economic recovery is taking hold to varying degrees across the world, there has been a divergent trend in developed economies. Global growth differences mean central bank policies will also diverge, providing opportunities for currency investors and investors exposed to assets that are not priced in their home currency.
USD: Stronger for longer. We expect the US Dollar to exhibit broad-based strength in 2015, likely outperforming all other G10 currencies. We feel that the US Dollar is at the beginning of a long term strengthening cycle after a decade of structural decline.

We believe continued improvements in the US economy will see the Fed being the first central bank to raise interest rates in 2015, toward historically more normal levels. We expect that a large balance sheet for the Fed does not preclude rate hikes and that small and measured rate increases can be a signalling mechanism to allow the central bank to warn the market that stimulus will be gradually removed as the recovery continues to absorb spare capacity. The flattening of the US Treasury curve is likely to sustain the upward trajectory of the US Dollar over the course of 2015.

GBP: Momentum waning. In the UK early signs of a robust recovery in economic activity in 2014, have faded in recent months, with manufacturing activity and household sector spending posting downside surprises. Inflation has fallen to the lowest level in over a decade and with the UK being an energy importer, inflationary problems appear remote. This is especially the case with wage growth remaining at historically low levels.
As a result of the weakening in economic momentum, the market has been pushing back the chance of a rate hike by the BOE and we feel aggressive tightening is unlikely in 2015.
Accordingly, we expect the differential of US over UK bond rates to continue to widen as investors begin to factor in better US growth rates, putting further downward pressure on the GBP/USD exchange rate. The UK recovery is likely to be gradual with the central bank remaining data dependent, and policymakers will increasingly feel there is additional time before a rate hike is required to stem any pipeline price pressures.
Stealth currency wars being waged. Stealth currency wars are being waged by the ECB and BOJ with the massive amounts of stimulus being provided to financial markets, in turn prompting currency depreciations. While lower currencies are likely to have an impact on economic activity via improved competitiveness, importing inflation is a critical ingredient when both economies are energy importers and lower oil prices can only be a depressing influence on prices. Deflationary tendencies have been stalking both economies for many years keeping central banks well and truly in stimulus mode.
Structural reforms need to be implemented, and this will not help near-term growth take off in a significant manner.
Soft growth has seen Eurozone inflation hovering less than a quarter of the ECB’s ‘below, but close to, 2%’ target for several months. As deflationary threats have mounted, the ECB has been aggressive in introducing fresh unconditional policy measures, including negative deposit rates and additional long term funding and asset purchasing initiatives. The new measures, which are aimed at increasing lending and liquidity conditions in the real economy, are likely to remain in place in for the foreseeable future. We expect the aggressive ECB stimulus to continue to weigh on the performance of the Euro, as we do not expect the economic situation to improve markedly over the coming year. The plunge in oil prices has exacerbated the negative price pressures, increasing the chances of further stimulus from the ECB. We expect the ECB to embark on wide ranging quantitative easing in 2015 and do not believe the market has fully priced in this possibility. In the absence of comprehensive structural reform further Euro weakness will allow the struggling peripheral countries improve competitiveness and to a degree should assist the price outlook via imported goods inflation.

With latest data showing that the Japanese economy is in a recession, we anticipate the BOJ adding further stimulus (a similar situation to the ECB), keeping the Japanese Yen depressed in 2015. While the economy should benefit from the drop in oil prices as Japan is a significant net energy importer, the negative is the ongoing deflationary environment for the country. An added weight for the Yen is the depressed household sector, which is being burdened by fiscal policy, in the form of consumption taxes at a time where the corporate sector is flush with cash and real wage have fallen significantly in 2014. There appears no hope in sight for consumers, with the recent landslide win for the incumbent LDP is being hailed as a strong mandate to continue the fiscal status quo. Keeping the Yen weak is an integral part of this strategy, to enhance competiveness.

CHF: No stealth from SNB. While indirect currency wars continue, the Swiss National Bank (SNB) is expected to continue its explicit currency policy for the foreseeable future.
The SNB has followed the lead of the ECB by introducing negative deposit rates in a bid to curb the Franc’s strength.
After the passing of the Swiss gold referendum threat, we expect the CHF to continue to trade a narrow range against the Euro in 2015. Nonetheless, with further Euro weakness expected in 2015, the SNB may have to step up its intervention in order to protect the floor against, which will see its FX reserves continue to rise.
Commodity currencies to rebound. The interrelationships between commodity and currency markets have been rising in 2014. Commodity markets have had an increasing bearing on currency markets in 2014, mostly for negative reasons, but we expect adverse sentiment toward commodity currencies to abate going into the New Year. We expect commodity currency performance to improve in 2015, as one source of weakness (depressed global commodity prices) begins to fade.
On the flipside, we feel that US Dollar strength is not likely to be a permanent threat to commodity prices. The historically negative correlation between the US Dollar and commodity prices has been a headwind for commodity price, particularly gold, at the margin. We expect this relationship to decouple moving into 2015 as the global economic recovery gains pace.
The US Dollar strength in 2014 has been the result of the brightening US economic environment and the increasing potential for the Fed to tighten policy in 2015. We expect this ”positive” US Dollar strength to continue but the improving economic backdrop is likely to supportive for underlying commodity demand, especially with Chinese demand also remaining healthy. Accordingly we foresee an environment in 2015 that is beneficial for both the US Dollar and commodity prices.

The source of weakness in both the Australian and New Zealand Dollars has been two fold this year – a result of the concern, over the outlook for the Chinese economy (with both countries commodity exports highly tied to Chinese demand) and the rhetoric of their respective central banks. Both the Reserve Bank of Australia and the Reserve Bank of New Zealand would welcome the benefits of weaker currencies after indicating both currencies were significantly higher than fundamentals suggested. In addition, we feel that the negativity surrounding the Chinese economic outlook has been overblown and feel that current levels for the AUD and NZD are quite supportive, with commodity demand expected to pick-up in 2015.

Meanwhile, the oil price plunge has been particularly damaging for the Canadian Dollar and Norwegian Krone. We feel that as oil prices begin to rebound both currencies will appear particularly attractive against funding currencies like the Yen
and the Euro.
While the oil price has weighed on the Canadian dollar, yield differentials between German bunds and Canadian Treasury bonds indicate that the Canadian Dollar is well under-priced compared to the Euro. We expect this situation to be corrected as the market increasingly identifies the positive growth outlook for the Canadian economy and the potential implications for
monetary policy in 2015. We expect the Krone to recover against the Euro over the course of 2015.

Bank of Canada Governor Poloz recently noted that the use of forward guidance for monetary policy was not beneficial in the current environment and we feel this is a signal that the central bank is confident about the economic outlook and the ability of the Canadian economy to be able to digest modestly tighter policy in 2015. Importantly, the Canadian dollar has the benefit of strong economic ties to the strengthening US economy – another source of support for the currency.
The ongoing weakness in oil prices, coupled with the surprise rate cut by the Norwegian central bank pushed the Norwegian Krone to its lowest levels against the Euro in almost six years.
The Norwegian central bank is not unhappy with a softer currency, highlighting that currency weakness will help offset the slowing activity in the petroleum sector. We expect that the deflationary impact of lower oil prices will begin to fade and that the negative impact of weaker oil prices on the Norwegian external balance should also start to diminish as crude recovers over the course of 2015.

Neighbouring central bank, the Swedish Riksbank, is also becoming more bearish about the outlook for inflation given falling oil prices despite being relatively optimistic over the pace of growth in domestic economic activity.
The Riksbank was the pioneer of negative deposit rates in 2014, in a bid to boost inflation toward its two per cent target.
Policymakers stated in December that ‘monetary policy needs to be even more expansionary’ in the current environment in order to ward off the risk of a decline in inflationary expectations and lift inflation.
Alongside an unclear government environment, we expect that the Swedish Krona will remain soft against major crosses until there is evidence of a rise in price pressures and there is a sense that the central bank is willing to raise rates from its current zero bound. We expect the Swedish Krona to underperform the Norwegian Krone in 2015.
Important Information
This communication has been provided by ETF Securities (UK) Limited (”ETFS UK”) which is authorised and regulated by the United Kingdom Financial Conduct Authority (the ”FCA”).


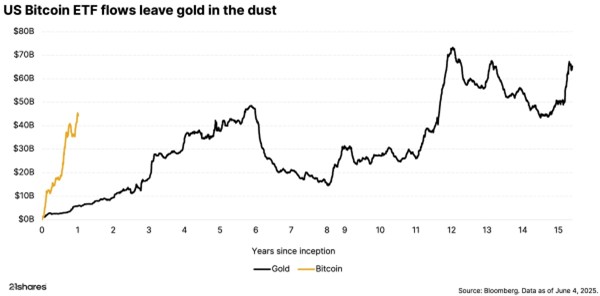
Bitcoin is now worth over $100,000, thanks to clearer regulations and growing interest from both big investors and everyday people. What began quietly in 2009 as a digital experiment has evolved into a globally recognized asset. That’s why it’s important to understand why people invest in Bitcoin.

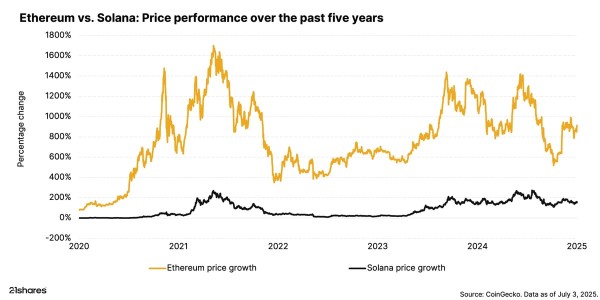
Mid-year momentum: What are Ethereum and Solana up to?
We’re halfway through 2025, and Ethereum and Solana have already made big moves. Both networks are rolling out major upgrades that could reshape how the crypto space works in the months ahead.


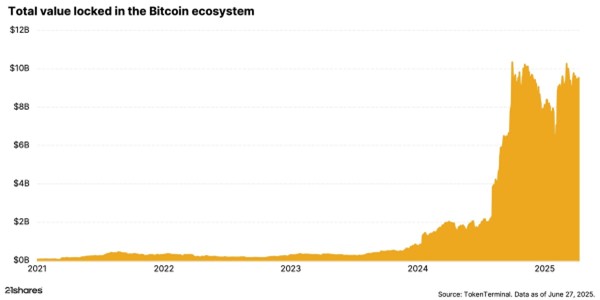
Beyond digital gold: Bitcoin enters the DeFi world
Bitcoin is often seen as a store of value, like digital gold, but hasn’t been known for doing much beyond that. That’s now changing. In 2025, a new trend called Bitcoin Finance (BTC-Fi) is gaining traction, turning Bitcoin into an active part of the broader crypto ecosystem.

Research Newsletter
Each week the 21Shares Research team will publish our data-driven insights into the crypto asset world through this newsletter. Please direct any comments, questions, and words of feedback to research@21shares.com
Disclaimer
The information provided does not constitute a prospectus or other offering material and does not contain or constitute an offer to sell or a solicitation of any offer to buy securities in any jurisdiction. Some of the information published herein may contain forward-looking statements. Readers are cautioned that any such forward-looking statements are not guarantees of future performance and involve risks and uncertainties and that actual results may differ materially from those in the forward-looking statements as a result of various factors. The information contained herein may not be considered as economic, legal, tax or other advice and users are cautioned to base investment decisions or other decisions solely on the content hereof.

Nyheter
Kryptons revansch: Därför lockar bitcoin investerare igen – så enkelt kan du få dubbel exponering


Why Bitcoin belongs in your portfolio

USB7 ETF köper amerikanska statsobligationer med löptid upp till tio år

Kryptons revansch: Därför lockar bitcoin investerare igen – så enkelt kan du få dubbel exponering

DFNC ETF ger exponering mot försvarsindustrin i Europa
Why are major institutions looking to Solana for stablecoin issuance in Europe?

De bästa ETFer som investerar i europeiska utdelningsaktier

YieldMax® lanserar sin andra produkt för europeiska investerare

Big News for Nuclear Energy—What It Means for Investors

Svenska investerare — 21Shares Nasdaq Stockholm-sortiment har just blivit starkare

3EDS ETN ger tre gånger den negativa avkastningen på flyg- och försvarsindustrin
-
 Nyheter2 veckor sedan
De bästa ETFer som investerar i europeiska utdelningsaktier
-
 Nyheter4 veckor sedan
YieldMax® lanserar sin andra produkt för europeiska investerare
-
 Nyheter4 veckor sedan
Big News for Nuclear Energy—What It Means for Investors
-
 Nyheter2 veckor sedan
Svenska investerare — 21Shares Nasdaq Stockholm-sortiment har just blivit starkare
-
 Nyheter4 veckor sedan
3EDS ETN ger tre gånger den negativa avkastningen på flyg- och försvarsindustrin
-

 Nyheter2 veckor sedan
Nordea Asset Management lanserar nya ETFer på Xetra
-

 Nyheter1 vecka sedan
12 000 artiklar om börshandlade fonder
-

 Nyheter1 vecka sedan
Hetaste investeringstemat i juni 2025