
Nyheter
Our Highest-Conviction Fixed Income Trade over the Next 2 Years
On March 21, the Federal Open Market Committee voted to increase the Federal Funds Rate target for the sixth time since December 2015. As the Federal Reserve (Fed) continues to tighten policy, the ability to generate returns in short-dated fixed income has increased. In response, investors have piled nearly $6.7 billion over the last year into two exchange-traded funds (ETFs) that seek to track one- to three-month Treasury Bills. 1 While we agree with the shift to lower duration as long-term interest rates increase, the shift into t-bills is leaving a significant amount of return potential on the table. Below, we highlight the rationale for our highest-conviction fixed income trade over the next two years and why we believe investors should be investing in floating rate Treasuries instead of three-month t-bills.
Contrasting Two-Year Floating Rate Treasuries vs. 13-Week T-Bills
While t-bills and floating rate Treasuries are both issued by the U.S. government, the yield for a 13-week t-bill is set at a weekly auction. Instead of paying interest, they are generally auctioned at a discount to par, so when they are held to maturity, an investor’s holding period return would equal the quoted yield. Since they do not make intermediate coupon payments (like longer-tenor Treasury notes), the duration of the bill is equal to its maturity (13 weeks).
In January 2014, the U.S. Treasury issued its first floating rate note (FRN). Treasury FRNs pay a coupon on a quarterly basis and mature in two years. The coupon rate “floats” and is based on the 13-week t-bill yield plus a spread. The spread represents a snapshot of demand for a particular FRN when it is auctioned and remains fixed for the life of the note (low demand = high spread; high demand = low spread). The duration of the FRN is only one week because that is the amount of time between interest rate resets.
Trade Rationale
The simple reason that we prefer floating rate notes versus rolling three-month t-bills over the next two years is that we want to receive higher yields as the Fed hikes rates. As short-term interest rates rise, the yield on Treasury floaters will reset each week at progressively higher rates. By contrast, if investors wanted to roll three-month t-bills over the next two years, they would only able to boost the yield of their holdings every three months (e.g., four times per year). Additionally, FRNs receive a spread over three-month t-bills, which currently boosts yields by 5 basis points (bps).
Cumulative Performance
Given that the Fed started hiking rates in December 2015, we know that owning FRNs whose coupons reset along with increases in t-bill yields was the right trade. As we show in the chart below, investors could have generated 1.08% more return by owning FRNs rather than t-bills. Put another way, investors could have nearly doubled their returns by bearing the risk that yields might have declined during these more regular auctions.
Cumulative Return: U.S. FRN vs. 1-3m T-Bills

Similarly, we can also see that this strategy really tends to outperform when the Fed hikes rates more aggressively. During periods where the Fed is not raising rates, the performance advantage for FRNs is driven by the positive spread. While the Fed’s previous projections called for three rate hikes in 2018, it now seems like four rates hikes may be necessary. As a result, the case for owning FRNs only increases in this scenario, in our view.
Contrasting Yield and Calendar Yield Returns
A common rule of thumb for fixed income investments is that the starting yield is the best determinant of total return. For FRNs, this will tend to understate the total returns when the Fed is hiking rates and overstate total return potential when the Fed is cutting rates. As we show below, floating rate notes outperformed in every year that the Fed tightened policy, with the exception of 2015. FRNs and t-bills experienced similar performance in 2015 because the rate hike occurred in December and bill yields actually fell below zero from September through October as investors fretted over the government debt ceiling impasse. In 2016, the rate hike also occurred in December, but bill yields generally trended higher over the course of the year, thus rewarding FRNs with higher carry.
In our view, 2017 may be the most instructive test case for investors in 2018. With a fairly well telegraphed policy of rate hikes in place, the Fed hiked rates in March, June and December. This resulted in FRNs outperforming t-bills by approximately 40 bps.
In our view, should this occur again in 2018, we believe a 40 bps return advantage is reasonable. Should the Fed ultimately hike rates four times in 2018, we believe this return advantage could increase. With most fixed income investors seeing bond portfolios decline in value as longer tenor rates have risen year-to-date, we believe FRNs strike an attractive balance between income, volatility and minimal downside risk. Should rates follow a similar path to 2017, stable and low volatility returns in excess of 2% should be possible.
Impact of Fed Policy on U.S. 1-3m T-Bill & FRN Returns

Given that the basis of our view on FRNs over t-bills is based on what we see as the likely path of Fed policy, this trade represents our highest-conviction fixed income trade of 2018. Similarly, it also represents one of the lowest-risk trades investors can make this year. While a more hawkish Fed will increase the return differential, this approach loses out to t-bills if the Fed ends its tightening bias or t-bill yields decline based on some sort of political shock. With all these risks considered, we believe investors should consider the WisdomTree Bloomberg Floating Rate Treasury Fund (USFR) as our high-conviction trade for rising rates.
1 Source: Bloomberg, from 3/26/17 through 3/26/18.
________________________________________
Important Risks Related to this Article
There are risks associated with investing, including possible loss of principal. Securities with floating rates can be less sensitive to interest rate changes than securities with fixed interest rates but may decline in value. The issuance of floating rate notes by the U.S. Treasury is new, and the amount of supply will be limited. Fixed income securities will normally decline in value as interest rates rise. The value of an investment in the Fund may change quickly and without warning in response to issuer or counterparty defaults and changes in the credit ratings of the Fund’s portfolio investments. Due to the investment strategy of this Fund, it may make higher capital gain distributions than other ETFs. Please read the Fund’s prospectus for specific details regarding the Fund’s risk profile.
Privacy Policy
Investors should carefully consider the investment objectives, risks, charges and expenses of the Funds before investing. U.S. investors only: To obtain a prospectus containing this and other important information, please call 866.909.WISE (9473), or click here to view or download a prospectus online. Read the prospectus carefully before you invest. There are risks involved with investing, including the possible loss of principal. Past performance does not guarantee future results.
You cannot invest directly in an index.
Foreign investing involves currency, political and economic risk. Funds focusing on a single country, sector and/or funds that emphasize investments in smaller companies may experience greater price volatility. Investments in emerging markets, real estate, currency, fixed income and alternative investments include additional risks. Due to the investment strategy of certain Funds, they may make higher capital gain distributions than other ETFs. Please see prospectus for discussion of risks.


![36% of 800 professional investors surveyed by WisdomTree noted ‘diversification’ as their primary reason for holding gold[1]. Our analysis shows that gold has a low correlation with both equities and bonds and, thus, should contribute strongly to a diversification effort.](https://media.etfmarknaden.se/2025/01/Wisdomtree-400x240.jpg)
![36% of 800 professional investors surveyed by WisdomTree noted ‘diversification’ as their primary reason for holding gold[1]. Our analysis shows that gold has a low correlation with both equities and bonds and, thus, should contribute strongly to a diversification effort.](https://media.etfmarknaden.se/2025/01/Wisdomtree-80x80.jpg)


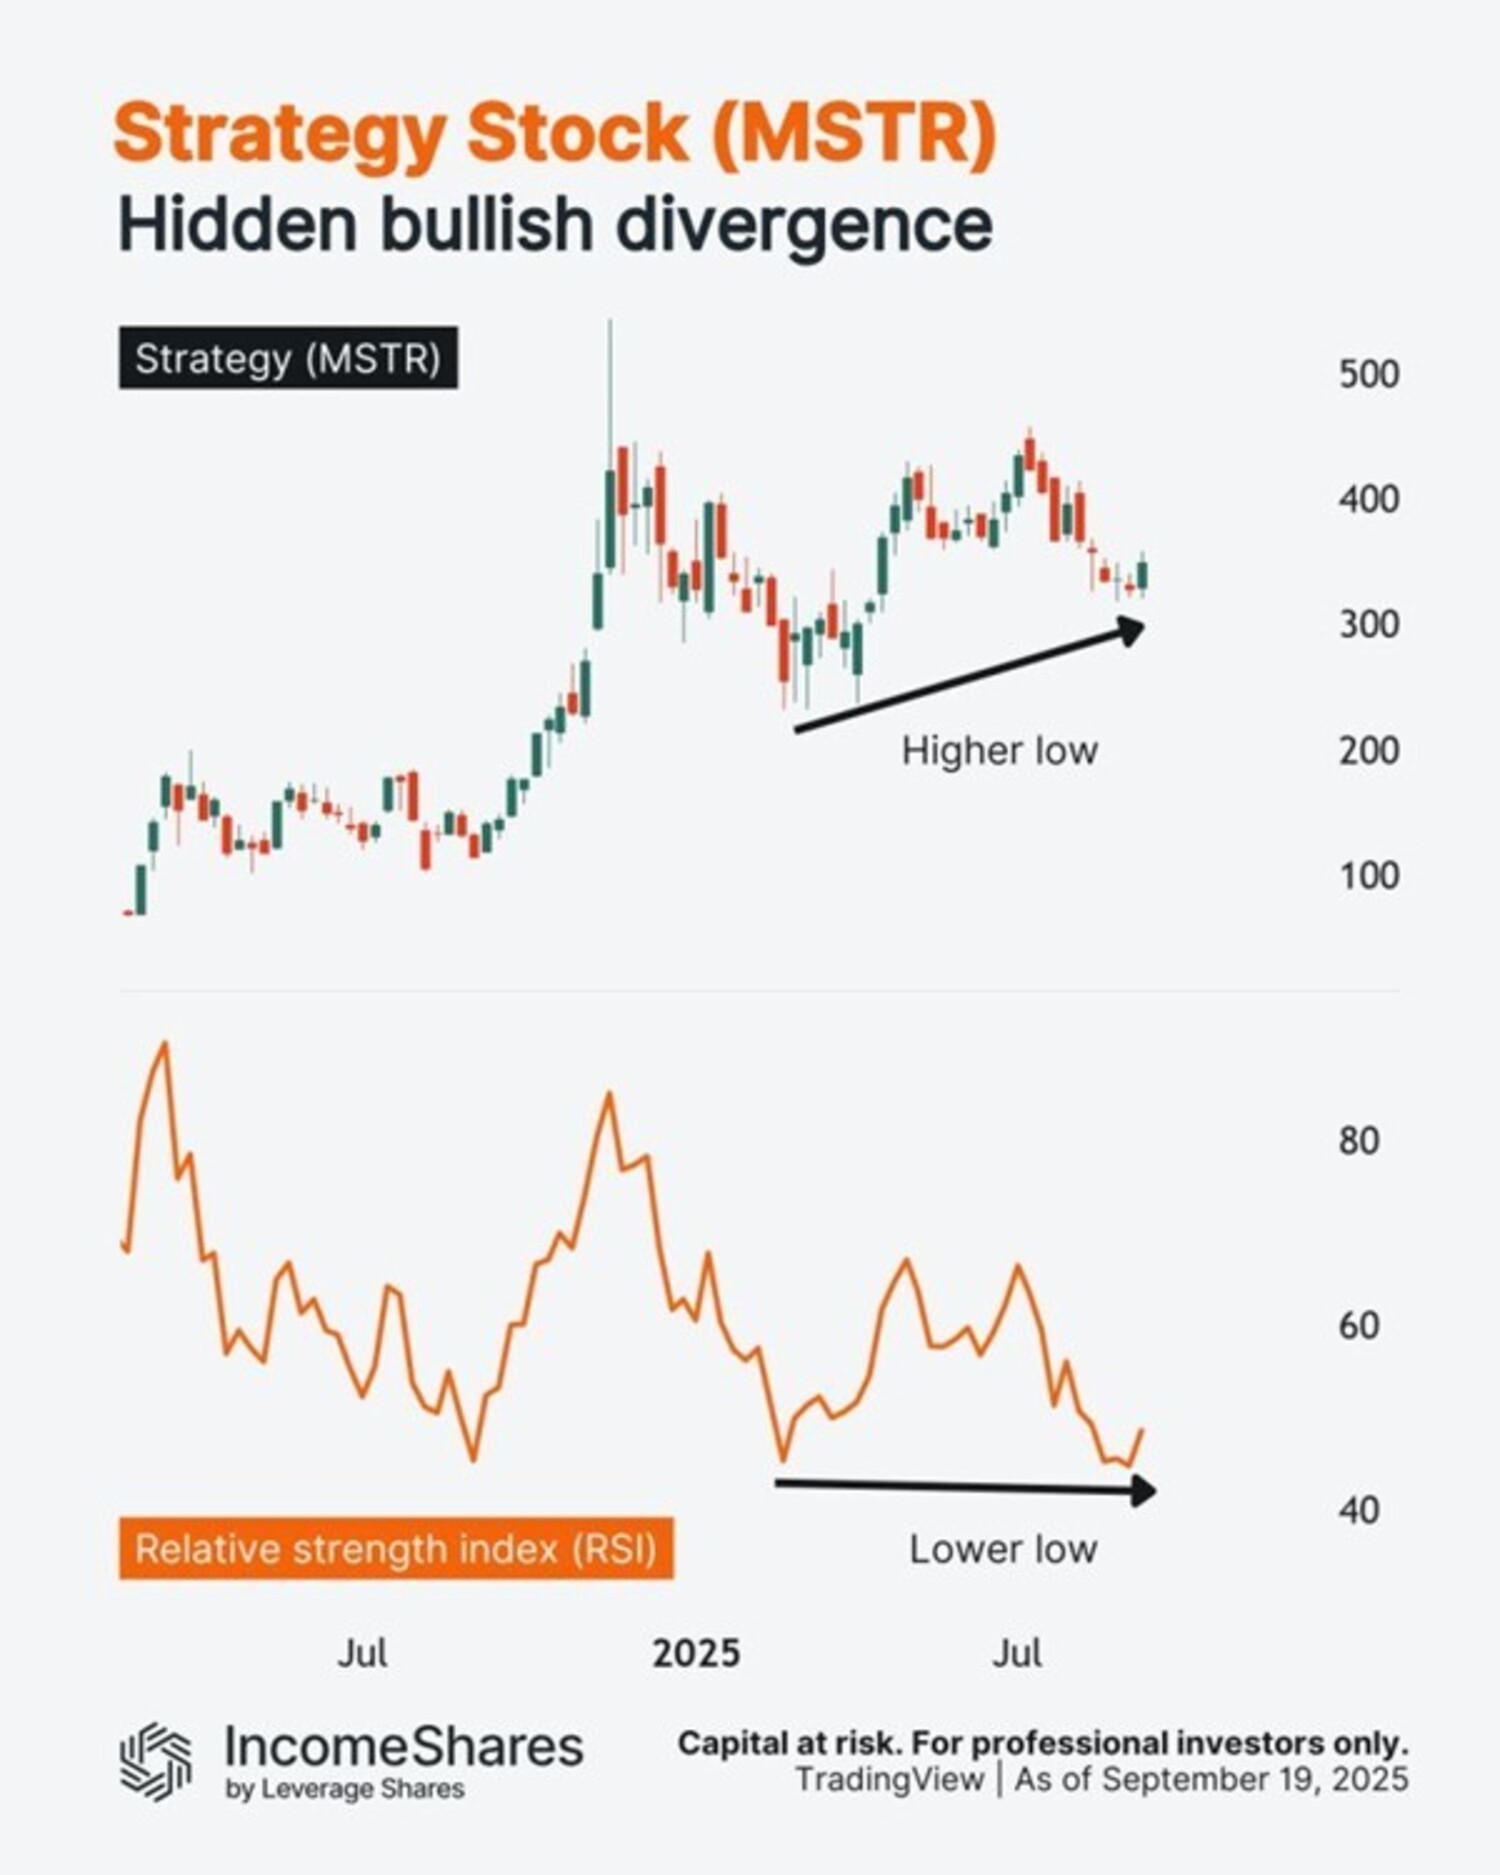
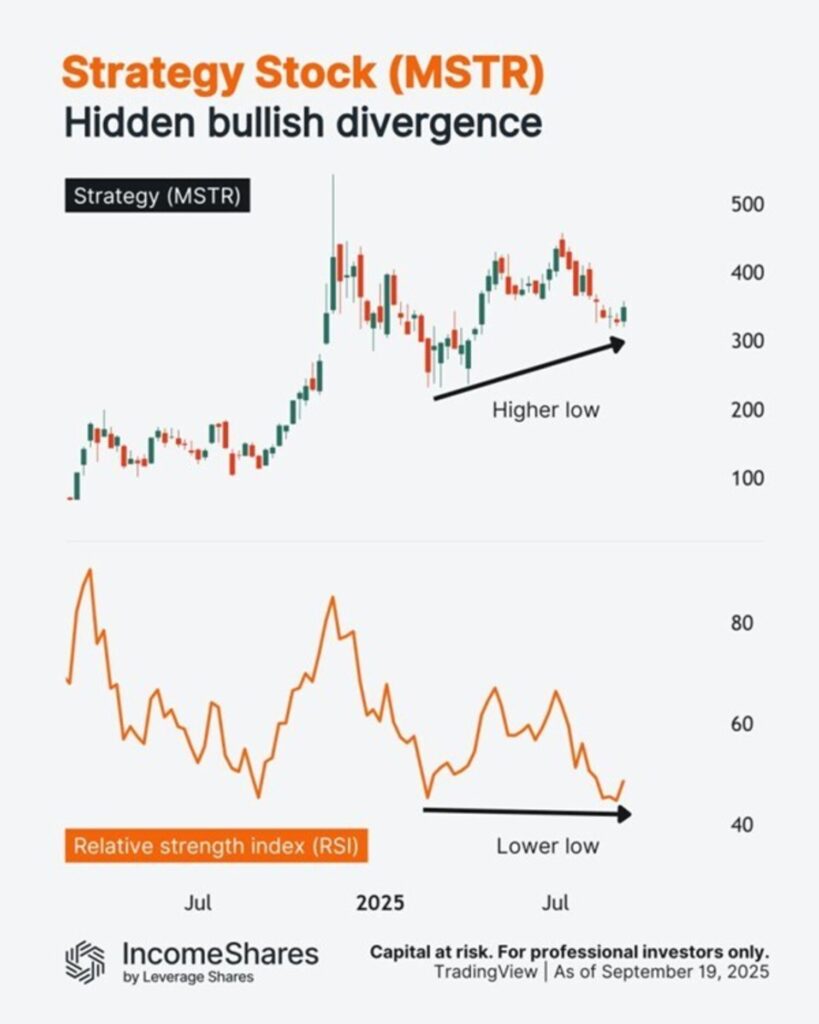
Strategy (MSTR) steg med cirka 5 % igår – och är nu upp cirka 10 % från sin ”botten” i september.
Hittills är det lägsta läget högre än det lägsta läget tidigare i år. Samtidigt kan RSI (relative strength index) potentiellt bilda ett lägre lägsta.
Den tekniska termen för detta är dold hausseartad divergens.
Så här fungerar det. RSI-linjen i diagrammet jämför de genomsnittliga vinsterna under ”uppåtgående veckor” med de genomsnittliga förlusterna under ”nedåtgående veckor” under de senaste 14 veckorna. Eftersom RSI nu är lägre betyder det att de genomsnittliga förlusterna har ökat i förhållande till de genomsnittliga vinsterna.
Med andra ord har säljtrycket ökat i ”relativ styrka” kontra köptryck (enligt indikatorn).
Men trots all denna säljstyrka har MSTR fortfarande stigit i pris totalt sett.
IncomeShares MicroStrategy Options ETP säljer säljoptioner på MSTR-aktier i syfte att generera månatlig inkomst. Den har också exponering mot aktiens prisrörelser.


ONCE ETP spårar den schweiziska dagslåneräntan och hedgas i euro

Strategy (MSTR) steg med cirka 5 %

7MAG ETP ger månatlig utdelning tack vare optioner

HANetfs VD kommenterar kärnkraftsavtalet mellan Storbritannien och USA

WMSE ETF en global momentumfond som handlas i euro och pund

Utdelningar och försvarsfonder lockade i augusti

Månadsutdelande ETFer uppdaterad med IncomeShares produkter

HANetfs analyserar hur ett fredsavtal kan påverka det europeiska försvaret

ADLT ETF investerar bara i riktigt långa amerikanska statsobligationer

Septembers utdelning i XACT Norden Högutdelande
-
 Nyheter3 veckor sedan
Utdelningar och försvarsfonder lockade i augusti
-
 Nyheter4 veckor sedan
Månadsutdelande ETFer uppdaterad med IncomeShares produkter
-
 Nyheter4 veckor sedan
HANetfs analyserar hur ett fredsavtal kan påverka det europeiska försvaret
-
 Nyheter4 veckor sedan
ADLT ETF investerar bara i riktigt långa amerikanska statsobligationer
-
 Nyheter2 veckor sedan
Septembers utdelning i XACT Norden Högutdelande
-

 Nyheter4 veckor sedan
Fastställd utdelning i MONTDIV augusti 2025
-

 Nyheter3 veckor sedan
HANetf kommenterar mötet mellan Kina, Ryssland och Nordkorea vid militärparad
-

 Nyheter4 veckor sedan
AICT ETF investerar i obligationer utgivna av företag från tillväxtmarknader