
Nyheter
How are investors using gold?
![36% of 800 professional investors surveyed by WisdomTree noted ‘diversification’ as their primary reason for holding gold[1]. Our analysis shows that gold has a low correlation with both equities and bonds and, thus, should contribute strongly to a diversification effort.](https://media.etfmarknaden.se/2025/01/Wisdomtree.jpg)
36% of 800 professional investors surveyed by WisdomTree noted ‘diversification’ as their primary reason for holding gold[1]. Our analysis shows that gold has a low correlation with both equities and bonds and, thus, should contribute strongly to a diversification effort.
Figure 1: Correlations between assets
| Commodity | MSCI World All Country | S&P 500 | Global Aggregate Bond | Gold | |
| Commodity | 1.00 | ||||
| MSCI World All Country | 0.43 | 1.00 | |||
| S&P 500 | 0.33 | 0.94 | 1.00 | ||
| Global Aggregate Bond | 0.24 | 0.36 | 0.27 | 1.00 | |
| Gold | 0.37 | 0.12 | 0.02 | 0.41 | 1.00 |
Source: Bloomberg, WisdomTree, Monthly data from November 1990 to November 2024. Commodity is Bloomberg Commodity Index, MSCI World All Country is a equity index, S&P 500 is a US equity index, Global Aggregate Bond is the Bloomberg GlobalAgg Index covering government, corporate and securitized fixed income, Gold is spot gold prices. Historical performance is not an indication of future performance and any investments may go down in value.
Gold behaves very differently to other assets. On the one hand, it is a defensive asset, often competing with bonds as a safe harbour against broader market volatility. On the other hand, it has cyclical traits because it rises in times of inflation, which is often generated in periods of strong economic growth. This duality of gold helps explain its low correlation with traditional assets.
Our survey respondents flagged ‘inflation hedge’ as the second most popular reason to hold gold (35%), followed by ‘financial market volatility hedge’ (31%) and ‘geopolitical volatility hedge’ (27%)[2].
Optimal holding of gold in a portfolio
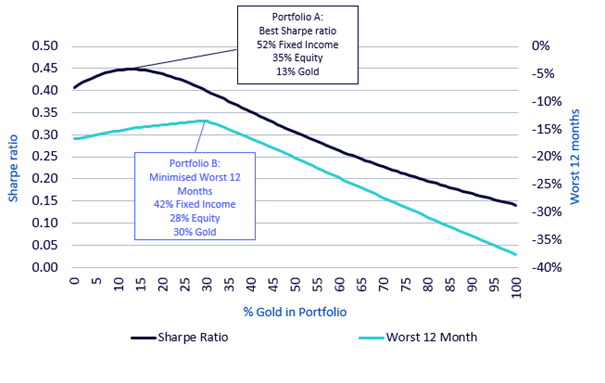
Putting gold into a portfolio of other assets can increase a portfolio’s Sharpe ratio[3] and reduce worst 12-month performances[4]. We illustrate with an example based on data from 1973 to 2024.
- We start with a portfolio of bonds (60%) and equities (40%) and no gold: that is the 0 point on the horizontal axis. The Sharpe ratio of this portfolio is 0.41 and the worst 12-month performance is -17%.
- As we move along the horizontal axis we introduce some gold to the portfolio. The remainder of the portfolio maintains a 60/40 ratio of bonds to equities.
- As we increase gold holdings, Sharpe ratios rise and worst 12-month performances decline, up to a point (before they deteriorate again).
- The maximum Sharpe ratio (portfolio A) is achieved with 13% gold (where the remainder of the portfolio is 52% bonds and 35% equities). The Sharpe ratio is 0.45 in this portfolio.
- The minimum worst 12-month performance (portfolio B) is achieved with 30% gold (where the remainder of the portfolio is 42% bonds and 28% equities). The worst 12-month performance is -13% in this portfolio.
Figure 2: Optimal gold holdings
Source: WisdomTree, Bloomberg. Period January 1973 to September 2024. Calculations are based on monthly returns in USD. The portfolio is rebalanced semi-annually. Equities are proxied by the MSCI World Gross Total Return Index and Fixed Income is proxied by the Bloomberg Barclays US Treasury Total Return Index. You cannot invest directly in an index. Above numbers include backtested data. Historical performance is not an indication of future performance and any investments may go down in value.
Our survey indicates that the mean average holding of gold is only 5.42%[5], well below the optimal to maximise the Sharpe ratio. In fact, less than 14% of investors surveyed[6] hold enough gold to maximise their Sharpe ratio (assuming equities and bonds are the mainstay of their portfolio).
Hedging risks
We established that investors hold gold to hedge various risks, but what is the market’s perception of those risks today and how could they evolve?
Financial market risks
Several metrics gauge market anxiety, including the VIX[7] and MOVE[8] alongside direct investor surveys. At present, none of these measures indicate immediate concern. However, risks can escalate rapidly, as seen in August 2024, when a yen carry trade unwind sparked fears across global financial markets.
With various equity indices reaching all-time highs—and concerns that these gains are heavily concentrated—many investors are seeking ways to hedge against a potential market reversal. Gold serves as a key tool in this context.
Economic risks
The global economy has shown resilience through the past cycle, with the likelihood of a recession in the next year considered low[9]. However, policy uncertainty remains a significant concern for many investors.
In the United States, a new administration has risen to power with a strong focus on trade policies. Should President-Elect Trump impose new tariffs, rather than using them as negotiation tools, it could pose challenges to global economic growth. In this scenario, gold may become a preferred asset for hedging these risks.
Geopolitical risks
Throughout 2024, gold prices were supported by heightened geopolitical tensions. The Russia-Ukraine war and the Israel-Hamas/Hezbollah conflicts dominated investor concerns. More recently, the fall of the Assad regime in Syria has created uncertainty, particularly for Russia, a key ally of Assad. Russia’s military bases in Syria now face an uncertain future, raising concerns about potential escalations.
In November 2024, Ukraine’s use of US and UK-supplied long-range missiles prompted retaliatory strikes from Russia. Coupled with amendments to Russia’s nuclear doctrine, fears of further escalation remain.
President-Elect Trump has promised a swift resolution to the Russia-Ukraine conflict. However, achieving this without significant concessions from Ukraine and NATO seems unlikely, suggesting that geopolitical risks may persist.
Iran, another key supporter of the Assad regime, faces a similarly precarious situation. The weakening of Hamas, Hezbollah, and the Assad alliance undermines Iran’s regional influence. Additionally, the US may enforce sanctions against Iran more rigorously, which could prompt unpredictable responses from Tehran.
Despite speculative positioning in gold futures slipping slightly—from over 300,000 contracts net long in early October 2024 to just below that level today—the ongoing geopolitical tensions may drive positioning higher once again.
Conclusions
Professional investors rightly view gold as a hedge against inflation, financial market turbulence, economic stress, and geopolitical chaos. While some of these risks may not be at the forefront of investors’ concerns today, hedging against the potential escalation of tail risks remains highly valuable.
We also align with the surveyed investors’ belief that gold serves as an excellent portfolio diversifier. Our analysis confirms that incorporating gold into a portfolio enhances overall outcomes, improving returns while effectively managing risk.
This material is prepared by WisdomTree and its affiliates and is not intended to be relied upon as a forecast, research or investment advice, and is not a recommendation, offer or solicitation to buy or sell any securities or to adopt any investment strategy. The opinions expressed are as of the date of production and may change as subsequent conditions vary. The information and opinions contained in this material are derived from proprietary and non-proprietary sources. As such, no warranty of accuracy or reliability is given and no responsibility arising in any other way for errors and omissions (including responsibility to any person by reason of negligence) is accepted by WisdomTree, nor any affiliate, nor any of their officers, employees or agents. Reliance upon information in this material is at the sole discretion of the reader. Past performance is not a reliable indicator of future performance.
[1] WisdomTree Pan European Professional Investor Survey, June-July 2024, 800 respondents, conducted by Censuswide.
[2] Ibid.
[3] The Sharpe ratio compares the return of an investment with its risk. It’s a mathematical expression of the insight that excess returns over a period of time may signify more volatility and risk, rather than investing skill.
[4] Similar risk concept to drawdowns but rather than look at peak to trough performance, we look at fixed 12-month declines.
[5] WisdomTree Pan European Professional Investor Survey, June-July 2024, 800 respondents, conducted by Censuswide.
[6] Ibid.
[7] The Chicago Board Options Exchange’s CBOE Volatility Index (VIX) is a market-implied measure of the volatility of the US equity market.
[8] Merrill Lynch Option Volatility Estimate (MOVE) index is a market-implied measure of the volatility of the US bond market.
[9] Bloomberg’s November/December surveys of professional economists shows the following (average) recession probabilities: US 25%; Euro Area 30%; China 10%; Japan 30%; UK 30%.


Olja och Hormuzsundet fick flest sökningar i maj 2026

VLDS ETF köper amerikanska statsobligationer med högst tio års löptid

Trump planerar att öka drönarfinansieringen

SPPB ETF investerar i eurodenominerade trancher av CLOs

Nya ETF- och ETP-noteringar den 29 maj 2026 på Deutsche Börse

Månadsutdelande fonder fortsätter att locka investerarna mest

35AI ETF köper företagsobligationer som förfall 2035

Bitcoin for beginners: 4 things to know before investing

EDEN ETF investerar i statsobligationer från Eurozonen

Så kan du investera i cybersäkerhet med hjälp av börshandlade fonder
-
 Nyheter4 veckor sedan
Månadsutdelande fonder fortsätter att locka investerarna mest
-
 Nyheter4 veckor sedan
35AI ETF köper företagsobligationer som förfall 2035
-
 Nyheter4 veckor sedan
Bitcoin for beginners: 4 things to know before investing
-
 Nyheter4 veckor sedan
EDEN ETF investerar i statsobligationer från Eurozonen
-
 Nyheter4 veckor sedan
Så kan du investera i cybersäkerhet med hjälp av börshandlade fonder
-

 Nyheter3 veckor sedan
April wrap-up: Bitcoin’s $79,500 – regime shift or bear rally?
-

 Nyheter2 veckor sedan
De bästa ETFerna för att investera i emerging markets
-

 Nyheter6 dagar sedan
USA satsar 2 miljarder dollar på kvantdatorer – så kan investerare dra nytta av utvecklingen