
Nyheter
Köpcentret är inte dött, det har flyttat online

E-handeln, eller e-commerce som det också brukar kallas för, har permanent stört det traditionella detaljhandelslandskapet eftersom ”klick” har ersatt resan till köpcentret. Enligt forskningsföretaget eMarketer förväntas global e-handel närma sig fem biljoner dollar i år, eftersom online-återförsäljare har haft grogrund för att växa sin verksamhet i denna nya era av kontaktlös shopping. I USA ökade e-handelns försäljning till 795 miljarder dollar 2020, en ökning med 32,4% jämfört med 2019, jämfört med tidigare prognoser om 18 procents tillväxt. Det betyder att köpcentret är inte dött, det har flyttat online.
Den globala pandemin har accelererat takten i e-handelstillväxten 2020 och drivit onlineförsäljningen till nivåer som inte tidigare förväntades förrän 2022. Detta hjälper befintliga online-återförsäljare att utöka sin dominans inom detaljhandeln. Mervärdesfunktioner som konkurrenskraftig prissättning, bekvämlighet med shopping, större produktval och snabba leveransalternativ har förstärkt onlinehandel som en störande teknik som är här för att stanna.
Ständigt ökande penetration av internet och mobil är en av de viktigaste drivkrafterna som bidrar till denna tillväxt, vilket gör det möjligt för fler konsumenter att handla online var som helst och när som helst. Nya tekniska innovationer inom elektronisk betalning, snabb leverans, artificiell intelligens och röstassisterad shopping samt virtuell och förstärkt verklighet fortsätter att förbättra online shoppingupplevelsen, vilket ytterligare driver expansionen och tillväxten av detta investeringstema.
På grund av pandemin 2020 lade digital handel till nya kunder som inte tidigare hade handlat på nätet, vilket gett upphov till nya köpvanor för onlinebutikerna, som ökade med 43 procent. Det har emellertid lett till ett trettiotal konkurser bland de stora detaljhandelskedjorna under 2020 och mångdubbelt fler bland de mindre butikerna. Under 2019 var det 17 stora konkurser inom detaljhandeln. Mitt i denna marknadsutveckling har online-detaljhandeln blivit en transformerande och dominerande kraft i global detaljhandel.
Online Retail Value Proposition
Ett antal viktiga fördelar är drivkrafterna bakom tillväxten av e-handel. Dessa fördelar har visat sig vara värdefulla för företag, konsumenter och samhället som helhet.
| Företag | Konsument | Samhälle |
| Lägre kostnader utan en fysisk närvaro | Förbättrat produktval | Mindre trafik och folkmassor |
| Automatiserad lagerhantering | Inga geografiska inköpsgränser | Priskonkurrens och demokratisering av urval |
| Kundanalys | Konkurrenskraftig prissättning, virtuella auktioner | Utökad tillgång för landsbygdsområdena |
| Obegränsad geografisk närvaro | Bekvämlighet med shopping från hem/kontor/mobil enhet 24/7/365 | Ökad shopping och leveranstillgång för hembundna konsumenter |
| Öppet 24/7/365 | Tidsbesparingar för konsumenter, one-stop shop | Underlättad leverans av offentliga tjänster, såsom utbildning och hälsovård |
| Lägre kostnader för reklam- och marknadsföring | Kundrecensioner och sociala insatser | Global omfattning |
| Skalbarhet, färre anställda | Leveransalternativ | Miljövänligt |
Källa: EQM Indexes
Växande global möjlighet
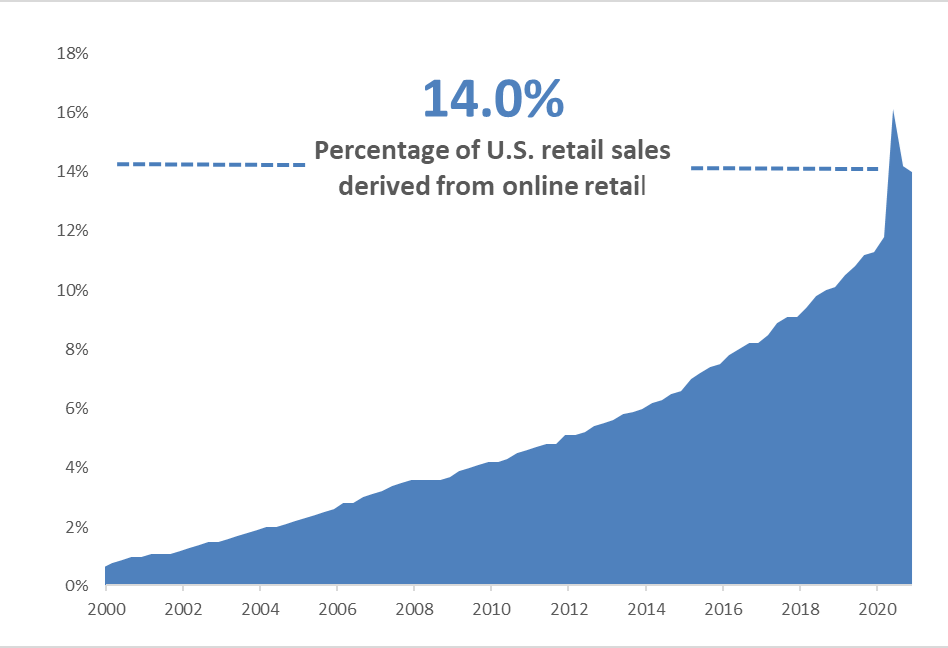
Med tanke på de överlägsna fördelarna som online och virtuell handel ger, är det inte konstigt att denna kanal har vuxit i överlägsen takt än traditionell detaljhandel. USA:s e-handelsförsäljning representerar nu 14,0 procent av den totala detaljhandelsförsäljningen, efter att ha sjunkit något från dess pandemistopp under andra kvartalet 2020.
Globalt växer e-handel också i snabb takt, med en procentuell tillväxt från år till år på 27,6 procent 2020, med försäljningen närmare 4,3 biljoner USD 2020, upp från 3,3 biljoner USD 2019, enligt eMarketer. År 2022 beräknas e-handelns andel av den totala detaljhandelsförsäljningen över hela världen överstiga 20 procent.
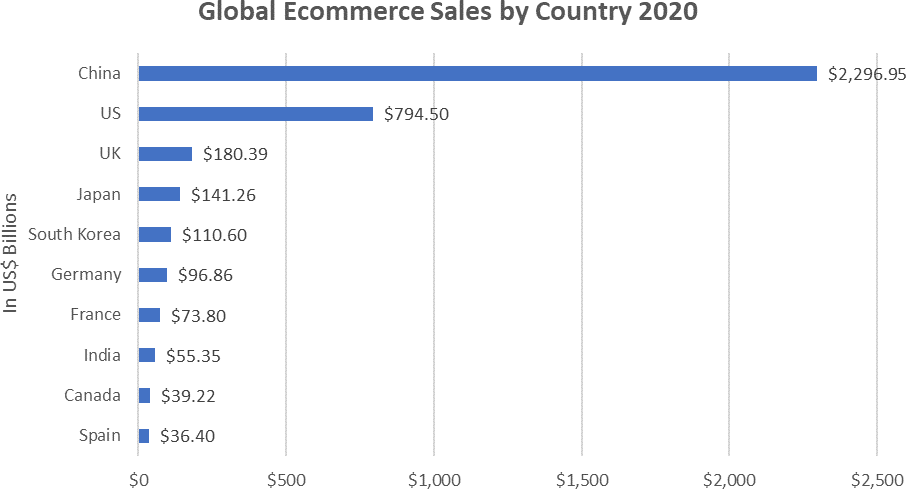
Förutom USA leder länder som Kina och Storbritannien vägen när det gäller antagande av e-handel.
Expanding Internet and Mobile Penetration
Försäljningen inom den mobila e-handeln nådde 2,8 biljoner dollar 2020, en ökning med 32 procent jämfört med de 2,1 biljoner dollar som registrerades 2019, och nu sker mer än hälften av online-transaktionerna på mobiltelefoner.
Större skärmar, engagerande mobila shoppingapplikationer och säkra betalningsalternativ har bidragit till att uppmuntra mobil handelstillväxt. Mobile har exploderat som en shoppingkanal, inte bara ur trafiksynpunkt, utan när det gäller försäljning och dollartillväxt. Mobilhandel förväntas stå för mer än hälften av e-handeln i slutet av 2021.
Mer än 63,2% av världen har nu tillgång till internet och möjlighetsuppsättningen har snabbt utvidgats med bred tillgänglighet över hela världen tack vare smarta mobila enheter som gör det möjligt för konsumenter att handla online var som helst.
Tillväxten av mobil e-handel i Kina, nu 873,3 miljarder dollar i marknadsstorlek, är ett utmärkt exempel på mobilhandelns potential. Kinas mer än en miljard WeChat-användare kan göra inköp på sina smartphones med WeChat Pay utan att lämna plattformen för meddelanden och social handel. Mer än 18 procent av dessa miniprogramsidor ägnas åt e-handel. Kina genererade 268 miljarder dollar i social handel under 2020.
Varumärken, återförsäljare och e-handel kan utforma ett kund-användargränssnitt med bilder, videor och GIF för att öka användarengagemanget. Dessa miniprogrambutiker ger tillgång till kunddata och främjar organisk delning, vilket minskar kostnaderna för nya kundförvärv. Till exempel använder den kinesiska e-återförsäljaren Pinduoduo kampanjkampanjer för att uppmuntra delning mellan kunder.
Teknisk innovation
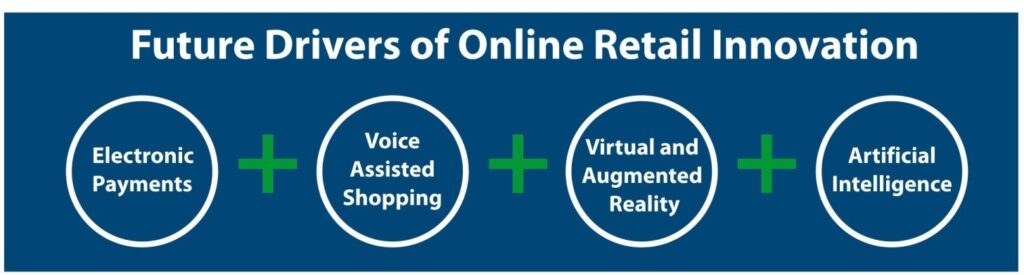
Medan mobil penetration är en stor drivkraft för den nuvarande online-tillväxten, kommer framtida tekniska innovationer som sömlösa och säkra metoder för elektronisk betalning, röstassisterad shopping, virtual och augmented reality och artificiell intelligens att ta online shoppingupplevelsen till nästa nivå och ytterligare driva marknadsutvidgningen.
Man kan argumentera, som konsultföretaget Deloitte gör, att den traditionella detaljhandelsapokalypsen verkligen är en ”renässans” i detaljhandeln. En renässans ökar många av de idéer och uppfattningar som länge har styrt mänskligt beteende, raderat traditioner, institutioner och tankesätt . Den snabba tillväxten och expansionen av e-handeln i detaljhandeln har fått många att förklara ”köpcentret är dött.”
Men vi ser det annorlunda
Renässansen av detaljhandeln i online-shopping erbjuder konsumenterna ett bredare urval av varor, bättre priser och en överlägsen bekvämlighetsnivå. Köpcentret är inte dött, det har flyttat online.
Författaren Jane Edmonson är medskapare av Global Online Retail UCITS ETF (IBUY).
Varför investera i IBUY ETF?
Det finns flera faktorer som stöder den starka tillväxten inom onlinehandel:
• Växande global möjlighet: Medan tillväxten har avtagit för de traditionella detaljhandlarna, fortsätter onlinebutiken att uppvisa starka tillväxtegenskaper, få marknadsandelar och expandera globalt.
• Expanderande Internet- och mobilpenetration: Medan mer än 60% av världen för närvarande har tillgång till Internet växer den möjligheten snabbt tack vare smarta mobila enheter som gör det möjligt för konsumenter att handla var som helst och när som helst online.
• Teknologisk utveckling: Framtida tekniska innovationer som sömlösa och säkra metoder för elektronisk betalning, röstassisterad shopping, virtuell och förstärkt verklighet och artificiell intelligens tar online shoppingupplevelsen till nästa nivå och ytterligare driva marknadsutvidgning och tillväxt.
• Trend påskyndat av Coronaviruset: Även om online-detaljhandeln redan var en störande kraft i detaljhandeln, har pandemin accelererat denna trend och stärkt köpmönstret i många år framöver.
Handla IBUY ETF
Global Online Retail UCITS ETF – Acc (Xetra: IB0Y) handlas på den tyska börsen. Det gör det möjligt för investerare att handla denna börshandlade fond genom en svensk nätmäklare som Nordnet, Avanza som eller DEGIRO. Utöver detta erbjuder även IG handel i denna börshandlade fond.


Nyheter
AI minskar gapet mot försvaret då flödena av europeiska tematiska ETFer når 13,1 miljarder dollar hittills i år

Flödena av europeiska tematiska UCITS-ETFer fortsätter att öka uppåt i takt med att investerare dras mot högt övertygande megatrender, med AI (Artificiell Intelligens), försvar, energi (specifikt uran) och Kinas internet och e-handel alla i ledande positioner.
Viktiga punkter
- AI minskar gapet på försvaret då flödena av europeiska tematiska ETFer når 13,1 miljarder dollar hittills i år
- Försvaret fortsätter att dominera under första till tredje kvartalet (+9,86 miljarder dollar)
- AI toppar nettoinflödena för augusti och september
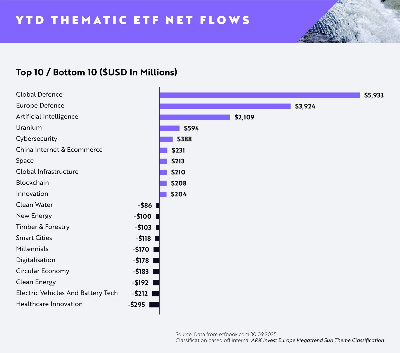
Globala försvars-ETFer fortsätter att leda flödena hittills i år (YTD) med +5,93 miljarder dollar i nettoflöden, med europeiska försvars-ETFer på andra plats med +3,92 miljarder dollar i nettoflöden.
Emellertid har ETFer inom artificiell intelligens sett en anmärkningsvärd ökning i efterfrågan sedan slutet av första halvåret 2025, med dominerande inflöden under augusti och september för att nå nästan +2,11 miljarder dollar i nettoflöden hittills i dag. Detta motsvarar en ökning med cirka 133 % i nettoflöden sedan slutet av första halvåret jämfört med Global Defence på +23 % och European Defence på 29 %.
Investerarnas aptit för försvar är fortsatt stark då geopolitiska risker och moderna krigföringskrav driver strukturella medvindar för sektorn. Försvarsentreprenörer i framkant inom avancerad flyg- och rymdteknik, cybersäkerhet och drönarteknik tar en växande andel av de globala upphandlingsbudgetarna.
I Europa är allokeringarna fortfarande höga då regeringar över hela kontinenten reagerar på nya säkerhetsrealiteter med ökade utgiftsåtaganden. Investerare verkar fokuserade på lokala ledare med exponering mot underrättelsesystem, försvarselektronik och strategisk tillverkning.
Den ökade efterfrågan på ETFer inom artificiell intelligens visar att innovationstakten inom generativa modeller och företags-AI fortfarande är en viktig magnet för kapital. Investerare föredrar plattformar med skalbar AI-infrastruktur och exponering mot verkliga applikationer inom programvara, halvledare och robotteknik.
På andra håll rankades uran-ETFer på fjärde plats med +594 miljoner dollar i nettoflöden, medan cybersäkerhets-ETFer rankades på femte plats med +388 miljoner dollar. Båda teman fortsätter att attrahera kapital tack vare tydliga men hållbara drivkrafter: uran från den förnyade satsningen mot kärnkraft i övergången till ren energi och cybersäkerhet från eskalerande digitala hot och växande efterfrågan på motståndskraftig infrastruktur.
Rahul Bhushan, VD och global chef för investeringsprodukter på ARK Invest, kommenterade flödena: ”Investerare ompositionerar sig aktivt mot innovationsdrivna, strukturellt drivna teman i en föränderlig makromiljö. Med geopolitiska risker, genombrott inom generativa modeller och AI-ledd innovation uttrycker investerare starka åsikter om megatrender snarare än breda, odifferentierade exponeringar. Det är tydligt att tematiska ETFer inte längre bara är taktiska satsningar, de är centrala strategiska exponeringar.”


HANetfs Hector McNeil förklarar hur ETFer genererar hög avkastning med covered calls

JPEY ETF högavkastande företagsobligationer vautasäkrade till Euro

AI minskar gapet mot försvaret då flödena av europeiska tematiska ETFer når 13,1 miljarder dollar hittills i år

XMME ETF – Levler MSCI EM by Xtrackers

34GI ETF bara eurodenominerade företagsobligationer med förfall 2024

De bästa lågvolatilitets ETFer på marknaden

Fokus mot en helt ny börshandlad produkt i september 2025

M5TYs senaste utdelningstakt (55 %) belyser covered call-strategins inkomstpotential
Could Bitcoin be the key to your dream house?

Börshandlade fonder för europeiska small caps
-
 Nyheter4 veckor sedan
De bästa lågvolatilitets ETFer på marknaden
-
 Nyheter3 veckor sedan
Fokus mot en helt ny börshandlad produkt i september 2025
-
 Nyheter4 veckor sedan
M5TYs senaste utdelningstakt (55 %) belyser covered call-strategins inkomstpotential
-

 Nyheter4 veckor sedan
Could Bitcoin be the key to your dream house?
-
 Nyheter3 veckor sedan
Börshandlade fonder för europeiska small caps
-

 Nyheter2 veckor sedan
Levler noterar ytterligare fyra börshandlade fonder i Sverige
-
 Nyheter4 veckor sedan
The Investment Case for TLT (Long-Dated Treasury Bonds)
-

 Nyheter3 veckor sedan
Miners Find Their Mojo as Gold Consolidates