
Nyheter
Keep the Pedal to the Metal
Keep the Pedal to the Metal. Those of you who recall the CB (citizens band) radio craze of the 1970s may recognize the following expression the era spawned: ”Keep the pedal to the metal.” Its fundamental meaning — push ahead with determination — comes to mind as I consider what I believe is the optimal municipal bond strategy at this time.
Following recent and very thoughtful guest contributions to Muni Nation, I thought it’s time I provide my outlook for the remainder of the second quarter. Firstly, I think it is important to take note of the municipal market’s performance thus far in 2016 (through April 29). Returns were positive each of the last four months; the market is up 2.42% year-to-date1. The eight consecutive months of cash inflows into muni funds that helped fuel these gains highlight the key fundamentals supporting this market: a modest increase in new bond supply, the historically low default rate2 underlying the majority of issues, and the taxable equivalent yields compared to many taxable alternatives.

(click to enlarge)
Source: Barclays. For illustrative purposes only. Index performance is not indicative of fund performance. Past performance is no guarantee of future performance. Municipal index yields reflect taxable equivalent yields, based on the highest U.S. Federal income tax rate of 39.6%. If an investor were in a lower tax bracket, the yields would have been lower.
Additionally, I believe that yields should hold at or near current levels even in the unlikely event that the Federal Reserve pushes interest rates higher before the end of the year. I would continue to expect munis to deliver relatively favorable returns.
Invoking the title of this piece, I suggest again: keep the pedal to the metal. Municipals can continue to form an important part of an investor’s core strategy in the near future. Investors should not deviate from employing municipal bonds, both tactically and strategically, in their portfolios. Stay the course.
Post Specific Disclosures
1Source: Barclays. Based on the Barclays Municipal Bond Index. The index is considered representative of the broad market for investment grade, tax-exempt bonds with a maturity of at least one year.
2Source: Moody’s Investors Services.
Yield to Worst measures the lowest of either yield-to-maturity or yield-to-call date on every possible call date.
Taxable equivalent yields are used by investors to compare yields on taxable and tax-exempt securities after accounting for federal income taxes. TEY represents the yield a taxable bond investment would have to earn in order to match, after deducting federal income taxes, the yield available on a tax-exempt municipal bond investment. TEY = Tax-Free Municipal Bond Yield/(1 -Tax Rate).
The graph displays the yields of the Barclays Municipal Bond Index and Barclays High-Yield Municipal Index on a tax-equivalent return basis and compares such yields to other asset classes as represented by the indexes described below. Fixed income investments have interest rate risk, which refers to the risk that bond prices generally fall as interest rates rise and vice versa. U.S. government bonds are guaranteed by the full faith and credit of the United States government. Municipal and corporate bonds are not guaranteed by the full faith and credit of the United States and carry the credit risk of the issuer. Municipal bonds are exempt from federal taxes and often state and local taxes. U.S. Treasuries are exempt from state and local taxes, but subject to federal taxes. Prices of bonds change in response to factors such as interest rates and issuer’s credit worthiness, among others.
The Barclays Municipal Bond Index is considered representative of the broad market for investment grade, tax-exempt bonds with a maturity of at least one year. The Barclays High-Yield Municipal Bond Index is considered representative of the broad market for below investment grade, tax-exempt bonds with a maturity of at least one year. The Barclays U.S. Corporate Bond Index is considered representative of the broad market for investment grade U.S. corporate bonds with a maturity of at least one year. The Barclays U.S. Treasury Index is considered representative of public obligations of the U.S. Treasury with a remaining maturity of at least one year.

by James Colby, Portfolio Manager
James Colby has more than 30 years of fixed income experience. Portfolio Manager of Municipal Bond ETFs at VanEck, he is known for his perspective on the U.S. municipal bond marketplace.
IMPORTANT MUNI NATION® DISCLOSURE
This content is published in the United States for residents of specified countries. Investors are subject to securities and tax regulations within their applicable jurisdictions that are not addressed on this content. Nothing in this content should be considered a solicitation to buy or an offer to sell shares of any investment in any jurisdiction where the offer or solicitation would be unlawful under the securities laws of such jurisdiction, nor is it intended as investment, tax, financial, or legal advice. Investors should seek such professional advice for their particular situation and jurisdiction.
VanEck does not provide tax, legal or accounting advice. Investors should discuss their individual circumstances with appropriate professionals before making any decisions. This information should not be construed as sales or marketing material or an offer or solicitation for the purchase or sale of any financial instrument, product or service.
Please note this post represents the views of the author and these views may change at any time and from time to time. MUNI NATION is not intended to be a forecast of future events, a guarantee of future results or investment advice. Current market conditions may not continue. Non-VanEck proprietary information contained herein has been obtained from sources believed to be reliable, but not guaranteed. No part of this material may be reproduced in any form, or referred to in any other publication, without express written permission of VanEck. MUNI NATION is a trademark of Van Eck Associates Corporation.
All indices listed are unmanaged indices and do not reflect the payment of transaction costs, advisory fees or expenses that are associated with an investment in a fund. An index’s performance is not illustrative of a fund’s performance. Indices are not securities in which investments can be made.
Any discussion of specific securities mentioned in the commentary is neither an offer to sell nor a solicitation to buy these securities.
Municipal bonds are subject to risks related to litigation, legislation, political change, conditions in underlying sectors or in local business communities and economies, bankruptcy or other changes in the issuer’s financial condition, and/or the discontinuance of taxes supporting the project or assets or the inability to collect revenues for the project or from the assets. Bonds and bond funds will decrease in value as interest rates rise. Additional risks include credit, interest rate, call, reinvestment, tax, market and lease obligation risk. High-yield municipal bonds are subject to greater risk of loss of income and principal than higher-rated securities, and are likely to be more sensitive to adverse economic changes or individual municipal developments than those of higher-rated securities. Municipal bonds may be less liquid than taxable bonds.
The income generated from some types of municipal bonds may be subject to state and local taxes as well as to federal taxes on capital gains and may also be subject to alternative minimum tax.
Diversification does not assure a profit or protect against loss.
Investing involves substantial risk and high volatility, including possible loss of principal. Bonds and bond funds will decrease in value as interest rates rise. An investor should consider the investment objective, risks, charges and expenses of a fund carefully before investing. To obtain a prospectus and summary prospectus, which contain this and other information, call 800.826.2333. Please read the prospectus and summary prospectus carefully before investing.
Van Eck Securities Corporation, Distributor
666 Third Avenue
New York, NY 10017
800.826.2333


As April winds down, markets remain on edge, with escalating tariffs and renewed trade tensions keeping volatility in focus. In this summary of our full-length newsletter, we spotlight gold and gold equities, both of which have surged to record levels. We also take a step back from the day-to-day noise in crypto to explore the broader shifts in the regulatory landscape in our latest Whitepaper and present Celestia in detail. Finally, we assess how Moat indexes have held up and evolved amid the turbulence.
Your VanEck Europe team wishes you a great read.
Featured Articles
🥇 Are Gold Mining Equities Regaining Attention Amid Rising Gold Prices?
Gold & Gold mining equities tend to shine during stress periods
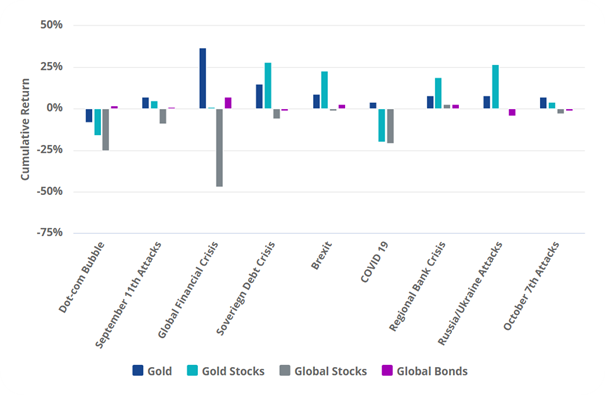
Source: VanEck, World Gold Council.
Gold has attracted renewed interest from investors amid concerns about inflation, currency volatility, and overall market uncertainty. Gold mining companies have recently reported improved profit margins and cash generation, with some initiating share buybacks and maintaining relatively strong balance sheets. Despite these developments, many continue to trade below their historical valuation averages.
While historical trends indicate that gold and gold mining equities have outperformed during certain periods of market stress, these patterns may not repeat under different economic conditions. Performance can be influenced by a range of factors including interest rates, central bank policy, geopolitical developments, and investor sentiment.
→ Read more
⚖️ Whitepaper Highlights: How New Crypto Regulations May Shape the Future
Cryptocurrencies are entering a new era. With the re-election of Donald Trump and the implementation of the European Union’s Markets in Crypto-Assets (MiCA) regulation, digital assets are moving into a landscape defined not just by innovation, but also by regulatory clarity.
MiCA’s structured and transparent approach aims to promote legitimacy, safeguard investors, and enhance trust in digital asset markets across Europe. It could also serve as a blueprint for other jurisdictions looking to regulate crypto effectively.
→ Read the Whitepaper Highlights
⛓️ Introduction to Celestia
Most blockchains, like Ethereum or Bitcoin, are monolithic which means they perform all major functions (consensus, data availability, and execution) on a single layer. This design ensures security but according to new modular networks, limits scalability and flexibility.
The modular blockchain thesis, which Celestia is leading, proposes separation of layers and respective responsibilities in the network.
→ Read more
Note: This article in not accessible to our UK readers.
🌊 Riding the Gold Wave
Chasing the Vein: Fund Flows into Gold Miners
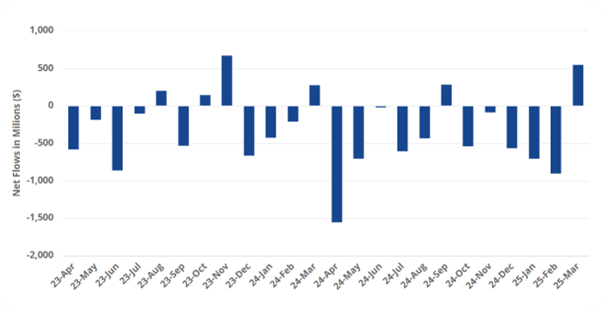
Source: Mining.com. Data as of 21 March 2025. Note: Data covers 493 funds with combined assets under management of $62 billion.
U.S. equity markets experienced significant declines during the month of March. Meanwhile, spot gold price recorded new all-time highs, surpassing the $3,000 per ounce mark on 14 March and closing at a record price of $3123.57 on March 31, a 9.30% ($265.73) monthly gain. As of 31 March, gold prices have risen by 93.61% over the past five years (1). Investors should keep in mind that past performance is not representative of future results.
The gold miners, as represented by the NYSE Arca Gold Miners Index (GDMNTR), outperformed significantly, up 15.51% during March (2). This gain reflects both their operational leverage to rising gold prices and market perceptions of relative value. However, gold miners can also be subject to heightened volatility, operational risks, and sensitivity to commodity price swings.
While gold and gold equities may serve as diversifiers in a portfolio due to their historically low correlations with many asset classes, investors should remain mindful of the inherent risks, including price volatility, currency movements, and shifts in investor sentiment that can lead to rapid reversals in performance.
→ Read more
🌪️ Moat Stocks Weather Tariff Tumble
Market turbulence in March weighed on stocks. The Moat Index was not immune to the market turmoil, as it declined along with the broad U.S. equity market ending the month lower. However, the Moat Index showed resilience relative to the S&P 500—thanks in part to defensive sector resilience and underweight exposure to mega-caps.
At the same time, the SMID Moat Index lagged small and mid-caps in March. Smaller U.S. stocks were also impacted by global trade tensions and economic growth concerns with the broad small- and mid-cap benchmarks falling during the month. However, year-to-date, the SMID Moat Index remains ahead of the broader small- and mid-cap markets.
This is a preview of our monthly ETF insights email newsletter.
To receive the full version, sign up here.
(1) Source: World Gold Council, ICE Data Services, FactSet Research Systems Inc.
(2) Source: Financial Times.
IMPORTANT INFORMATION
This is marketing communication. Please refer to the prospectus of the UCITS and to the KID/KIID before making any final investment decisions. These documents are available in English and the KIDs/KIIDs in local languages and can be obtained free of charge at www.vaneck.com, from VanEck Asset Management B.V. (the “Management Company”) or, where applicable, from the relevant appointed facility agent for your country.
For investors in Switzerland: VanEck Switzerland AG, with registered office in Genferstrasse 21, 8002 Zurich, Switzerland, has been appointed as distributor of VanEck´s products in Switzerland by the Management Company. A copy of the latest prospectus, the Articles, the Key Information Document, the annual report and semi-annual report can be found on our website www.vaneck.com or can be obtained free of charge from the representative in Switzerland: Zeidler Regulatory Services (Switzerland) AG, Neudtadtgasse 1a, 8400 Winterthur, Switzerland. Swiss paying agent: Helvetische Bank AG, Seefeldstrasse 215, CH-8008 Zürich.
For investors in the UK: This is a marketing communication targeted to FCA regulated financial intermediaries. Retail clients should not rely on any of the information provided and should seek assistance from a financial intermediary for all investment guidance and advice. VanEck Securities UK Limited (FRN: 1002854) is an Appointed Representative of Sturgeon Ventures LLP (FRN: 452811), which is authorised and regulated by the Financial Conduct Authority (FCA) in the UK, to distribute VanEck´s products to FCA regulated firms such as financial intermediaries and Wealth Managers.
This information originates from VanEck (Europe) GmbH, which is authorized as an EEA investment firm under MiFID under the Markets in Financial Instruments Directive (“MiFiD). VanEck (Europe) GmbH has its registered address at Kreuznacher Str. 30, 60486 Frankfurt, Germany, and has been appointed as distributor of VanEck products in Europe by the Management Company. The Management Company is incorporated under Dutch law and registered with the Dutch Authority for the Financial Markets (AFM).
This material is only intended for general and preliminary information and shall not be construed as investment, legal or tax advice. VanEck (Europe) GmbH and its associated and affiliated companies (together “VanEck”) assume no liability with regards to any investment, divestment or retention decision on the basis of this information. The views and opinions expressed are those of the author(s) but not necessarily those of VanEck. Opinions are current as of the publication date and are subject to change with market conditions. Information provided by third party sources is believed to be reliable and have not been independently verified for accuracy or completeness and cannot be guaranteed.
Morningstar® Wide Moat Focus IndexSM, Morningstar® US Sustainability Moat Focus Index, Morningstar® US Small-Mid Cap Moat Focus IndexSM, and Morningstar® Global Wide Moat Focus IndexSM are trademarks or service marks of Morningstar, Inc. and have been licensed for use for certain purposes by VanEck. VanEck’s ETFs are not sponsored, endorsed, sold or promoted by Morningstar, and Morningstar makes no representation regarding the advisability of investing in the ETFs. Morningstar bears no liability with respect to the ETFs or any securities.
Effective December 15, 2023, the carbon risk rating screen was removed from the Morningstar® US Sustainability Moat Focus Index. Effective December 17, 2021, the Morningstar® Wide Moat Focus IndexTM was replaced with the Morningstar® US Sustainability Moat Focus Index. Effective June 20, 2016, Morningstar implemented several changes to the Morningstar® Wide Moat Focus Index construction rules. Among other changes, the index increased its constituent count from 20 stocks to at least 40 stocks and modified its rebalance and reconstitution methodology. These changes may result in more diversified exposure, lower turnover, and longer holding periods for index constituents than under the rules in effect prior to that date.
NYSE Arca Gold Miners Index is a service mark of ICE Data Indices, LLC or its affiliates (“ICE Data”) and has been licensed for use by VanEck UCITS ETF plc (the “Fund”) in connection with the ETF. Neither the Fund nor the ETF is sponsored, endorsed, sold or promoted by ICE Data. ICE Data makes no representations or warranties regarding the Fund or the ETF or the ability of the NYSE Arca Gold Miners Index to track general stock market performance. ICE DATA MAKES NO EXPRESS OR IMPLIED WARRANTIES, AND HEREBY EXPRESSLY DISCLAIMS ALL WARRANTIES OF MERCHANTABILITY OR FITNESS FOR A PARTICULAR PURPOSE WITH RESPECT TO THE NYSE ARCA GOLD MINERS INDEX OR ANY DATA INCLUDED THEREIN. IN NO EVENT SHALL ICE DATA HAVE ANY LIABILITY FOR ANY SPECIAL, PUNITIVE, INDIRECT, OR CONSEQUENTIAL DAMAGES (INCLUDING LOST PROFITS), EVEN IF NOTIFIED OF THE POSSIBILITY OF SUCH DAMAGES. ICE Data Indices, LLC and its affiliates (“ICE Data”) indices and related information, the name “ICE Data”, and related trademarks, are intellectual property licensed from ICE Data, and may not be copied, used, or distributed without ICE Data’s prior written approval. The Fund has not been passed on as to its legality or suitability, and is not regulated, issued, endorsed’ sold, guaranteed, or promoted by ICE Data.
The S&P 500 Index (“Index”) is a product of S&P Dow Jones Indices LLC and/or its affiliates and has been licensed for use by Van Eck Associates Corporation. Copyright © 2020 S&P Dow Jones Indices LLC, a division of S&P Global, Inc., and/or its affiliates. All rights reserved. Redistribution or reproduction in whole or in part are prohibited without written permission of S&P Dow Jones Indices LLC. For more information on any of S&P Dow Jones Indices LLC’s indices please visit www.spdji.com. S&P® is a registered trademark of S&P Global and Dow Jones® is a registered trademark of Dow Jones Trademark Holdings LLC. Neither S&P Dow Jones Indices LLC, Dow Jones Trademark Holdings LLC, their affiliates nor their third party licensors make any representation or warranty, express or implied, as to the ability of any index to accurately represent the asset class or market sector that it purports to represent and neither S&P Dow Jones Indices LLC, Dow Jones Trademark Holdings LLC, their affiliates nor their third party licensors shall have any liability for any errors, omissions, or interruptions of any index or the data included therein.
It is not possible to invest directly in an index.
Investing is subject to risk, including the possible loss of principal. Investors must buy and sell units of the UCITS on the secondary market via an intermediary (e.g. a broker) and cannot usually be sold directly back to the UCITS. Brokerage fees may incur. The buying price may exceed, or the selling price may be lower than the current net asset value. The indicative net asset value (iNAV) of the UCITS is available on Bloomberg. The Management Company may terminate the marketing of the UCITS in one or more jurisdictions. The summary of the investor rights is available in English at: complaints-procedure.pdf (vaneck.com). For any unfamiliar technical terms, please refer to ETF Glossary | VanEck.
No part of this material may be reproduced in any form, or referred to in any other publication, without express written permission of VanEck.
© VanEck (Europe) GmbH ©VanEck Switzerland AG © VanEck Securities UK Limited


April in ETFs: Gold at New Highs, Crypto in Transition, and Moat Index Holding Steady

BBVAE ETF är en spansk ETF som spårar Eurostoxx 50
The Art of Meme-ing: How Dogecoin Redefined Value

VGGF ETF köper statsobligationer från hela världen

Vilka ETFer investerar i europeiska Small Cap-aktier?

Montrose storsatsning på ETFer fortsätter – lanserar Sveriges första globala ETF med hävstång

MONTLEV, Sveriges första globala ETF med hävstång

Sju börshandlade fonder som investerar i försvarssektorn

Världens första europeiska försvars-ETF från ett europeiskt ETF-företag lanseras på Xetra och Euronext Paris

Europeisk försvarsutgiftsboom: Viktiga investeringsmöjligheter mitt i globala förändringar
-
 Nyheter4 veckor sedan
Montrose storsatsning på ETFer fortsätter – lanserar Sveriges första globala ETF med hävstång
-
 Nyheter4 veckor sedan
MONTLEV, Sveriges första globala ETF med hävstång
-
 Nyheter4 veckor sedan
Sju börshandlade fonder som investerar i försvarssektorn
-
 Nyheter4 veckor sedan
Världens första europeiska försvars-ETF från ett europeiskt ETF-företag lanseras på Xetra och Euronext Paris
-
 Nyheter4 veckor sedan
Europeisk försvarsutgiftsboom: Viktiga investeringsmöjligheter mitt i globala förändringar
-

 Nyheter3 veckor sedan
21Shares bildar exklusivt partnerskap med House of Doge för att lansera Dogecoin ETP i Europa
-

 Nyheter2 veckor sedan
HANetfs Tom Bailey om framtiden för europeiska försvarsfonder
-

 Nyheter1 vecka sedan
Fastställd utdelning i MONTDIV april 2025