
Nyheter
Keep the Pedal to the Metal
Keep the Pedal to the Metal. Those of you who recall the CB (citizens band) radio craze of the 1970s may recognize the following expression the era spawned: ”Keep the pedal to the metal.” Its fundamental meaning — push ahead with determination — comes to mind as I consider what I believe is the optimal municipal bond strategy at this time.
Following recent and very thoughtful guest contributions to Muni Nation, I thought it’s time I provide my outlook for the remainder of the second quarter. Firstly, I think it is important to take note of the municipal market’s performance thus far in 2016 (through April 29). Returns were positive each of the last four months; the market is up 2.42% year-to-date1. The eight consecutive months of cash inflows into muni funds that helped fuel these gains highlight the key fundamentals supporting this market: a modest increase in new bond supply, the historically low default rate2 underlying the majority of issues, and the taxable equivalent yields compared to many taxable alternatives.

(click to enlarge)
Source: Barclays. For illustrative purposes only. Index performance is not indicative of fund performance. Past performance is no guarantee of future performance. Municipal index yields reflect taxable equivalent yields, based on the highest U.S. Federal income tax rate of 39.6%. If an investor were in a lower tax bracket, the yields would have been lower.
Additionally, I believe that yields should hold at or near current levels even in the unlikely event that the Federal Reserve pushes interest rates higher before the end of the year. I would continue to expect munis to deliver relatively favorable returns.
Invoking the title of this piece, I suggest again: keep the pedal to the metal. Municipals can continue to form an important part of an investor’s core strategy in the near future. Investors should not deviate from employing municipal bonds, both tactically and strategically, in their portfolios. Stay the course.
Post Specific Disclosures
1Source: Barclays. Based on the Barclays Municipal Bond Index. The index is considered representative of the broad market for investment grade, tax-exempt bonds with a maturity of at least one year.
2Source: Moody’s Investors Services.
Yield to Worst measures the lowest of either yield-to-maturity or yield-to-call date on every possible call date.
Taxable equivalent yields are used by investors to compare yields on taxable and tax-exempt securities after accounting for federal income taxes. TEY represents the yield a taxable bond investment would have to earn in order to match, after deducting federal income taxes, the yield available on a tax-exempt municipal bond investment. TEY = Tax-Free Municipal Bond Yield/(1 -Tax Rate).
The graph displays the yields of the Barclays Municipal Bond Index and Barclays High-Yield Municipal Index on a tax-equivalent return basis and compares such yields to other asset classes as represented by the indexes described below. Fixed income investments have interest rate risk, which refers to the risk that bond prices generally fall as interest rates rise and vice versa. U.S. government bonds are guaranteed by the full faith and credit of the United States government. Municipal and corporate bonds are not guaranteed by the full faith and credit of the United States and carry the credit risk of the issuer. Municipal bonds are exempt from federal taxes and often state and local taxes. U.S. Treasuries are exempt from state and local taxes, but subject to federal taxes. Prices of bonds change in response to factors such as interest rates and issuer’s credit worthiness, among others.
The Barclays Municipal Bond Index is considered representative of the broad market for investment grade, tax-exempt bonds with a maturity of at least one year. The Barclays High-Yield Municipal Bond Index is considered representative of the broad market for below investment grade, tax-exempt bonds with a maturity of at least one year. The Barclays U.S. Corporate Bond Index is considered representative of the broad market for investment grade U.S. corporate bonds with a maturity of at least one year. The Barclays U.S. Treasury Index is considered representative of public obligations of the U.S. Treasury with a remaining maturity of at least one year.

by James Colby, Portfolio Manager
James Colby has more than 30 years of fixed income experience. Portfolio Manager of Municipal Bond ETFs at VanEck, he is known for his perspective on the U.S. municipal bond marketplace.
IMPORTANT MUNI NATION® DISCLOSURE
This content is published in the United States for residents of specified countries. Investors are subject to securities and tax regulations within their applicable jurisdictions that are not addressed on this content. Nothing in this content should be considered a solicitation to buy or an offer to sell shares of any investment in any jurisdiction where the offer or solicitation would be unlawful under the securities laws of such jurisdiction, nor is it intended as investment, tax, financial, or legal advice. Investors should seek such professional advice for their particular situation and jurisdiction.
VanEck does not provide tax, legal or accounting advice. Investors should discuss their individual circumstances with appropriate professionals before making any decisions. This information should not be construed as sales or marketing material or an offer or solicitation for the purchase or sale of any financial instrument, product or service.
Please note this post represents the views of the author and these views may change at any time and from time to time. MUNI NATION is not intended to be a forecast of future events, a guarantee of future results or investment advice. Current market conditions may not continue. Non-VanEck proprietary information contained herein has been obtained from sources believed to be reliable, but not guaranteed. No part of this material may be reproduced in any form, or referred to in any other publication, without express written permission of VanEck. MUNI NATION is a trademark of Van Eck Associates Corporation.
All indices listed are unmanaged indices and do not reflect the payment of transaction costs, advisory fees or expenses that are associated with an investment in a fund. An index’s performance is not illustrative of a fund’s performance. Indices are not securities in which investments can be made.
Any discussion of specific securities mentioned in the commentary is neither an offer to sell nor a solicitation to buy these securities.
Municipal bonds are subject to risks related to litigation, legislation, political change, conditions in underlying sectors or in local business communities and economies, bankruptcy or other changes in the issuer’s financial condition, and/or the discontinuance of taxes supporting the project or assets or the inability to collect revenues for the project or from the assets. Bonds and bond funds will decrease in value as interest rates rise. Additional risks include credit, interest rate, call, reinvestment, tax, market and lease obligation risk. High-yield municipal bonds are subject to greater risk of loss of income and principal than higher-rated securities, and are likely to be more sensitive to adverse economic changes or individual municipal developments than those of higher-rated securities. Municipal bonds may be less liquid than taxable bonds.
The income generated from some types of municipal bonds may be subject to state and local taxes as well as to federal taxes on capital gains and may also be subject to alternative minimum tax.
Diversification does not assure a profit or protect against loss.
Investing involves substantial risk and high volatility, including possible loss of principal. Bonds and bond funds will decrease in value as interest rates rise. An investor should consider the investment objective, risks, charges and expenses of a fund carefully before investing. To obtain a prospectus and summary prospectus, which contain this and other information, call 800.826.2333. Please read the prospectus and summary prospectus carefully before investing.
Van Eck Securities Corporation, Distributor
666 Third Avenue
New York, NY 10017
800.826.2333


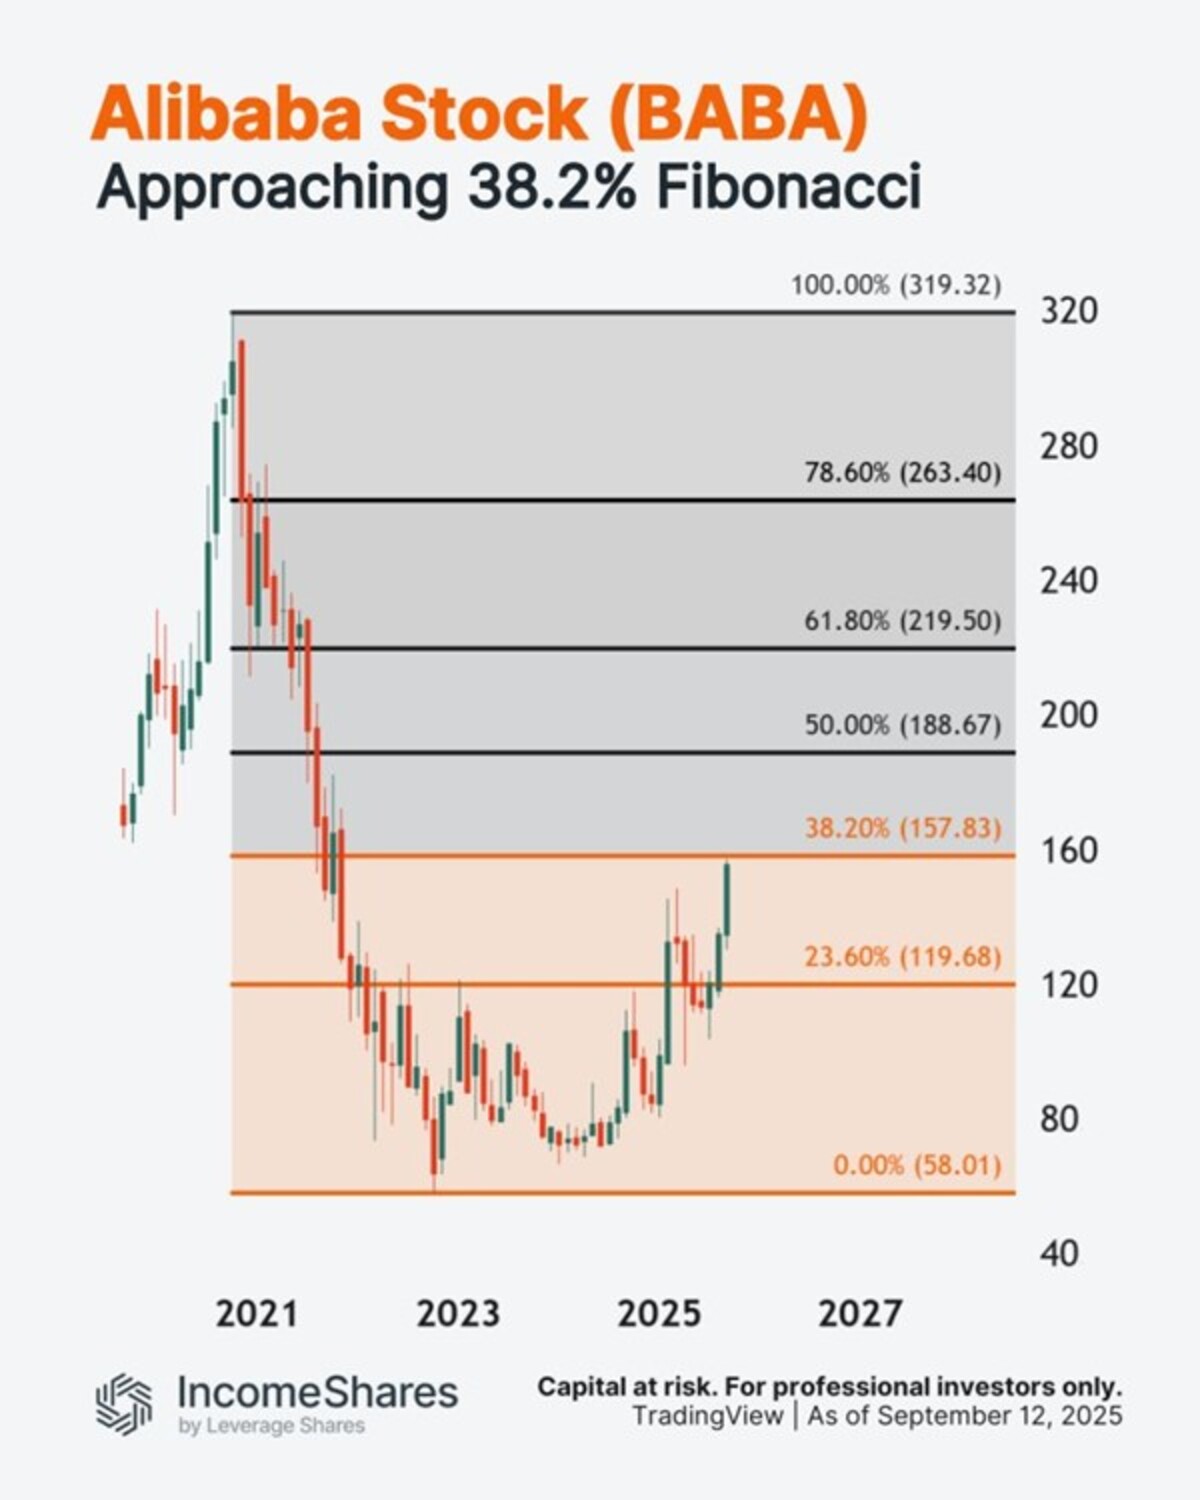
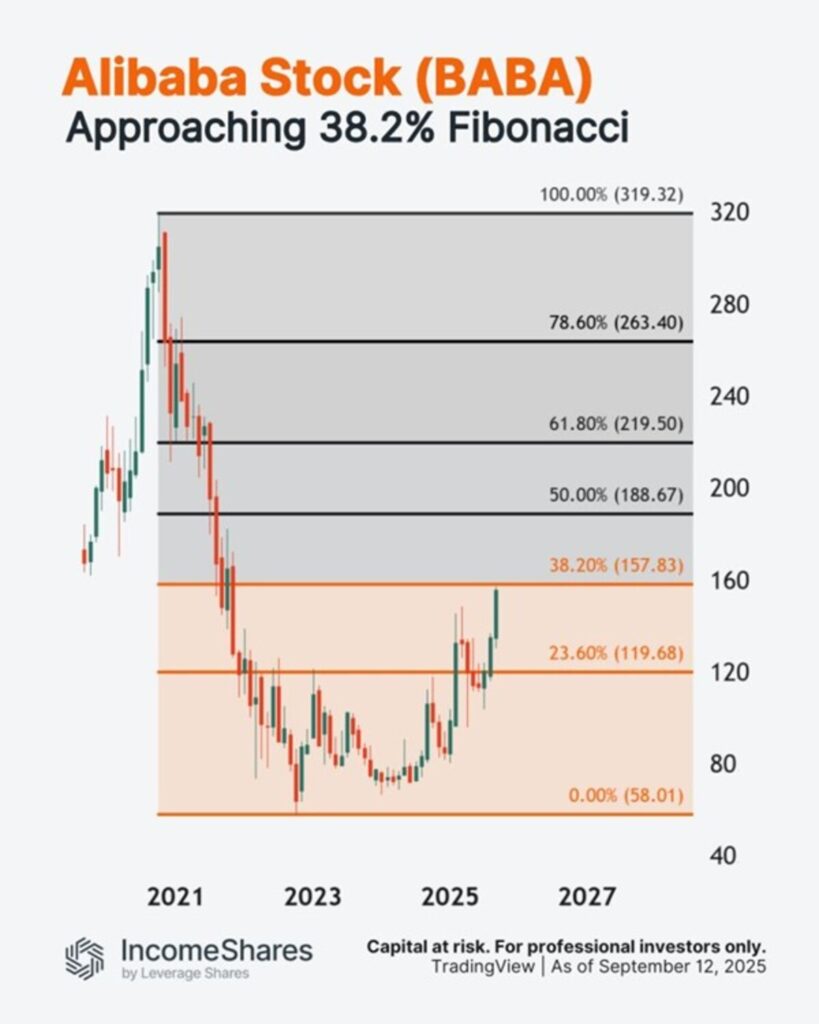
Alibaba-aktien steg med 8 % igår – och är upp cirka 30 % sedan början av juli. Men aktien närmar sig nu ett område med potentiellt ”motstånd”: 38,2 % Fibonacci-retracement.
Så här fungerar 38,2 % Fibonacci-matematiken:
- BABA sjönk med 261,31 dollar från oktober 2020s högsta nivå på 319,32 dollar.
- 38,2 % av 261,31 dollar = 99,82 dollar.
- Lägg till 99,82 dollar till oktober 2022s lägsta nivå på 58,01 dollar för att få 157,83 dollar.
Vissa tekniska handlare använder Fibonacci-retracement för vinsthemtagning – vilket kan skapa säljtryck på dessa nivåer. Diagrammet visar resten av dem.
IncomeShares Alibaba Options ETP använder en kontantsäkrad säljoption plus aktiestrategi på Alibaba-aktier. Detta ger exponering mot aktiens utveckling, med potential för månatlig inkomst.
Följ IncomeShares EU för fler diagram.


IVCS ETF ger exponering mot företag som arbetar med cybersäkerhet

Vägen tillbaka till rekordnivåer är kantad av Fibonacci-motståndsnivåer

COINDOT ETP spårar kryptovalutan Polkadot

VettaFis Stacey Morris ser tillväxt i mellanströmssektorn framöver tack vare ökande efterfrågan på LNG och starkt fritt kassaflöde

EXCN ETF investerar i emerging markets men exkluderar Kina

Utdelningar och försvarsfonder lockade i augusti

Månadsutdelande ETFer uppdaterad med IncomeShares produkter

HANetfs analyserar hur ett fredsavtal kan påverka det europeiska försvaret

HANetfs VD kommenterar Trump-Putin-toppmötet

ADLT ETF investerar bara i riktigt långa amerikanska statsobligationer
-
 Nyheter2 veckor sedan
Utdelningar och försvarsfonder lockade i augusti
-
 Nyheter3 veckor sedan
Månadsutdelande ETFer uppdaterad med IncomeShares produkter
-
 Nyheter3 veckor sedan
HANetfs analyserar hur ett fredsavtal kan påverka det europeiska försvaret
-
 Nyheter4 veckor sedan
HANetfs VD kommenterar Trump-Putin-toppmötet
-
 Nyheter3 veckor sedan
ADLT ETF investerar bara i riktigt långa amerikanska statsobligationer
-

 Nyheter1 vecka sedan
Septembers utdelning i XACT Norden Högutdelande
-

 Nyheter3 veckor sedan
Fastställd utdelning i MONTDIV augusti 2025
-

 Nyheter1 vecka sedan
HANetf kommenterar mötet mellan Kina, Ryssland och Nordkorea vid militärparad