Investment Insights December 2017 Gold, Oil, and Inflation in 2018
Summary
- Gold may remain flat for 2018 but remains an attractive tool to hedge against potential market volatility and geopolitical risks.
- Oil prices may weaken due to rising US production despite falling global inventories and elevated political risk premia.
- Inflation may persistently rise throughout 2018.
Macro Outlook
The world is currently experiencing synchronous growth supported by massive central bank stimulus. There are, however, indications that developed markets are likely close to their cycle highs, and a period of slower growth potentially lies ahead. While we think that the world economy will escape a significant upset in 2018, there remain formidable tail risks.
Navigating the stretched valuations in both equity and bond markets and the potential pitfalls of low volatility will be a critical objective for investors in 2018. The unwinding of monetary policy brings risks to both bonds and equities, likely renewing appetite for alternative assets classes such as commodities, real assets, and precious metals.
Earnings may face headwinds from tighter US monetary policy and wage growth. As the US jobs market continues to tighten in 2018, wage pressures may rise significantly and reinforce inflation momentum due to the need for businesses to increase prices.
The US central bank may continue to raise rates in 2018. That comes on top of the balance-sheet run-off that the Federal Reserve (Fed) has already announced. Although some market participants think that under a new Chair, the Fed will may become more dovish, we believe the central bank will remain data-dependent and trained staff economists’ analysis will become more influential in the Board’s decision-making. In light of strengthening domestic demand and a tight labor market, the inflationary potential will be hard to ignore.
Another potential consequence of tighter US policy is the negative impact on emerging market economic growth, and in particular China. Higher borrowing, input costs and currency volatility may weigh on emerging market growth.
Gold Outlook
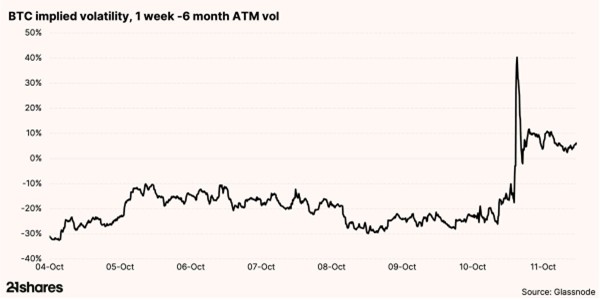
Our base case fair-value for gold is broadly flat over the coming year, as support from rising inflation will counter the downward pressure from rising interest rates. Despite policy interest rates rising in 2017, the US dollar has depreciated and treasury yields have declined. We expect these paradoxical trends to abate in 2018, and thus weigh on gold prices. However, we believe three rate hikes in 2018 will be required to keep inflation expectations anchored.
Exhibit 1: 2018 gold price outlook scenarios
Most of the variation of the gold price in our bull and bear cases (compared to our base case) comes from assumptions around speculative positioning. Many measures of market volatility are currently subdued. However, several risks – both political and financial – exist. Sentiment towards gold could shift quite widely depending on which of these views dominate market psyche.
Risks which may push demand for gold futures higher benefiting prices include continued sabre-rattling from North Korea; tensions between Saudi Arabia and Iran escalate; a disorderly unwind of credit in China; political populism and elections in Europe; and a spike in market volatility as yield-trades unwind.
Currently investor positioning is elevated due to investor fears around continued sabre-rattling between US/Japan and North Korea and some of the tensions in the Middle East. These concerns could fall away if new developments on these geopolitical issues do not resurface. We have observed that when such geopolitical issues simmer in the background, political risk-premia tends to dissipate from the price of gold. It requires keeping the issues at the forefront of market psyche for the premia to endure.
Oil Outlook
Many market commentators argued a year ago that OPEC’s strategy was to flip the oil futures curve from contango to backwardation. Contango, they argued, provided the incentive for US shale producers to keep pumping out oil despite depressed spot prices because prices for future delivery were higher and so they could store oil today and lock into higher prices at a future date. Contango therefore would see continuous increases in inventory. The futures curve is now in backwardation.
Inventories have been declining across the OECD (Organization for Economic Co-operation and Development). Most of the declines have come from floating storage (which is the most expensive form of storage).We are unlikely to see the decline in inventories continue however. At current prices, US production will likely expand substantially. US shale oil production can break-even at close to US$40/barrel (bbl). With WTI (West Texas Intermediate) oil currently trading at US$55/bbl, there is plenty of headroom for profitability and we expect a strong expansion in supply.
In 2018, US production may hit an all-time high, surpassing the cycle peak reached before the price war in 2014 and above the 10 million barrel mark last hit in 1970. There is little indication that the backwardation in futures curves is going to stop US production from expanding.
Exhibit 2: Oil supply and demand outlook
In October 2017, OPEC (Organization of the Petroleum Exporting Countries) and its 10 non-OPEC partners posted their best level of compliance with the production curb deal to date. However, looking at the detail, it is countries like Iraq who managed to step-up the most to improve compliance. Iraq’s compliance levels jumped from 22% in September to 85% in October, making a strong contribution to the rise in OPEC’s overall compliance (95% in September to 106% in October).
That is unlikely to be repeated given that the supply disruptions stemming from the Kurdish region’s vote for independence was the driver. We doubt the threat to cut off oil production from the Kurdish region is credible. Turkey, the main buyer of the oil has not followed through with threats to shut-down pipelines that take oil out of the region.
OPEC and its non-OPEC partners announced on November 30th, that they will extend the deal to cut supply from October 2016 by 1.8 million barrels to the end of 2018. We think that compliance in this extended deal will fall short of expectations. Russia’s insistence on discussing an exit strategy and having a review in June 2018 indicates that the patience of non-OPEC partners in the deal is wearing thin.With the US expanding supply and OPEC likely to under deliver on its promise to consistently curb production, we expect the supply to grow. At the same time, demand is unlikely to continue to grow at the current pace, with prices having gained 33% over the past year. Q4 2017 may be the last quarter of deficit for a while. Surpluses are going to contribute to higher OECD inventories.
The Crown Prince of Saudi Arabia, Mohammed bin Salman, in his drive to modernize the Saudi economy, has taken aim at corruption in the country. With many of the economic and political elite having been caught up in the investigation, there is a risk that the fragile consensus that held the Saudi state together for many decades could unravel. Saudi Arabia has accused Iran and Lebanon of committing acts of war. Saudi Arabia initiated a military intervention in Yemen in 2015 that has been seen as a ‘proxy war’ with Iran given Iran’s support for rebel Houthis that had toppled Yemen’s former government. Recent developments show that this proxy war is escalating.
The market perceives both the internal and external conflicts in Saudi Arabia as a source of disruption in oil production in the region. We believe that the geopolitical premium priced into oil is likely to be transient unless a war actually breaks out. The Saudi proxy war with Iran has been raging for over two years, with little reflection in the price of oil until recently. Unless investors are constantly reminded of the risks, the premia tends to evaporate within a matter of weeks.
Inflation Outlook
Inflation has been subdued in 2017, despite many signs of cyclical strength, but a large number of idiosyncratic factors account for this apparent weakness in price movements. Dominant wireless phone service providers changing pricing; solar eclipse changing the timing of hotel stays; severe hurricane disruptions; budget airlines opening new routes are some of the idiosyncratic factors that are unlikely to be repeated.
Additionally, the calculation of owner occupied equivalent rent has caused some distortions in the inflation numbers, as it is sensitive to energy prices. With volatility in energy prices having fallen, we expect these distortions to subside. The unemployment rate is at its lowest in 16 years and a healthy number of jobs are being added every month (notwithstanding hurricane disruptions). The strength in the labor market may show up in inflation as per its traditional relationship.We expect US inflation to rise to 2.4% in June 2018 and 2.6% by December 2018 (from 2.2% in September 2017). These levels will likely be uncomfortably high for the Fed, but given the lags in policy and price response, there is little the Fed can do next year to stop it (the inflationary pressure has been built up this year).
Important Risks
The statements and opinions expressed are those of the author and are as of the date of this report. All information is historical and not indicative of future results and subject to change. Reader should not assume that an investment in any securities and/or precious metals mentioned was or would be profitable in the future. This information is not a recommendation to buy or sell. Past performance does not guarantee future results. Risk premia is the difference between the expected return on a security or portfolio and the ”riskless rate of interest” (the certain return on a riskless security.
Diversification does not eliminate the risk of experiencing investment losses. All investing involves risk, including the loss of principal.
The Organisation for Economic Co-operation and Development (OECD) is an intergovernmental economic organisation with 35 member countries, founded in 1960 to stimulate economic progress and world trade. Organization of the Petroleum Exporting Countries (OPEC) is an intergovernmental organization of 14 nations as of May 2017, founded in 1960 in Baghdad by the first five members, and headquartered since 1965 in Vienna.
The Federal Reserve System, often referred to as the Federal Reserve or simply ”the Fed,” is the central bank of the United States. It was created by the Congress to provide the nation with a safer, more flexible, and more stable monetary and financial system. Backwardation is a theory developed in respect to the price of a futures contract and the contract’s time to expire; as the contract approaches expiration, the futures contract trades at a higher price compared to when the contract was further away from expiration. Contango is a situation where the futures price of a commodity is above the expected future spot price.
Maxwell Gold is a registered representative of ALPS Distributors, Inc.
ALPS Distributors, Inc.


 Nyheter4 veckor sedan
 Nyheter4 veckor sedan
 Nyheter4 veckor sedan
 Nyheter4 veckor sedan