
Nyheter
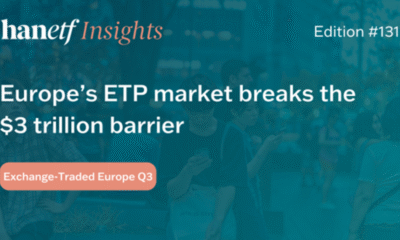
Global ETP sector records during September


Nyheter
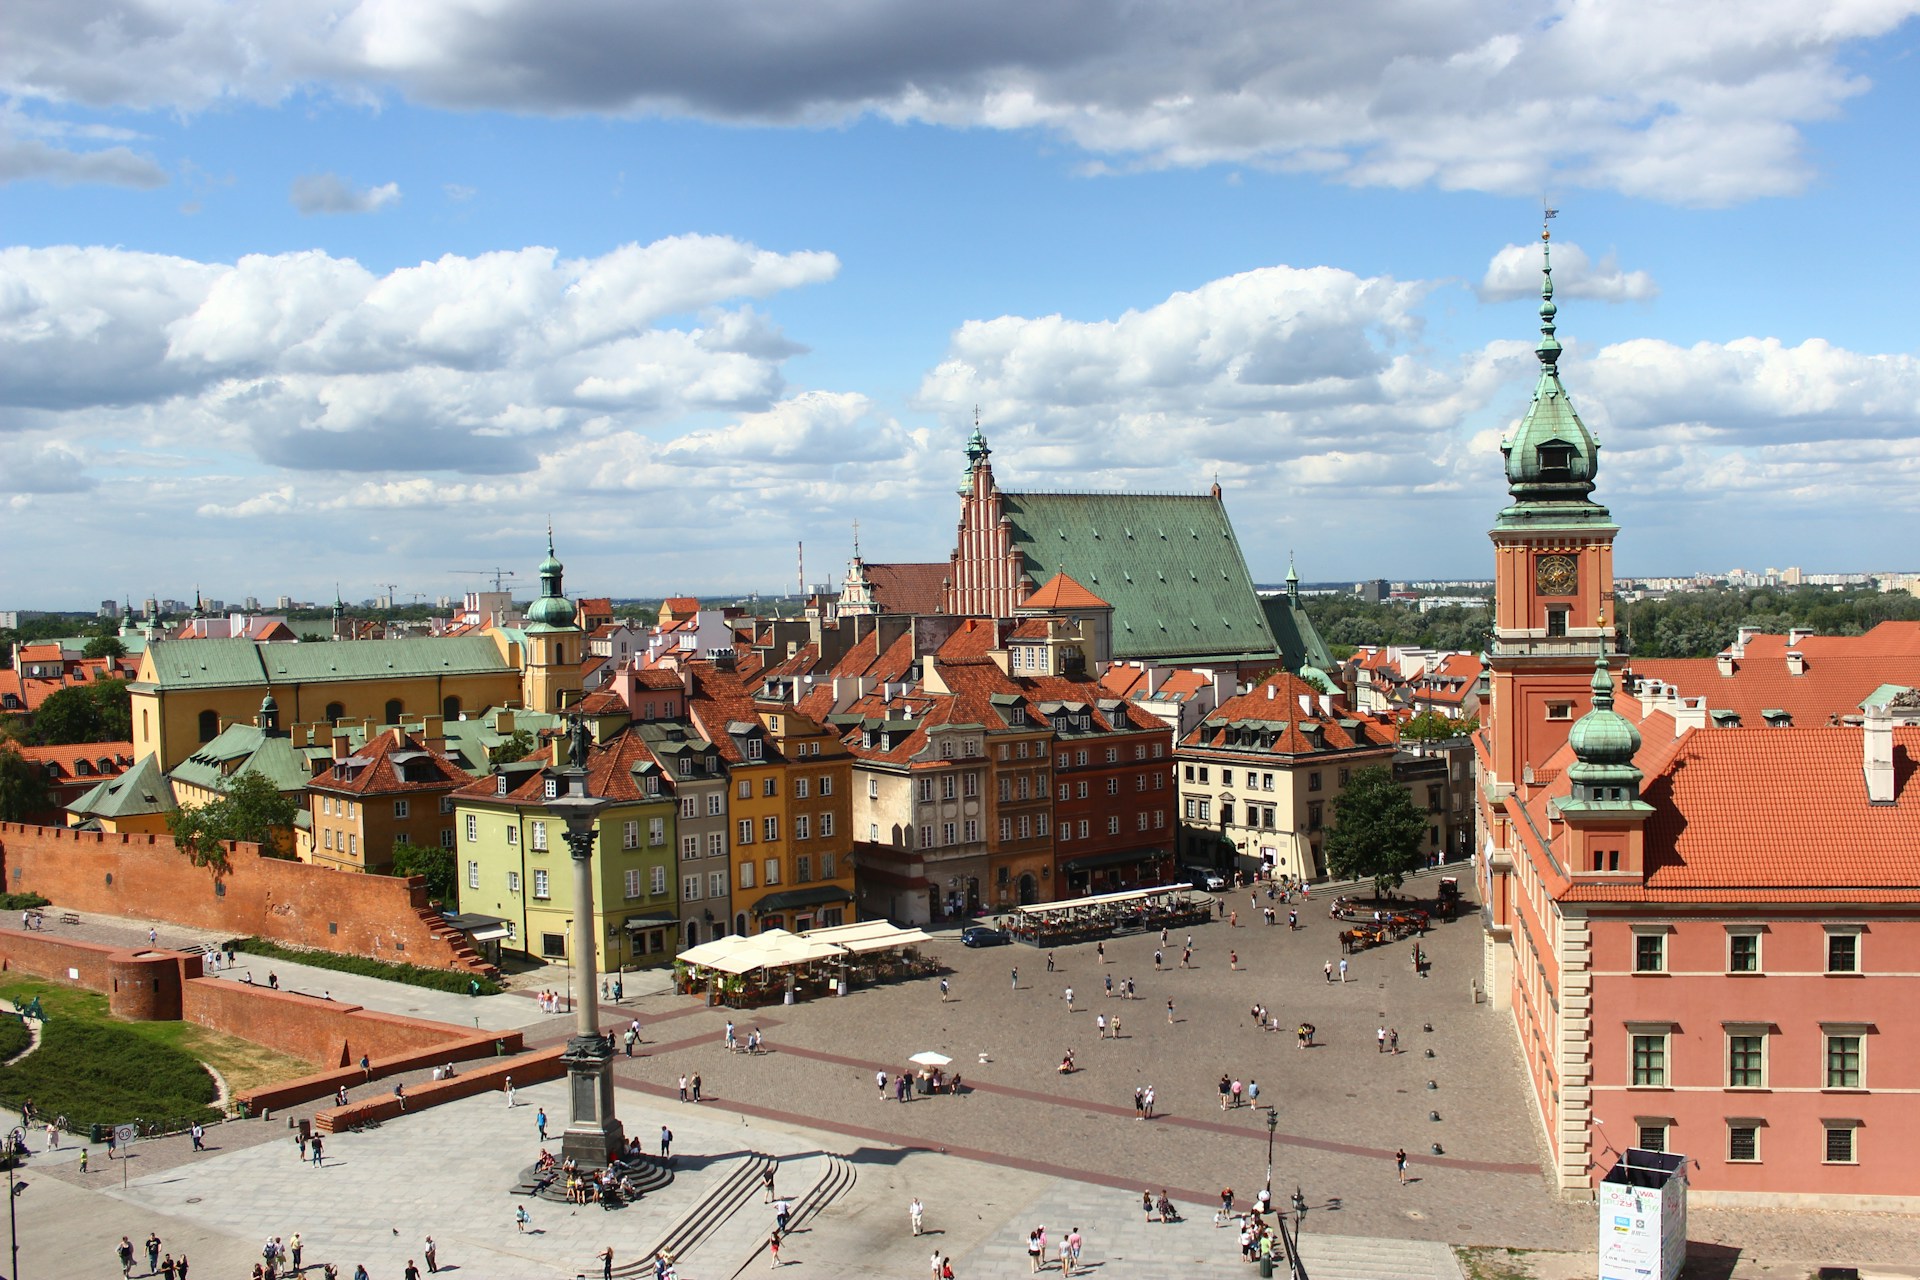
HANetf blir den största ETF-utgivaren på Warszawabörsen, med 8 nya UCITS ETF-noteringar och fler på gång


Nyheter18 timmar sedan
Defiance utökar sitt europeiska utbud med lanseringen av Europas första minnes-ETF

Nyheter19 timmar sedan
KBOT ETF investerar i humanoida robotar

Nyheter20 timmar sedan
HANetf blir den största ETF-utgivaren på Warszawabörsen, med 8 nya UCITS ETF-noteringar och fler på gång

Nyheter21 timmar sedan
ASWA ETF ger exponering mot kärnbränsle- och energiindustrin

Nyheter22 timmar sedan
Nya ETF- och ETP-noteringar den 19 juni 2026 på Deutsche Börse

Nyheter4 veckor sedan
USA satsar 2 miljarder dollar på kvantdatorer – så kan investerare dra nytta av utvecklingen

Nyheter3 veckor sedan
Extrema skillnader: Varför presterar Europas kvantdator-ETFer så olika?

Nyheter3 veckor sedan
QQCC ETF följer företag världen över som är aktiva inom kvantberäkning

Nyheter4 veckor sedan
Fastställd utdelning i MONTDIV maj 2026

Nyheter3 veckor sedan
Varför Plus500 är en dröm för finans-affiliate
-
 Nyheter4 veckor sedan
USA satsar 2 miljarder dollar på kvantdatorer – så kan investerare dra nytta av utvecklingen
-
 Nyheter3 veckor sedan
Extrema skillnader: Varför presterar Europas kvantdator-ETFer så olika?
-
 Nyheter3 veckor sedan
QQCC ETF följer företag världen över som är aktiva inom kvantberäkning
-
 Nyheter4 veckor sedan
Fastställd utdelning i MONTDIV maj 2026
-
 Nyheter3 veckor sedan
Varför Plus500 är en dröm för finans-affiliate
-

 Nyheter3 veckor sedan
ETFer för fotbolls-VM 2026
-

 Nyheter3 veckor sedan
21shares produkter nu finns tillgängliga hos Revolut
-

 Nyheter6 dagar sedan
Den osynliga flaskhalsen i AI-boomen: Varför elinfrastruktur är nästa stora megatrend