
Nyheter
Global Commodity ETP Quarterly Q3 2014
Global Commodity ETP Quarterly Q3 2014 The report includes:
- A comprehensive and fully up-to-date reference guide to investing in global commodity ETPs and indexes – no ETP type or geographic area is excluded. The report details the large and growing choice of commodity ETP exposures and strategies around the world.
- Summary analysis of global commodity ETP flows, trading volumes and AUM trends. Includes a detailed analysis of the main trends in Q3 2014 and the outlook for the rest of the year.
- Roll yield analysis (contango/backwardation) broken down by individual commodity and commodity sectors.
- Useful fundamental commodity data and information. An updated and revised inventory trends section, positioning data, futures curve developments, commodity index compositions and weights.
Throughout the Global Commodity ETP Quarterly, commodity ETPs have been grouped into six main sectors as detailed below:
- Diversified Broad contains Diversified Broad, Diversified Broad ex Agriculture and Livestock, Diversified Broad Light Energy and Diversified Broad ex Energy basket commodity ETPs
- Agriculture contains Diversified Agriculture basket, Cocoa, Coffee, Corn, Cotton, Grains, Rice, Softs, Soybeans, Soybean Meal, Soybean Oil, Sugar and Wheat commodity ETPs
- Energy contains Diversified Energy basket, Biofuels, Carbon, Coal, Crude Oil, Electricity, Gasoline, Heating Oil, Natural Gas and Petroleum commodity ETPs
- Industrial Metals contains Diversified Industrial Metals basket, Aluminium, Copper, Lead, Nickel, Tin, Uranium and Zinc commodity ETPs
- Livestock contains Diversified Livestock basket, Feeder Cattle, Lean Hogs and Live Cattle commodity ETPs
- Precious Metals contains Diversified Precious Metals basket, Gold, Palladium, Platinum, Rhodium and Silver commodity ETPs Exchange Traded Products (ETPs) is the umbrella term covering Exchange Traded Funds (ETFs), Exchange Traded Commodities (ETCs), Exchange Traded Notes (ETNs), US Limited Partnerships (LPs), US Guarantor and other statutory trusts. Commodity ETPs are open-ended securities listed on a stock exchange tracking an underlying commodity asset. They do not include ETPs tracking the listed equities of companies involved in commodity businesses.
If not otherwise stated, all data in the publication is in US dollars.
Commodity ETP Flows Resilient in the Face of Price Declines
Commodity ETPs were hit hard in Q3 2014 as a strong US dollar and concerns about China and Europé growth knocked many commodity prices down towards their production costs.
Following two consecutive quarters of increases, commodity ETP assets under management (AUM) fell by US$12.6bn to US$110.7bn, the lowest level since Q1 2010. However, close to 96% of the AUM decline was caused by price declines, with net investor outflows during the quarter a relatively resilient US$550mn.
The resilience of investor flows likely reflects a number of factors. The first is that most of the large, leveraged tactical players in commodity ETPs cleared their positions in 2013, as reflected in the large outflows that year. The bulk of investors in commodity ETPs today tend to be strategic investors with medium to long-term time horizons who tend to be less sensitive to short term price swings.
A second key factor is that with most commodities now trading near (and in some cases below) their estimated all-in or marginal costs of production, many investors with long-term investment horizons are looking at current prices as attractive accumulation levels on the view on-going production cuts and a steady structural rise in demand from increasingly wealthy large population developing countries will ultimately push prices higher.
Lastly, a large part of the commodity price declines over the past month or so has been driven by the strong rally in the US dollar and concerns about slower growth in China and Europe. US dollar strength is being driven by healthy US economic growth – a positive for commodity demand. Meanwhile, policy-makers in both China and Europe have started – and are expected to continue – to react strongly to recent signs of economic weakness.
Given the above potential positive price catalysts and the fact that many commodities are trading at their lowest levels relative to their production costs since the crisis of 2008, there are some signs tactical investors are beginning to nibble – particularly with valuations across a number of major equity and most fixed income markets looking stretched. Over the course of Q3, broad commodity index ETPs saw inflows as well as some of the more bombed out individual commodities and sectors such as agriculture, select industrial metals and natural gas.


Key Trends
Gold ETPs accounted for nearly 60% of the decline in global commodity ETP AUM, with AUM dropping by US$7.4bn to US$69bn. Of the AUM decline, 82% was due to the gold price decline over the quarter. While investors sold into the price decline, selling was far more muted than during the price declines of 2013, indicating most tactical investors have already exited.

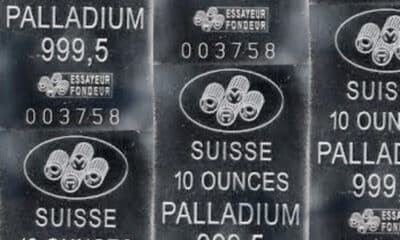
After gold, platinum and palladium saw the largest outflows in Q3, with US$194mn and US$74mn of outflows respectively. Silver ETPs saw the largest inflows in Q3, with US$452mn of net new investor flows despite (or perhaps because of) the sharp price decline. Many investors appear to view the silver price below US$20/oz as a good long-term accumulation level.

Agriculture ETPs also saw inflows during the quarter as low prices brought investors into most of the grains as well as cotton.

Broad commodity index tracking commodity ETPs saw inflows of US$561mn in Q3 2014, indicating strategic investors are starting to view commodities as a more attractive asset class as equity and bond market valuations have become more stretched and commodity prices have declined.

Oil ETPs saw strong inflows in August as prices lurched lower, however in September these flows reversed as it appears some investors capitulated in the face of continued price declines. For the quarter as a whole oil ETPs saw US$83mn of outflows. Meanwhile as the natural gas fell from its heights investors started to nibble, with US$21 of inflows

Industrial metal ETPs saw mixed flows, with the net result a very modest US$29mn of inflows into the sector. While copper ETPs saw US$29mn of outflows, aluminium, nickel and industrial metal basket ETPs all saw inflows.
Summary and Outlook
Assuming the US maintains its current economic trajectory, the key to commodity performance and flows through the rest of 2014 and into 2015 will be how successful both Europe and China are in restimulating their economies. Stronger economic growth in both of these major markets would not only help boost commodity demand and improve general sentiment, but also likely take some of the steam out of the very strong recent US dollar rally (which has been as much about weakness abroad as strength at home) that has been weighing on commodity performance. Increasingly aggressive easing moves by ECB President Mario Draghi and policy-makers in China in the coming months and quarters could be the stimulus commodity markets have been waiting for.
Important Information
This communication has been provided by ETF Securities (UK) Limited (”ETFS UK”) which is authorised and regulated by the United Kingdom Financial Conduct Authority. When being made within Italy, this communication is for the exclusive use of the ”qualified investors” and its circulation among the public is prohibited.


Nyheter
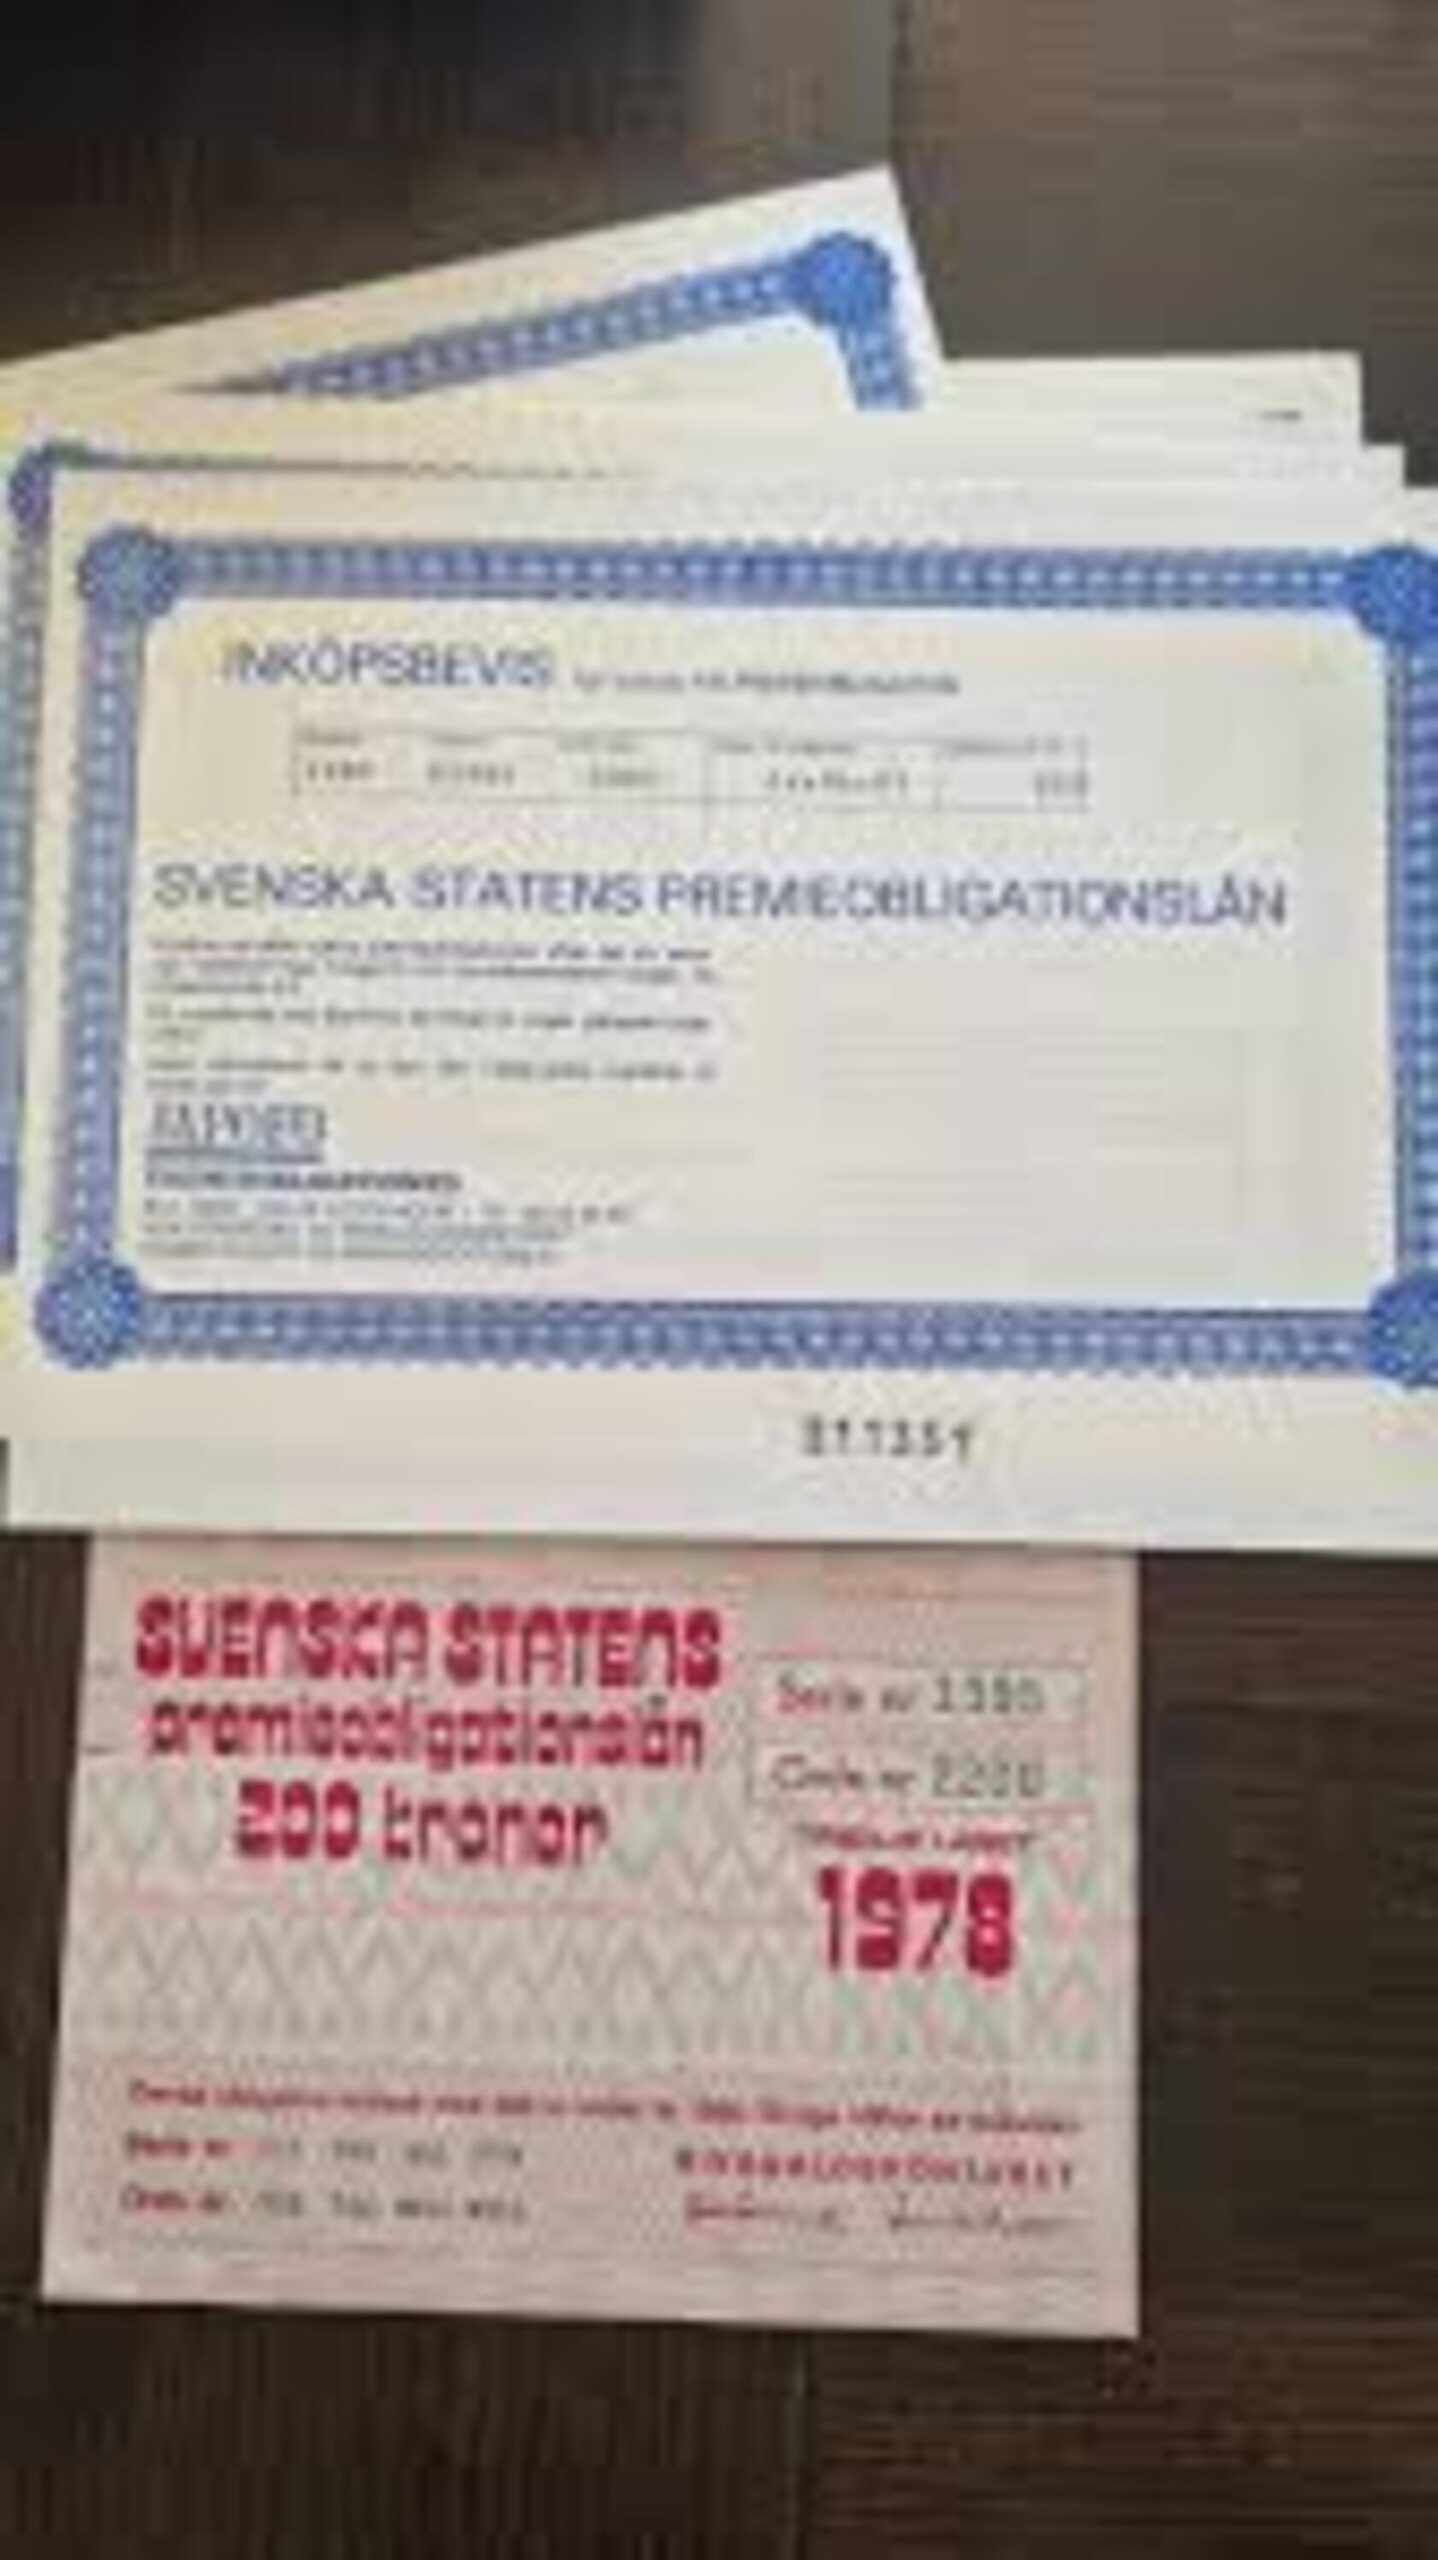
När staten bjöd på vinstchans: Historien om premieobligationen – och hur konceptet lever vidare globalt


HEQQ ETF mål är att ge långsiktig kapitaltillväxt

När staten bjöd på vinstchans: Historien om premieobligationen – och hur konceptet lever vidare globalt

OTUS ETF ger exponering mot en portfölj av globala aktier

Defiance utökar sitt europeiska utbud med lanseringen av Europas första minnes-ETF

KBOT ETF investerar i humanoida robotar

USA satsar 2 miljarder dollar på kvantdatorer – så kan investerare dra nytta av utvecklingen

Extrema skillnader: Varför presterar Europas kvantdator-ETFer så olika?

QQCC ETF följer företag världen över som är aktiva inom kvantberäkning

Fastställd utdelning i MONTDIV maj 2026

Varför Plus500 är en dröm för finans-affiliate
-
 Nyheter4 veckor sedan
USA satsar 2 miljarder dollar på kvantdatorer – så kan investerare dra nytta av utvecklingen
-
 Nyheter3 veckor sedan
Extrema skillnader: Varför presterar Europas kvantdator-ETFer så olika?
-
 Nyheter3 veckor sedan
QQCC ETF följer företag världen över som är aktiva inom kvantberäkning
-
 Nyheter4 veckor sedan
Fastställd utdelning i MONTDIV maj 2026
-
 Nyheter3 veckor sedan
Varför Plus500 är en dröm för finans-affiliate
-

 Nyheter3 veckor sedan
ETFer för fotbolls-VM 2026
-

 Nyheter3 veckor sedan
21shares produkter nu finns tillgängliga hos Revolut
-

 Nyheter6 dagar sedan
Den osynliga flaskhalsen i AI-boomen: Varför elinfrastruktur är nästa stora megatrend