
Nyheter
Genesis Capital struggles to raise the funds needed to stave off bankruptcy
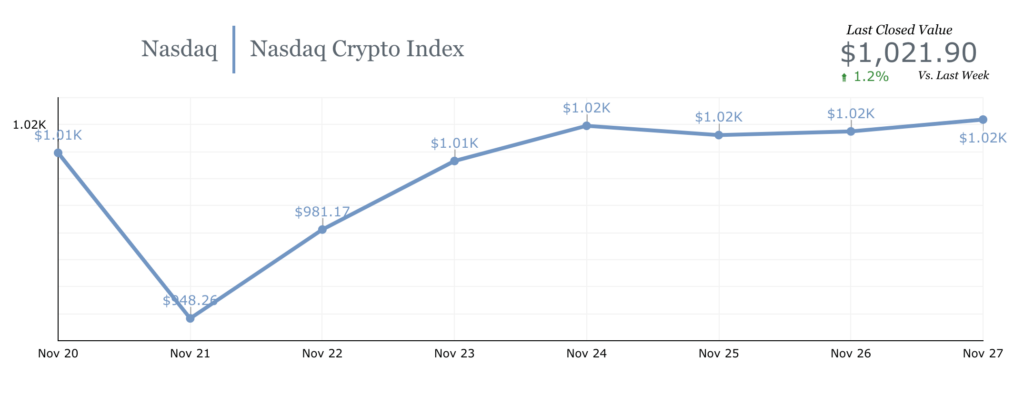
The Nasdaq Crypto Index (NCI) closed Sunday (11/27/22) 1.2% above last week’s closing. The index’s neutral performance was influenced by ether (ETH), up 2.8%, while bitcoin (BTC) remained stable.
Coming out of a week dominated by fears that Genesis Global Capital would be forced to declare bankruptcy, investors braced for more bad Genesis news and the possibility that other counterparties might become insolvent before the Thanksgiving holiday due to FTX’s collapse.
On Monday, BTC prices began to sink around midday on the East Coast after Bloomberg published an article claiming that Genesis Capital was “struggling” to raise the $1 billion it would need to remain solvent. Genesis Global reacted to the article by releasing a statement that clarified it had “no plans to file bankruptcy imminently.” As closing hours neared for stock markets in the US, BTC registered its weekly low of $15,665—its lowest price point in over two years.
Crypto assets registered a modest recovery on Monday evening, but fell again during early hours of Tuesday. ETH reached its weekly low of $1,082 shortly after the Wall Street Journal published an article confirming Bloomberg’s unidentified Genesis source. In the article, the WSJ claimed that Binance had refused to bail out the troubled crypto lender due to potential conflicts of interest. The article also cited that Genesis had approached private equity firm Apollo Global Management, but did not reveal the state of those negotiations.
Crypto markets began recovering as US markets opened on Tuesday and regained upward momentum in the afternoon when Cleveland Fed President Loretta Mester stated that it “makes sense that we can slow down a bit the … pace of (rate) increases.” Her comments echoed those made by other Fed officials, all of which suggested that the worst of the current rate hike cycle is in the rear view mirror. Before Tuesday gave way to Wednesday, all major US stock indexes closed in the green, BTC gained over $750 and ETH surged by $80.
On Wednesday, prices began losing steam as US stock markets opened. However, later that day, November’s Fed minutes were released. The FOMC’s meeting notes reaffirmed that “a substantial majority of (meeting) participants judged that a slowing in the pace of increase would likely soon be appropriate”.” News that the Fed had confirmed its more dovish outlook in writing would ensure that traditional markets closed in the green once again and that crypto markets would sustain an upward trajectory until late in the night, when BTC reached its weekly high of $16,753.
On Thursday, BTC prices would taper down, before recovering on Friday to settle just above $16,500. BTC prices would remain stable while moving sideways as trading volume slowly fell throughout the weekend. ETH’s price slowly rose throughout the entirety of Friday, eventually registering its weekly high of $1,221 in the day’s final hours and before stabilizing just below that threshold for the remainder of the weekend.
Looking ahead
Investors will continue to monitor the fallout of the FTX collapse, but some analysts believe an eventual Genesis Capital’s bankruptcy may have already been priced in. On Wednesday, the release of the eurozone Core Consumer Price Index (CPI) will be on the radar of investors concerned about global inflation. On Thursday, the release of the Personal Consumption Expenditure (PCE) index could confirm that inflation is waning in the US and reassure investors that the Fed will announce a 50 bps rate hike in mid December.
FTX hack continues to puzzle crypto analysts
During the last two weeks, investors have been monitoring developing stories related to mysterious hacks. After a week of disastrous news for FTX, the troubled exchange managed to give investors one final scare before turning in for the weekend by announcing it had been hacked. Initial reports suggested $600 million in tokens were drained from FTX wallets
The breach was originally divulged by an account administrator in an FTX Support Telegram chat. Later, FTX General Counsel Ryne Miller claimed in a tweet that the transactions resulted from “precautionary steps to move all digital assets to cold storage.” Others speculated that the funds were moved at the behest of Bahamian Financial authorities. Neither statements appear to be true.
During the following week, the hacker converted such a large volume of tokens into ETH, making the wallet in question the 35th largest amongst all ETH addresses on November 16th. Last week, the malicious actor spent the weekend converting millions of ETH to Ren bitcoin (renBTC), an ERC-20 token used to represent the value of BTC in other blockchains, possibly in an attempt to launder the funds. Analysts continue to monitor the hacker’s activities, and we’ll keep a close eye on the matter to make sure Hashdex investors stay up-to-date with the unfoldings.
The information contained herein (“Information”) may not be reproduced or redistributed in whole or in part, in any format, without the express written approval of Hashdex Asset Management Ltd. (“Hashdex”) and its affiliates and subsidiaries (“Hashdex Group”). By accepting this document, you acknowledge and agree that all of the Information contained in this document is proprietary to Hashdex Group. While not explicitly referenced within this piece, Hashdex Group manages the Hashdex Nasdaq Crypto Index ETF, Hashdex Nasdaq Ethereum ETF, Hashdex Nasdaq Bitcoin ETF, Hashdex DeFi Index Fund, Hashdex Smart Contract Platforms Index ETF and other investment vehicles focused on digital assets (collectively the “Fund” and each a “Fund”) which invests in digital tokens. The Information is not an offer to buy or sell, nor is it a solicitation of an offer to buy or sell, interests in the Funds or any advisory services or any other security or to participate in any advisory services or trading strategy. If any offer and sale of securities is made, it will be pursuant to the confidential offering memorandum of the Fund (the Offering Memorandum). Any decision to make an investment in the Fund should be made after reviewing such Offering Memorandum, conducting such investigations as the investor deems necessary and consulting the investor’s own investment, legal, accounting and tax advisors in order to make an independent determination of the suitability and consequences of an investment.
Each Fund seeks to track a relevant index. The performance of each Fund will vary from the performance of the relevant index that it seeks to track. The Information is being provided to you solely for discussion purposes and may not be used or relied on for any purpose (including, without limitation, as legal, tax or investment advice) without the express written approval of Hashdex Group. Certain statements reflect Hashdex Group’s views, estimates, opinions or predictions (which may be based on proprietary models and assumptions, including, in particular, Hashdex Group’s views on the current and future market for digital assets), and there is no guarantee that these views, estimates, opinions or predictions are currently accurate or that they will be ultimately realized. To the extent these assumptions or models are not correct or circumstances change, the actual performance of Hashdex Group and the Funds may vary substantially from, and be less than, the estimated performance. None of Hashdex Group, the Funds nor any of their respective affiliates, shareholders, partners, members, directors, officers, management, employees or representatives makes any representation or warranty, express or implied, as to the accuracy or completeness of any of the Information or any other information (whether communicated in written or oral form) transmitted or made available to you.
Each of the aforementioned parties expressly disclaims any and all liability relating to or resulting from the use of the Information or such other information. Except where otherwise indicated, the Information is based on matters as they exist as of the date of preparation and not as of any future date and will not be updated or otherwise revised to reflect information that subsequently becomes available, or circumstances existing or changes occurring after the date hereof. Investing in financial markets, the Funds and digital assets, including Bitcoin, DeFi tokens, and Ethereum, involves a substantial degree of risk. There can be no assurance that the investment objectives described herein will be achieved. Any investment in the Funds may result in a loss of the entire amount invested. Investment losses may occur, and investors could lose some or all of their investment. No guarantee or representation is made that Hashdex’s investment strategy, including, without limitation, its business and investment objectives, diversification strategies or risk monitoring goals, will be successful, and investment results may vary substantially over time. Nothing herein is intended to imply that the Hashdex Group’s investment methodology or that investing any of the protocols or tokens listed in the Information or the Funds may be considered “conservative,” “safe,” “risk free,” or “risk averse.” Neither historical returns nor economic, market or other performance is an indication of future results. Certain information contained herein (including financial information) has been obtained from published and non-published sources. Such information has not been independently verified by Hashdex Group, and Hashdex Group does not assume responsibility for the accuracy of such information. Hashdex Group does not provide tax, accounting or legal advice. Certain information contained herein constitutes forward-looking statements, which can be identified by the use of terms such as “may,” “will,” “should,” “expect,” “anticipate,” “project,” “estimate,” “intend,” “continue” or “believe” (or the negatives thereof) or other variations thereof. Due to various risks and uncertainties, including those discussed above, actual events or results, the ultimate business or activities of Hashdex Group or the Funds or the actual performance of Hashdex Group, the Funds, or digital tokens may differ materially from those reflected or contemplated in such forward-looking statements. As a result, investors should not rely on such forward- looking statements in making their investment decisions. None of the Information has been filed with the U.S. Securities and Exchange Commission, any securities administrator under any state securities laws or any other governmental or self-regulatory authority. No governmental authority has opined on the merits of the offering of any securities by the Funds or Hashdex, or the adequacy of the information contained herein.


MNTE ETF är en buffert-ETF som spårar amerikanska storbolag

Vilken typ av sektor ETFer finns det?

LVLD ETF investerar i ett urval av företag världen över med låg volatilitet

Den europeiska ETF-revolutionen: Skiftet som ritar om kartan för kapitalförvaltning
EEAK ETF investerar i eurodenominerade statsobligationer från eurozonen

USA satsar 2 miljarder dollar på kvantdatorer – så kan investerare dra nytta av utvecklingen

Extrema skillnader: Varför presterar Europas kvantdator-ETFer så olika?

QQCC ETF följer företag världen över som är aktiva inom kvantberäkning

Fastställd utdelning i MONTDIV maj 2026

Varför Plus500 är en dröm för finans-affiliate
-
 Nyheter4 veckor sedan
USA satsar 2 miljarder dollar på kvantdatorer – så kan investerare dra nytta av utvecklingen
-
 Nyheter3 veckor sedan
Extrema skillnader: Varför presterar Europas kvantdator-ETFer så olika?
-
 Nyheter3 veckor sedan
QQCC ETF följer företag världen över som är aktiva inom kvantberäkning
-
 Nyheter4 veckor sedan
Fastställd utdelning i MONTDIV maj 2026
-
 Nyheter3 veckor sedan
Varför Plus500 är en dröm för finans-affiliate
-

 Nyheter1 vecka sedan
Den osynliga flaskhalsen i AI-boomen: Varför elinfrastruktur är nästa stora megatrend
-

 Nyheter3 veckor sedan
ETFer för fotbolls-VM 2026
-

 Nyheter4 veckor sedan
21shares produkter nu finns tillgängliga hos Revolut