
Nyheter
Crypto Market Compass 1 July 2024

• Last week, cryptoassets rebounded from oversold levels amid bearish sentiment and lopsided positioning
• Our in-house “Cryptoasset Sentiment Indicator” has rebounded sharply from its lows and signals a positive sentiment again
• A factor that contributed to this reversal in prices was the fact that crypto markets increasingly traded on US presential election odds as pro-crypto candidate Trump seems to have fared better than Biden during the latest public debate
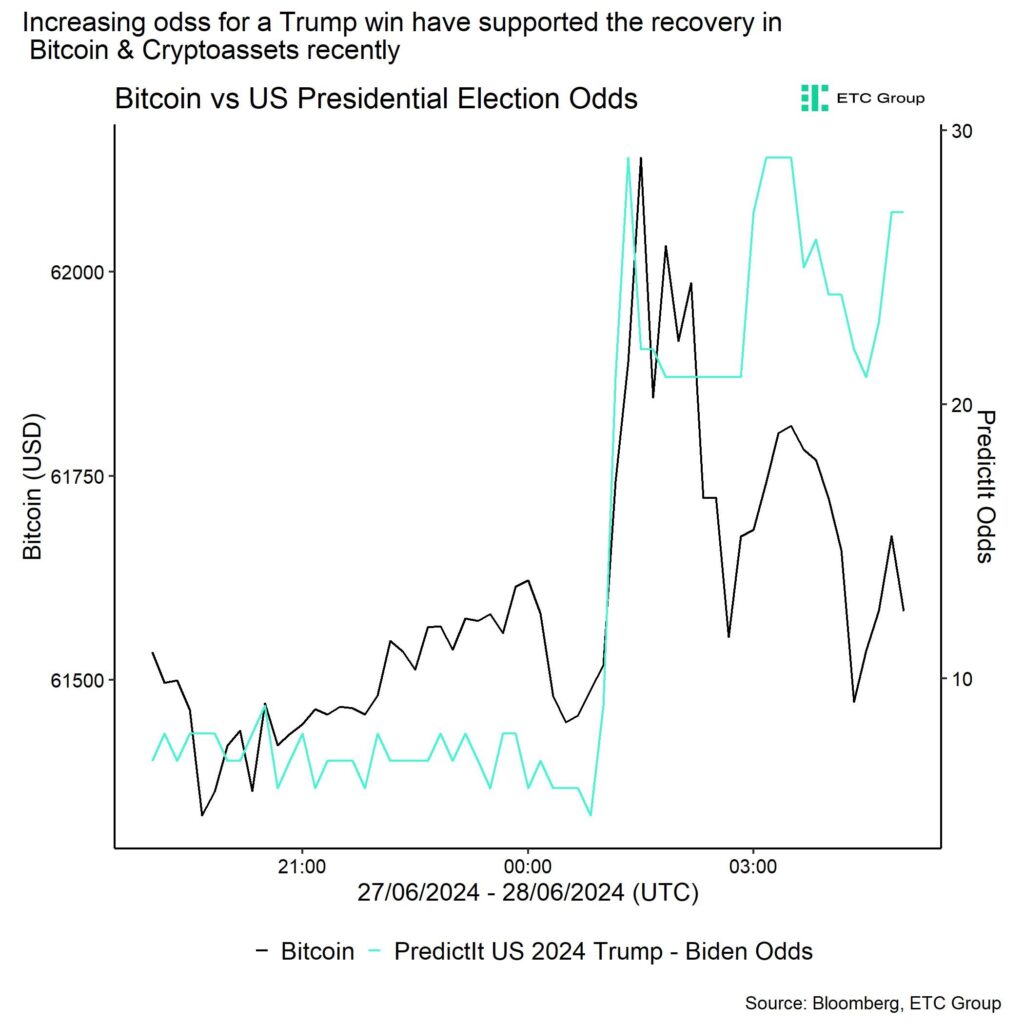
Chart of the Week
Performance
Last week, cryptoassets rebounded from oversold levels amid bearish sentiment and lopsided positioning. Many indicators had indicated that downside risks are relatively limited and that the short-term risk/reward had shifted to the upside as described here.
One of the factors that contributed to this reversal in prices was the fact that crypto markets increasingly traded on US presidential election odds, as pro-crypto candidate Trump seems to have fared better than Biden during the latest public debate (Chart-of-the-Week).
Trump has made many positive statements towards cryptoassets over the past few weeks, including an endorsement for domestic Bitcoin mining in the US.
Major players in the industry have recently joined forces behind Trump’s campaign with major donations from both the Winklevoss twins who operate the crypto exchange Gemini as well as Kraken’s founder Jesse Powell.
Apart from these political developments in the US, the industry is watching a potential spot Ethereum ETF trading launch in the US that was anticipated to take place as early as this week.
Bloomberg analysts had previously expected US spot Ethereum ETFs to debut in early July already but recent actions by the SEC suggest that a trading launch could come later than this week, possibly next week or by the end of summer.
Despite the expectation that net flows into Ethereum ETFs won’t be as big as the initial Bitcoin ETF flows, we still expect these flows to have a comparatively large price impact on Ethereum as outlined here.
Besides, several issuers have filed for a Solana ETF in the US which pays into the topic that regulatory sentiment towards cryptoassets continues to shift towards a pro-crypto stance. It also signals that Solana is cementing its ranking as the 3rd most important cryptoasset next to Ethereum and Bitcoin.
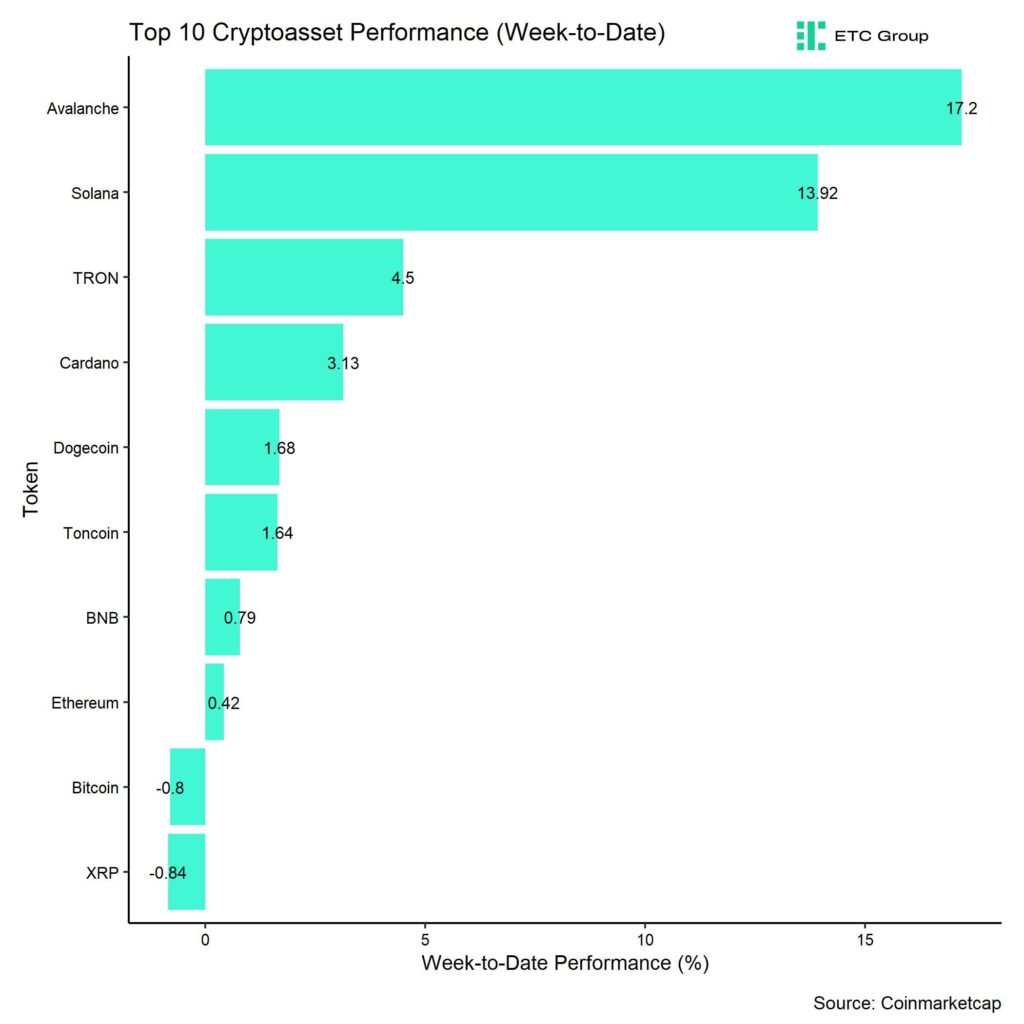
In general, among the top 10 crypto assets, Avalanche, Solana, and TRON were the relative outperformers.
Overall, altcoin outperformance vis-à-vis Bitcoin has significantly increased compared to the prior week, with 95% of our tracked altcoins managing to outperform Bitcoin on a weekly basis. This is potentially signalling a significant come-back in risk appetite as well.
Sentiment
Our in-house “Cryptoasset Sentiment Index” has rebounded sharply from its lows and signals a positive sentiment again.
At the moment, 7 out of 15 indicators are above their short-term trend.
Last week, there were significant reversals to the upside in BTC long futures liquidation dominance and the altseason index.
The Crypto Fear & Greed Index has also rebounded from “Fear” levels at the beginning of last week and now signals ”Neutral” sentiment as of this morning.
Performance dispersion among cryptoassets continued to increase sharply. This means that altcoins are increasingly becoming uncorrelated with the performance of Bitcoin.
Altcoin outperformance vis-à-vis Bitcoin has significantly increased compared to the week prior, with around 95% of our tracked altcoins outperforming Bitcoin on a weekly basis, which is consistent with the fact that Ethereum also outperformed Bitcoin last week.
In general, increasing (decreasing) altcoin outperformance tends to be a sign of increasing (decreasing) risk appetite within cryptoasset markets and the latest altcoin underperformance could signal declining appetite for risk at the moment.
Sentiment in traditional financial markets rebounded from its multi-year lows along with a rebound in market-based global growth expectations, judging by our own measure of Cross Asset Risk Appetite (CARA).
Fund Flows
Despite the weak price action, fund flows into global crypto ETPs continued to be positive last week. Global crypto ETPs saw around +38.2 mn USD in net inflows across all types of cryptoassets.
Global Bitcoin ETPs saw net inflows of +50.9 mn USD last week, despite -37.1 mn USD in net outflows from US spot Bitcoin ETFs. However, most vehicles saw a resumption in inflows towards the end of the week. An interesting observation is the fact that the 2x Bitcoin Strategy ETF (BITX) saw the 2nd highest net inflow among all Bitcoin ETPs worldwide with +70.1 mn USD which signals a significant return in risk appetite.
Meanwhile, outflows from Hong Kong Bitcoin ETFs accelerated with -204.3 mn USD.
Outflows from the ETC Group Physical Bitcoin ETP (BTCE) decelerated slightly last week with net outflows equivalent to -19.3 mn USD while the ETC Group Core Bitcoin ETP (BTC1) saw sticky AuM last week.
The Grayscale Bitcoin Trust (GBTC) continued to see net outflows, with around -159.0 mn USD in net outflows last week.
Meanwhile, net outflows from global Ethereum ETPs decelerated last week compared to the week prior but stayed negative with net outflows totalling -40.1 mn USD. Interestingly, Hong Kong Ethereum ETFs neither recorded in- nor outflows last week (+/- 0 mn USD).
In line with market developments, the ETC Group Physical Ethereum ETP (ZETH) saw net outflows totalling -10.7 mn USD and the ETC Group Ethereum Staking ETP (ET32) also saw net outflows last week (-16.1 mn USD). In contrast, altcoin ETPs ex Ethereum continued to attract capital of around +10.7 mn USD last week.
The same is true for Thematic & basket crypto ETPs which also continued to see positive net inflows of +16.6 mn USD, based on our calculations. The ETC Group MSCI Digital Assets Select 20 ETP (DA20) saw neither in- nor outflows last week.
Meanwhile, global crypto hedge funds have started to increase their market exposure again. The 20-days rolling beta of global crypto hedge funds’ performance increased from a low of 0.47 on the 24/06 to around 0.57 per yesterday’s close.
On-Chain Data
Bitcoin on-chain data also implied some type of capitulation last week which made a short-term stabilization more likely.
For instance, the Bitcoin short-term holder spent output profit ratio (STH-SOPR) declined to 0.96 on Monday last week meaning that spent coins that were previously held less than 155 days were spent at an average -4% loss.
In fact, realized losses by short-term holders spiked to 345 mn USD – the highest since 1st of May – when bitcoin also touched ~58k USD.
In other words, short-term holders literally capitulated and exited the market with significant losses. In this context, it is important to note that most of these losses were realized by larger investors, especially those that control more than 100 BTC.
Approximately 75% of realized losses came from this larger investor cohort.
In addition, we have seen increasing profit-taking by longer term investors as well, which appears to be related to the recent bitcoin liquidations by both US and German entities.
Based on information provided by Arkham Intelligence, as of this writing, the German government still holds 46k BTC and has only traded out -4k BTC since it began issuing coins on June 19, 2024.
However, the German government seems to be very aware of the impact it has on prices and is currently distributing coins in an orderly manner through a number of exchanges and market makers, including Coinbase, Kraken, Bitstamp, and Flow Traders. As a result, we shouldn’t anticipate significant drawdowns from this specific distribution.
The Mt Gox trustee has not been distributing bitcoins over the last few weeks,
despite certain false market speculations. According to data provided by Arkham, the trustee now holds about 142k BTC spread over several wallets.
But more recently, the US government began to distribute coins, which also had an impact on market pricing. The US government sold approximately 3940 Bitcoin in June, bringing its total holdings to 214k Bitcoin. With authority over 1.01% of the overall supply of Bitcoin, the US government remains the largest government holder in the world. It is followed by the Chinese government, which has 190k Bitcoin (~0.90% of the total supply).
Over the next few weeks, the market may continue to see selling pressure from US and German government agencies which could exert some downward pressure on prices.
We have also seen negative net outflows from global crypto ETPs in general and US spot Bitcoin ETFs in particular as described above which also contributed to selling pressure on exchanges.
All in all, these forces have led to around -751 mn USD in net selling volumes on Bitcoin spot exchanges over the past 7 days.
This was exacerbated by the fact that whales (entities that control more than 1,000 BTC) sent the most bitcoins to exchanges year-to-date. Approximately 22.7k BTC net were transferred to exchanges by whales last week.
The good news is that negative selling volumes on exchanges have gradually subsided since the low on the 24th of June which implies some level of “seller’s exhaustion”.
A short-term risk remains the continued distribution by BTC miners amid ongoing “miner capitulation”. However, we are already observing that BTC miners have decreased their selling volumes more recently compared to the level of selling in mid-June. Over the past 30 days, BTC miners have sold around 105% of mined supply which is around 13.7k BTC.
Futures, Options & Perpetuals
Last week, BTC futures open interest declined amid increased long liquidations. The decline in BTC futures open interest was particularly pronounced on CME where open interest declined by around -23k BTC. In contrast, BTC perpetual futures traders managed to increase their exposure by around +10k BTC.
Perpetual funding rates turned negative at the beginning of last week which tends to be a sign of a local bottom as it incentivizes longs vis-à-vis shorts. When the funding rate is negative, short positions periodically pay long positions. The 3-months annualized BTC futures basis rate also rebounded from its lows to around 11.6% p.a.
BTC options signalled a significant increase in risk aversion last week. For instance, the 25-delta 1-month option skew increased to the highest since mid-May as traded put-call volume ratios increased to the highest since end of May amid the latest market rout.
BTC option implied volatilities also increased during the sell-off early last week but continued their downward trend thereafter. Implied volatilities of 1-month ATM Bitcoin options are currently at around 43.3% p.a.
Meanwhile, Bitcoin options’ open interest decreased significantly amid the quarterly expiration of options.
Bottom Line
• Last week, cryptoassets rebounded from oversold levels amid bearish sentiment and lopsided positioning
• Our in-house “Cryptoasset Sentiment Indicator” has rebounded sharply from its lows and signals a positive sentiment again
• A factor that contributed to this reversal in prices was the fact that crypto markets increasingly traded on US presential election odds as pro-crypto candidate Trump seems to have fared better than Biden during the latest public debate
To read our Crypto Market Compass in full, please click the button below:

This is not investment advice. Capital at risk. Read the full disclaimer
© ETC Group 2019-2024 | All rights reserved


Robeco listar nya ETFer på Xetra och Börse Frankfurt
LEI-kod för kapitalförsäkringar

CEB2 ETF ger följer priset på japanska statsobligationer
From Bitcoin’s Strength to Altcoin Potential: A Market Analysis

3DEF ETN tre gånger utvecklingen på försvarssektorn

Bitcoin var den bäst presterande tillgången men…

Världens första europeiska försvars-ETF från ett europeiskt ETF-företag lanseras på Xetra och Euronext Paris

Fastställd utdelning i MONTDIV april 2025

21Shares bildar exklusivt partnerskap med House of Doge för att lansera Dogecoin ETP i Europa

HANetfs Tom Bailey om framtiden för europeiska försvarsfonder
-
 Nyheter4 dagar sedan
Bitcoin var den bäst presterande tillgången men…
-
 Nyheter4 veckor sedan
Världens första europeiska försvars-ETF från ett europeiskt ETF-företag lanseras på Xetra och Euronext Paris
-
 Nyheter2 veckor sedan
Fastställd utdelning i MONTDIV april 2025
-
 Nyheter4 veckor sedan
21Shares bildar exklusivt partnerskap med House of Doge för att lansera Dogecoin ETP i Europa
-
 Nyheter3 veckor sedan
HANetfs Tom Bailey om framtiden för europeiska försvarsfonder
-

 Nyheter4 veckor sedan
Investera i Polen med börshandlade fonder
-

 Nyheter2 veckor sedan
Europafokuserade ETPer ser större andel av flödena under första kvartalet
-

 Nyheter1 vecka sedan
Investerarna söker fonder som ger exponering mot försvarsindustrin