Är detta den enda säkra ekonomin som finns kvar? Medan de flesta andra ekonomierna låter sina tryckpressar gå in absurdum för att producera ny pappersvaluta som sänker värdet på deras egen valuta finns det ett land som befinner sig i förarsätet och har en stark, stabil ekonomi, en växande exportmarknad och en rad starka och stabila företag.
Det finns en värld av möjligheter där ute, men det finns också allvarliga risker. Den amerikanska aktiemarknaden formligen exploderar när den når nya toppnoteringar, men USAs ekonomi befinner sig fortfarande under isen och det federala budgetunderskottet befinner sig fortfarande på förbluffande höga nivåer.
I Japan försöker regeringen överträffa den amerikanska politiken, och landets budgetunderskott är dubbelt så stort som i USA, precis som den monetära ”stimulansen”.
Storbritannien, precis som resten av EU är inlåst i en recession och det är definitivt bevisat att det inte fungerar med olika typer av åtstramningar heller. Dessa åtstramningar håller nu på att överges i takt med att penningpolitiken blir slappare och slappare och räntorna nu ligger långt under inflationen.
Har BRICs gått på pumpen?
Nej, det är ingen av de så kallade BRICs-länderna Brasilien, Ryssland, Indien eller Kina, som vi hört så mycket om och som alla har så pass höga förhoppningar om.
Ryssland har oljan, men landet har också ett politiskt system som kan beskrivas som kleptokratiskt, en inflation som ligger på 7 procent och stiger.
Kina har, i alla fall tror vi det, fortfarande den tillväxt som behövs, men landet har dessutom ett politiskt system som ingen vill leva under, ett berg av osäkra fordringar vilka gör att landets egentliga budgetunderskott är betydligt större än det som redovisas officiellt.
Indien som spås vara nästa land som kommer att dra världens ekonomi framåt har ett gigantisk budgetunderskott som växer värre än de ogräs varenda villaägare försöker undvika i sommar.
Brasilien är på många sätt det land som är värst av dessa fyra, tillväxten har mattats av och budgetunderskottet är långt högre än vad som redovisas officiellt då en stor del av all finansiering gömts i de statliga bankerna.
Den stora vinnaren är inte ett av de små länderna
Döm då vår glädje då vi ser att det finns ett land som rapporterar ett budgetöverskott, med räntor som överstiger inflationen samtidigt som det finns en minst sagt hygglig tillväxt i ekonomin som genererar ett handelsöverskott.
Det finns ett antal mindre länder med en stark eller i alla fall en anständig tillväxt, men det finns också ett rikt land med en stark aktiemarknad. Landet i fråga befinner sig i ett epicentrum för världens dynamiska tillväxt och landet har en balansräkning som måste betraktas som fantastisk i en tid när vi vant oss vid att global kris.
Landet i fråga är Sydkorea
Är detta den enda säkra ekonomin som finns kvar. Utöver en stark ekonomi så valde landet nyligen en ny borglig president, Park Geun-Hye, som skall vara i tjänst till i första hand 2017. Park Geun-Hye har en stabil majoritet i den sydkoreanska kongressen.
Viktigare av allt är att Sydkoreaoch landets ekonomi inte drivs framåt av konstgjord stimulans, landet har ett betydande budgetöverskott. Den korta räntan ligger på 2,75 procent, inflationen på låga 1,3 procent samtidigt som landets bytesbalans redovisar ett överskott på 4,5 procent av BNP. Det förväntas växa med 2,9 procent i år och med 3,8 procent under 2014. Dessa tillväxtsiffror låter kanske inte så pass imponerande, men det gör Sydkorea till världens snabbast växande land, i alla fall i den utvecklade världen.
Ger världen vad den vill ha
Sydkorea är en av världens tekniskt ledande nationer, särskilt inom så kallade displaysystem, vad sägs till exempel om bärbara datorer som kan rullas ihop som en tidning? Utöver detta har landet goda kunskaper om stamceller och andra biotekniska innovationer. Vad gäller genteknik kan landets tekniska försprång komma att bli en strategisk fördel då Sydkoreas lagstiftning inte sätter begränsningar för utvecklingen av biotechinnovationer som många länder i västvärlden gör.
Dessutom håller landet på att utvecklas till en kulturell ledare, bland annat efter det att musikfenomenet Gangnam Style sveper över världen som en epidemi. Detta ger visserligen – relativt sett mycket annat – inga stora omedelbara intäkter till Sydkorea, men det gör att landet kan locka till sig många av världens unga, stilmedvetna och rotlösa innovatörer, något som aldrig var möjligt för 20 år sedan.
Landets aktiemarknad värderas till ett genomsnittligt p/e tal på 16, att jämföras med 17 för den amerikanska aktiemarknaden och 13,8 på Stockholmsbörsen. Båda dessa länders ekonomier växer långsammare än den sydkoreanska. Sydkorea har emellertid inte använt sig av tryckpressar för att skapa tillväxt vilket gör att det är osannolikt att vi kommer få se omedelbara problem.
Det stora hotet är emellertid Nordkorea, och det måste betraktas som ett betydande sådant.
Tre sätt att gå lång i Sydkorea
Det finns ett antal olika sätt att köpa in sig i den sydkoreanska aktiemarknaden. Den största Korea-fokuserad ETF noterad i USA är iShares MSCI Sydkorea Index ETF (NYSE: EWY). Med nettotillgångar på $ 3,2 miljarder kronor och ett kostnadsförhållande på endast 0,61% det är ett effektivt sätt att få exponering mot marknaden som helhet. För närvarande har denna ETF ett p/e-tal på endast 10 gånger vinsten, men ett en direktavkastning på endast 0,6%.
Sydkoreanska banker är mycket rimligt värderad i nettotillgångarna, men är för närvarande mycket lönsamma. Den största finanskoncern är Woori Finance Holdings (NYSE: WF), moderbolaget till Woori Bank. Detta företag handlas i dag till 48 procent av det bokförda värdet och till ett p/e ta på 5,7. Baserat på föregående års utdelning har Woori Finance Holdings en direktavkastning på 2,2 procent.
Appe förlorar ständigt marknadsandelar när det gäller mobiltelefoner och surfplattor till Sydkoreanska Samsung. Samsung är litet svårare att handla, men det finns globala depåbevis i London där de handlas under tickerkoden SMSN. I dag värderas Samsung till ett p/e tal på 7,6 på innevarande år och 1,7 gånger det bokförda värdet. Det känns inte dyrt med den tillväxten.
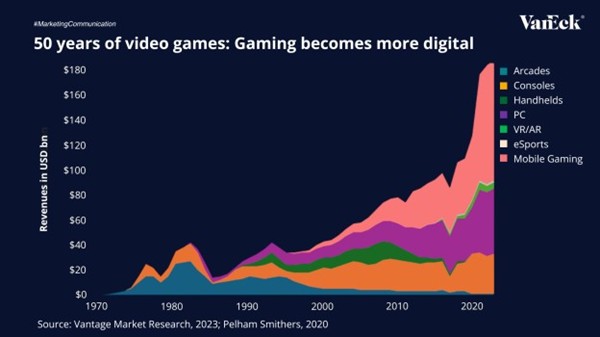
As April winds down, markets remain on edge, with escalating tariffs and renewed trade tensions keeping volatility in focus. In this summary of our full-length newsletter, we spotlight gold and gold equities, both of which have surged to record levels. We also take a step back from the day-to-day noise in crypto to explore the broader shifts in the regulatory landscape in our latest Whitepaper and present Celestia in detail. Finally, we assess how Moat indexes have held up and evolved amid the turbulence.
Gold & Gold mining equities tend to shine during stress periods
Source: VanEck, World Gold Council.
Gold has attracted renewed interest from investors amid concerns about inflation, currency volatility, and overall market uncertainty. Gold mining companies have recently reported improved profit margins and cash generation, with some initiating share buybacks and maintaining relatively strong balance sheets. Despite these developments, many continue to trade below their historical valuation averages.
While historical trends indicate that gold and gold mining equities have outperformed during certain periods of market stress, these patterns may not repeat under different economic conditions. Performance can be influenced by a range of factors including interest rates, central bank policy, geopolitical developments, and investor sentiment.
⚖️ Whitepaper Highlights: How New Crypto Regulations May Shape the Future
Cryptocurrencies are entering a new era. With the re-election of Donald Trump and the implementation of the European Union’s Markets in Crypto-Assets (MiCA) regulation, digital assets are moving into a landscape defined not just by innovation, but also by regulatory clarity.
MiCA’s structured and transparent approach aims to promote legitimacy, safeguard investors, and enhance trust in digital asset markets across Europe. It could also serve as a blueprint for other jurisdictions looking to regulate crypto effectively.
Most blockchains, like Ethereum or Bitcoin, are monolithic which means they perform all major functions (consensus, data availability, and execution) on a single layer. This design ensures security but according to new modular networks, limits scalability and flexibility.
The modular blockchain thesis, which Celestia is leading, proposes separation of layers and respective responsibilities in the network.
Note: This article in not accessible to our UK readers.
🌊 Riding the Gold Wave
Chasing the Vein: Fund Flows into Gold Miners
Source: Mining.com. Data as of 21 March 2025. Note: Data covers 493 funds with combined assets under management of $62 billion.
U.S. equity markets experienced significant declines during the month of March. Meanwhile, spot gold price recorded new all-time highs, surpassing the $3,000 per ounce mark on 14 March and closing at a record price of $3123.57 on March 31, a 9.30% ($265.73) monthly gain. As of 31 March, gold prices have risen by 93.61% over the past five years (1). Investors should keep in mind that past performance is not representative of future results.
The gold miners, as represented by the NYSE Arca Gold Miners Index (GDMNTR), outperformed significantly, up 15.51% during March (2). This gain reflects both their operational leverage to rising gold prices and market perceptions of relative value. However, gold miners can also be subject to heightened volatility, operational risks, and sensitivity to commodity price swings.
While gold and gold equities may serve as diversifiers in a portfolio due to their historically low correlations with many asset classes, investors should remain mindful of the inherent risks, including price volatility, currency movements, and shifts in investor sentiment that can lead to rapid reversals in performance.
Market turbulence in March weighed on stocks. The Moat Index was not immune to the market turmoil, as it declined along with the broad U.S. equity market ending the month lower. However, the Moat Index showed resilience relative to the S&P 500—thanks in part to defensive sector resilience and underweight exposure to mega-caps.
At the same time, the SMID Moat Index lagged small and mid-caps in March. Smaller U.S. stocks were also impacted by global trade tensions and economic growth concerns with the broad small- and mid-cap benchmarks falling during the month. However, year-to-date, the SMID Moat Index remains ahead of the broader small- and mid-cap markets.
(1) Source: World Gold Council, ICE Data Services, FactSet Research Systems Inc.
(2) Source: Financial Times.
IMPORTANT INFORMATION
This is marketing communication. Please refer to the prospectus of the UCITS and to the KID/KIID before making any final investment decisions. These documents are available in English and the KIDs/KIIDs in local languages and can be obtained free of charge at www.vaneck.com, from VanEck Asset Management B.V. (the “Management Company”) or, where applicable, from the relevant appointed facility agent for your country.
For investors in Switzerland: VanEck Switzerland AG, with registered office in Genferstrasse 21, 8002 Zurich, Switzerland, has been appointed as distributor of VanEck´s products in Switzerland by the Management Company. A copy of the latest prospectus, the Articles, the Key Information Document, the annual report and semi-annual report can be found on our website www.vaneck.com or can be obtained free of charge from the representative in Switzerland: Zeidler Regulatory Services (Switzerland) AG, Neudtadtgasse 1a, 8400 Winterthur, Switzerland. Swiss paying agent: Helvetische Bank AG, Seefeldstrasse 215, CH-8008 Zürich.
For investors in the UK: This is a marketing communication targeted to FCA regulated financial intermediaries. Retail clients should not rely on any of the information provided and should seek assistance from a financial intermediary for all investment guidance and advice. VanEck Securities UK Limited (FRN: 1002854) is an Appointed Representative of Sturgeon Ventures LLP (FRN: 452811), which is authorised and regulated by the Financial Conduct Authority (FCA) in the UK, to distribute VanEck´s products to FCA regulated firms such as financial intermediaries and Wealth Managers.
This information originates from VanEck (Europe) GmbH, which is authorized as an EEA investment firm under MiFID under the Markets in Financial Instruments Directive (“MiFiD). VanEck (Europe) GmbH has its registered address at Kreuznacher Str. 30, 60486 Frankfurt, Germany, and has been appointed as distributor of VanEck products in Europe by the Management Company. The Management Company is incorporated under Dutch law and registered with the Dutch Authority for the Financial Markets (AFM).
This material is only intended for general and preliminary information and shall not be construed as investment, legal or tax advice. VanEck (Europe) GmbH and its associated and affiliated companies (together “VanEck”) assume no liability with regards to any investment, divestment or retention decision on the basis of this information. The views and opinions expressed are those of the author(s) but not necessarily those of VanEck. Opinions are current as of the publication date and are subject to change with market conditions. Information provided by third party sources is believed to be reliable and have not been independently verified for accuracy or completeness and cannot be guaranteed.
Morningstar® Wide Moat Focus IndexSM, Morningstar® US Sustainability Moat Focus Index, Morningstar® US Small-Mid Cap Moat Focus IndexSM, and Morningstar® Global Wide Moat Focus IndexSM are trademarks or service marks of Morningstar, Inc. and have been licensed for use for certain purposes by VanEck. VanEck’s ETFs are not sponsored, endorsed, sold or promoted by Morningstar, and Morningstar makes no representation regarding the advisability of investing in the ETFs. Morningstar bears no liability with respect to the ETFs or any securities.
Effective December 15, 2023, the carbon risk rating screen was removed from the Morningstar® US Sustainability Moat Focus Index. Effective December 17, 2021, the Morningstar® Wide Moat Focus IndexTM was replaced with the Morningstar® US Sustainability Moat Focus Index. Effective June 20, 2016, Morningstar implemented several changes to the Morningstar® Wide Moat Focus Index construction rules. Among other changes, the index increased its constituent count from 20 stocks to at least 40 stocks and modified its rebalance and reconstitution methodology. These changes may result in more diversified exposure, lower turnover, and longer holding periods for index constituents than under the rules in effect prior to that date.
NYSE Arca Gold Miners Index is a service mark of ICE Data Indices, LLC or its affiliates (“ICE Data”) and has been licensed for use by VanEck UCITSETF plc (the “Fund”) in connection with the ETF. Neither the Fund nor the ETF is sponsored, endorsed, sold or promoted by ICE Data. ICE Data makes no representations or warranties regarding the Fund or the ETF or the ability of the NYSE Arca Gold Miners Index to track general stock market performance. ICE DATA MAKES NO EXPRESS OR IMPLIED WARRANTIES, AND HEREBY EXPRESSLY DISCLAIMS ALL WARRANTIES OF MERCHANTABILITY OR FITNESS FOR A PARTICULAR PURPOSE WITH RESPECT TO THE NYSE ARCA GOLD MINERS INDEX OR ANY DATA INCLUDED THEREIN. IN NO EVENT SHALL ICE DATA HAVE ANY LIABILITY FOR ANY SPECIAL, PUNITIVE, INDIRECT, OR CONSEQUENTIAL DAMAGES (INCLUDING LOST PROFITS), EVEN IF NOTIFIED OF THE POSSIBILITY OF SUCH DAMAGES. ICE Data Indices, LLC and its affiliates (“ICE Data”) indices and related information, the name “ICE Data”, and related trademarks, are intellectual property licensed from ICE Data, and may not be copied, used, or distributed without ICE Data’s prior written approval. The Fund has not been passed on as to its legality or suitability, and is not regulated, issued, endorsed’ sold, guaranteed, or promoted by ICE Data.
It is not possible to invest directly in an index.
Investing is subject to risk, including the possible loss of principal. Investors must buy and sell units of the UCITS on the secondary market via an intermediary (e.g. a broker) and cannot usually be sold directly back to the UCITS. Brokerage fees may incur. The buying price may exceed, or the selling price may be lower than the current net asset value. The indicative net asset value (iNAV) of the UCITS is available on Bloomberg. The Management Company may terminate the marketing of the UCITS in one or more jurisdictions. The summary of the investor rights is available in English at: complaints-procedure.pdf (vaneck.com). For any unfamiliar technical terms, please refer to ETF Glossary | VanEck.
No part of this material may be reproduced in any form, or referred to in any other publication, without express written permission of VanEck.
BBVA Acción Eurostoxx 50 ETF FI Cotizado Armonizado (BBVAE ETF) med ISIN ES0105321030, strävar efter att spåra EURO STOXX® 50-index. EURO STOXX® 50-indexet följer de 50 största företagen i euroområdet.
Den börshandlade fondens TER (total cost ratio) uppgår till 0,20 % p.a. ETFen replikerar resultatet av det underliggande indexet genom full replikering (köper alla indexbeståndsdelar). Utdelningarna i ETFen delas ut till investerarna (halvårsvis).
BBVA Acción Eurostoxx 50 ETF FI Cotizado Armonizado har tillgångar på 133 miljoner euro under förvaltning. Denna ETF lanserades den 3 oktober 2006 och har sin hemvist i Spanien.
Beskrivning BBVA Acción Eurostoxx 50 ETF FI Cotizado Armonizado
Med BBVA Acción Eurostoxx 50 ETF FI Cotizado Armonizado deltar investerare i ökningen av värdet på aktierna i de 50 största konglomeraten i euroområdet (euroområdet). Euro Stoxx 50-indexet inkluderar aktier från 8 länder i euroområdet: Belgien, Finland, Frankrike, Tyskland, Irland, Italien, Nederländerna och Spanien.
Explore Dogecoin’s impact on crypto, turning internet memes into cultural and financial assets.
𝕋𝕚𝕞𝕖 ℂ𝕠𝕕𝕖𝕤:
00:00 – Intro
00:27 – Where do Memes come from?
03:13 – What are some of the first Memes you remember?
10:28 – Do these things have value?
14:04 – The different types of cryptocurrencies
17:20 – How did Dogecoin start?
24:26 – What is some of the utility?
28:36 – How does it fit into the portfolio?
30:38 – Final thoughts
Research Newsletter
Each week the 21Shares Research team will publish our data-driven insights into the crypto asset world through this newsletter. Please direct any comments, questions, and words of feedback to research@21shares.com
Disclaimer
The information provided does not constitute a prospectus or other offering material and does not contain or constitute an offer to sell or a solicitation of any offer to buy securities in any jurisdiction. Some of the information published herein may contain forward-looking statements. Readers are cautioned that any such forward-looking statements are not guarantees of future performance and involve risks and uncertainties and that actual results may differ materially from those in the forward-looking statements as a result of various factors. The information contained herein may not be considered as economic, legal, tax or other advice and users are cautioned to base investment decisions or other decisions solely on the content hereof.
Pingback: Sydkoreansk ETF kan vara ett verktyg för att satsa inför en won intervention - ETF-marknaden