Följ oss

Nyheter

Accessing the US Energy Revolution

Publicerad

den

Master Limited Partnerships (MLPs) have delivered a growth in their quarterly distributions since 2014 at an average coverage ratio of 1.25 in their latest quarterly results in Mar 2016 allaying concerns of distributions cuts by MLPs. (Source: Bloomberg, Individual MLP websites)

Key points Accessing the US Energy Revolution

  • Master Limited Partnerships (MLPs) have delivered a growth in their quarterly distributions since 2014 at an average coverage ratio of 1.25 in their latest quarterly results in Mar 2016 allaying concerns of distributions cuts by MLPs. (Source: Bloomberg, Individual MLP websites)
  • The sustainability of the revenue stream of MLPs when compared to oil companies amidst the backdrop of volatile oil prices, highlights that MLPs would have offered a more resilient exposure to the energy sector.
  • On analysing Distribution Coverage and EV/EBITDA, we believe MLPs offer an attractive value proposition.
  • MLPs recent price performance is as a result of negative sentiment transpiring from equity markets and oil price volatility, evidenced by rising correlation 0.85 and 0.63 respectively. (Source: Bloomberg, ETF Securities) [correlation of monthly returns over 5 years]
  • TICKER: MLPI LN Accessing the US Energy Revolution

Valuation

  • 2016 expected distribution yield is 7.14% (Source: Bloomberg, ETF Securities)
  • The majority of MLPs in our index have a distribution coverage above 1 which supports the case for sufficient cash flows available to pay distributions.
  • Weighted average distribution paid in Q4 2015 have risen on average by 15% over the prior quarter despite the heightened concerns on the sustainability of distributions. In comparison the funds available for distribution have increased by 25% leaving a margin of 10% as a cushion for future distributions.
  • Historically we have witnessed MLPs increase debt levels during periods of favourable valuation. However in 2014, despite valuations EV/EBITDA reaching their peaks, MLPs have not raised debt as aggressively as done in the past rendering them in a stronger balance sheet position.
ETFS1

(Click to enlarge) Source: Bloomberg, ETF Securities, Company websites

ETFS2

(Click to enlarge) Source: Bloomberg, ETF Securities
(Based on current basket historical data to mitigate survivorship bias)

ETFS3

(Click to enlarge) Source: Bloomberg, ETF Securities
(Based on current basket historical data to mitigate survivorship bias)

Performance

  • Solactive continues to outperform its peers due to midstream focus and equal weighting methodology
  • Solactive has outperformed crude oil over the past 5 years
  • MLPs offer an inflation hedge due their long-term contracts which are regulated by the Federal Energy Regulatory Commission (FERC) and adjust to inflation annually (PPI), as well as distributions which adjust upwards according to changes in the CPI
ETFS4

(Click to enlarge) Source: ETF Securities, Bloomberg. The Solactive US Energy Infrastructure MLP Index is based on simulated data from 25 January 2011 to 4 March 2014 and actual data from 5 March 2014 to 31 March 2016.

ETFS5

(Click to enlarge) Source: ETF Securities, Bloomberg. The Solactive US Energy Infrastructure MLP Index is based on simulated data from 25 January 2011 to 4 March 2014 and actual data from 5 March 2014 to 31 March 2016.

ETFS6

(Click to enlarge) Source: ETF Securities, Bloomberg. The Yorkville MLP Infrastructure Universe Index TR is based on simulated data from 31 December 1996 to 15 February 2012 and actual data from 16 February 2012 to 31 March 2016.

Index recomposition March 2016

•         Following the index recomposition, the representation of General Partner (GPs) has increased from 7% to 17%.
•         Possible reasons:
o   Undervaluation – GPs had the largest 6-month drawdown (June 15 – Jan 16) which has meant a higher expected future distribution yield.
o   Alignment of interests – Owning GPs better align investors with management as most GPs own a stake (usually 2%) in their underlying LPs.
o   Incentive distribution rights (IDRs) – GPs hold IDRs which entitle them to an increasing share of the total distribution released by the LP to its unitholders (in spite of a mere 2% ownership). As LPs increase their distribution to unitholders, the GP’s distribution increases proportionally much faster, in accordance with a pre-set IDR schedule. At the highest tier of the IDR schedule, a GP – through its IDR ownership – may be receiving up to 50% of equivalent cash distributions made to LP unitholders. This is known as IDR leverage. Thus IDRs have the power to significantly enhance the cash distribution profile of GPs.  (IDRs  are explained below)
•         BAML Equity Research data shows that GPs have underperformed LPs on a total return basis but outperformed LPs on a cash distribution growth basis.

ETFS7

(Click to enlarge) Source: BAML Equity Research

ETFS8

(Click to enlarge) Source: Bloomberg, ETF Securities
(as at 17 April 2016)

Takeaways

  • The average distribution coverage across the index is 1.25 which is comfortably above 1 and reflects sufficient cash flow to meet cash distributions
  • The expected 2016 distribution yield is 7.14% backed by healthy fundamentals and oil price-resilient revenues (i.e. good cash flow)
  • MLPs offer a good inflation hedge with distributions often outpacing the Consumer Price Index (CPI) and pipeline contracts that adjust for inflation annually (Producer Price Index = PPI)
  • Funds for distribution are trading at a 10% premium to distributions paid so we may expect IDRs to gain value and give momentum to GP price performance

Important information

This communication has been provided by ETF Securities (UK) Limited (“ETFS UK”) which is authorised and regulated by the United Kingdom Financial Conduct Authority (the “FCA”).

This communication is only targeted at qualified or professional investors.
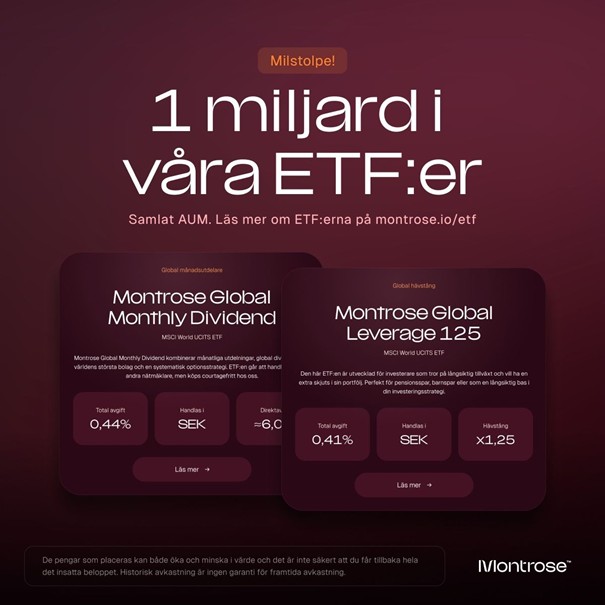
Fortsätt läsa
Annons
Klicka för att kommentera

Skriv en kommentar

Din e-postadress kommer inte publiceras. Obligatoriska fält är märkta *

Nyheter

Crypto Market Compass 6 May 2024

Publicerad

den

Crypto Market Compass 6 May 2024 Bitcoin reverses sharply from oversold levels following the dovish FOMC meeting last week

• Bitcoin reverses sharply from oversold levels following the dovish FOMC meeting last week

• Our in-house “Cryptoasset Sentiment Indicator” has rebounded sharply from very bearish levels and currently signals neutral sentiment again

• Crypto hedge fund’s beta implies that crypto hedge funds have significantly increased their market exposure to Bitcoin from underweight to neutral levels over the past week

Chart of the Week

Performance

Last week, cryptoassets rebounded from very oversold levels as macro sentiment and risk appetite improved following the latest FOMC meeting.

More specifically, the Fed has started tapering its Quantitative Tightening by announcing that the limit of US Treasury bond redemptions will be reduced from 60 bn USD per month to 25 bn USD per month starting in June. The market interpreted this announcement as a signal that the Fed is inching closer towards an eventual monetary policy easing cycle.

The reversal in overall risk appetite was further supported by weak US labour market data that were released last Friday. Non-farm payroll growth came in well below consensus expectations and the US unemployment rate remained at cycle highs.

This increased the probability of looser monetary policy by the Fed which is bullish for cryptoassets.

As a result, Bitcoin rebounded sharply from very oversold levels in crypto sentiment.

We had already indicated that further downside was limited due to the very bearish levels in the Cryptoasset Sentiment Index .

Since then, we saw a very sharp reversal in crypto hedge fund’s beta that implies crypto hedge funds have on aggregate significantly increased their market exposure from underweight to neutral levels over the past week (Chart-of-the-Week).
Besides, there was also a sharp increase in whale BTC balances over the past week as well.

All in all, this implies that institutional investors seem to have bought the recent dip in cryptoassets.

Meanwhile, overall ETP fund flows into cryptoassets still remained relatively weak over the past week. A bright spot were the new Hong Kong spot Bitcoin and Ethereum ETFs that had a combined net inflow of around +224.1 mn USD last week. However, this was not enough to offset negative ETP flows in other jurisdictions, predominantly in the US.

In general, among the top 10 crypto assets, Avalanche, Toncoin, and Dogecoin were the relative outperformers.

However, overall altcoin outperformance vis-à-vis Bitcoin remained relatively low, with only around 45% of our tracked altcoins managing to outperform Bitcoin on a weekly basis.

Sentiment

Our in-house “Cryptoasset Sentiment Index” has rebounded sharply from very oversold levels. The index is currently signalling neutral sentiment again.

At the moment, 8 out of 15 indicators are above their short-term trend.

Last week, there were significant reversals to the upside crypto hedge fund’s beta to Bitcoin and global crypto ETP fund flows.

The Crypto Fear & Greed Index signals ”Greed” again as of this morning. It had shortly dropped to “Fear” levels last week.

Performance dispersion among cryptoassets has continued to decline amid the recent reversal in cryptoassets. Overall performance dispersion among cryptoassets remains relatively low.

Altcoin outperformance vis-à-vis Bitcoin was only moderate, with around 45% of our tracked altcoins that have outperformed Bitcoin on a weekly basis. At the same time, there was a slight underperformance of Ethereum vis-à-vis Bitcoin last week.

In general, increasing (decreasing) altcoin outperformance tends to be a sign of increasing (decreasing) risk appetite within cryptoasset markets.

Meanwhile, sentiment in traditional financial markets has not yet rebounded, judging by our own measure of Cross Asset Risk Appetite (CARA).

Fund Flows

Last week, we saw continued net outflows from global crypto ETPs with around -372.4 mn USD (week ending Friday) based on Bloomberg data.

A bright spot were the new Hong Kong spot Bitcoin and Ethereum ETFs that had a combined net inflow of around +224.1 mn USD last week according to data provided by Bloomberg. However, this was not enough to offset negative ETP flows in other jurisdictions, predominantly in the US.

Global Bitcoin ETPs continued to see net outflows of -409.1 mn USD of which -433.0 mn (net) were related to US spot Bitcoin ETFs alone. The newly issued Hong Kong spot Bitcoin ETFs were able to attract +156.2 mn USD in net inflows last week according to data provided by Bloomberg.

The ETC Group Physical Bitcoin ETP (BTCE) also saw net outflows equivalent to -15.2 mn USD last week.

The Grayscale Bitcoin Trust (GBTC) continued to experience net outflows of approximately -277.2 mn USD last week. That being said, last week Friday saw the very first daily net inflow into GBTC since its conversion to an ETF in January of around +63.0 mn USD which is a positive sign.

In contrast to Bitcoin ETPs, Global Ethereum ETPs saw a reversal in ETP flows last week, with net inflows of around +25.2 mn USD. This was mostly due to significant inflows into the newly issued Hong Kong spot Ethereum ETFs that were able to attract +67.9 mn USD last week, according to data provided by Bloomberg.

Meanwhile, the ETC Group Physical Ethereum ETP (ZETH) saw small net outflows (-0.9 mn USD). The ETC Group Ethereum Staking ETP (ET32) had neither share creations nor redemptions (+/- 0 mn USD) last week.

Besides, Altcoin ETPs ex Ethereum AuM’s were mostly stable last week with only minor net inflows of around +0.9 mn USD.

Besides, Thematic & basket crypto ETPs also experienced some net inflows of +10.6 mn USD, based on our calculations. The ETC Group MSCI Digital Assets Select 20 ETP (DA20) did experience neither in- nor outflows last week (+/- 0 mn USD).

Besides, the beta of global crypto hedge funds to Bitcoin over the last 20 trading rebounded sharply to around 0.97. This implies that global crypto hedge funds have significantly increased their market exposure and have currently a neutral exposure to Bitcoin.

On-Chain Data

Bitcoin’s on-chain data have continued to improve over the past week.

Short-term holders of bitcoin generally took losses as we declined below their costs basis at round 58k USD. So, there was a capitulation by short-term investors as the short-term holder spent output profit ratio (STH SOPR) reached the lowest level since March 2023. This tends to be a reliable signal for a short-term tactical bottom and also coincided with a generally very bearish sentiment.

Moreover, the increase in accumulation activity in Bitcoin that we had already observed the week prior has continued last week as well which put a floor below prices. What is more is that accumulation activity has even broadened to include larger wallet cohorts. Both very small and very large wallet cohorts currently seem to increase their wallet balances again judging by our own “average accumulation score”.

The average accumulation score aggregates individual accumulation scores across different wallet cohorts and shows the average balance growth across these different wallet cohorts.

The fact that larger wallet cohorts have started increasing their accumulation activity is also supported by the fact that wallets in excess of 100 BTC have significantly increased their purchases in the short term.

This is also corroborated by the fact that BTC whale net exchange flows have turned negative again over the past week with more outbound than inbound whale transfers from/to exchanges.

That being said, active addresses remain relatively weak and have declined towards year-to-date lows again. However, our own measure of overall Bitcoin network activity which includes active addresses, transaction count, UTXO count and block size remains near all-time highs.

Besides, Bitcoin’s hash rate still remains near all-time highs as miners still remain relatively unaffected by the recent halving of the block subsidy. BTC miners transfers to exchanges remain very low and overall miner balances are currently still moving sideways implying no significant selling by miners.

Overall, capitulation by short-term holders as well as broadening accumulation activity are a positive signal.

Futures, Options & Perpetuals

Last week, futures open interest continued to move sideways in BTC-terms and perpetual BTC futures only experienced a slight increase in open interest.

Despite the most recent price correction last week there were no significant futures long liquidations either. That being said, the BTC perpetual funding rate turned negative last week on Thursday and Friday which indicates oversold positioning and which tends to be a reliable signal for a short-term tactical bottom as well.

The Bitcoin futures basis mostly went sideways last week. It declined to new cycle lows during the latest price correction before reversing to around 9.3% p.a. again.

Bitcoin options’ open interest increased only slightly last week as BTC option traders seem to have increased their exposure to puts relative to calls. This was also evident in a short-term spike in relative put volumes.

Consistent with this observation, the 25-delta BTC 1-month option skew increased to levels last seen in January during the volatile US spot Bitcoin ETF trading launch.

Despite the dip to new lows in price, BTC option implied volatilities have only increased slightly. Implied volatilities of 1-month ATM Bitcoin options are currently at around 56.4% p.a., up from 54% p.a. the week prior.

Bottom Line

• Bitcoin reverses sharply from oversold levels following the dovish FOMC meeting last week

• Our in-house “Cryptoasset Sentiment Indicator” has rebounded sharply from very bearish levels and currently signals neutral sentiment again

• Crypto hedge fund’s beta implies that crypto hedge funds have significantly increased their market exposure to Bitcoin from underweight to neutral levels over the past week

To read our Crypto Market Compass in full, please click the button below

This is not investment advice. Capital at risk. Read the full disclaimer

Fortsätt läsa

Nyheter

EDM6 ETF investerar i europeiska aktier med fokus på ESG

Publicerad

den

iShares MSCI Europe ESG Enhanced UCITS ETF EUR (Acc) (EDM6 ETF) investerar i aktier med fokus Social/Environmental, Europe. Utdelningarna i fonden återinvesteras (ackumulerar).

iShares MSCI Europe ESG Enhanced UCITS ETF EUR (Acc) (EDM6 ETF) investerar i aktier med fokus Social/Environmental, Europe. Utdelningarna i fonden återinvesteras (ackumulerar).

Den totala kostnadskvoten uppgår till 0,12 % p.a. Fonden replikerar resultatet för det underliggande indexet genom att köpa ett urval av de mest relevanta indexbeståndsdelarna (samplingsteknik). iShares MSCI Europe ESG Enhanced UCITS ETF EUR (Acc) är en stor ETF med tillgångar på 765 miljoner GBP under förvaltning. EDM6 ETF är äldre än 3 år och har sin hemvist i Irland.

Varför EDM6?

Syftar till att ge exponering mot en portfölj av europeiska aktiepapper som är en del av MSCI Europe Index och syftar till att överträffa dekarbonisering och andra minimistandarder för ett EU Climate Transition Benchmark (CTB) och maximera exponeringen mot emittenter med högre ESG-betyg.

Utesluter företag som är inblandade i kontroversiella, konventionella och kärnvapen, civila skjutvapen, termiskt kol, tobak eller okonventionell olja och gas. Företag som klassificeras som att bryta mot FN:s Global Compact-principer, har en ”Röd” MSCI ESG Controversies-poäng eller inte har bedömts av indexleverantören för en ESG-kontroverspoäng eller en ESG-betyg.

Fonden använder sig av en klassens bästa syn på hållbara investeringar, vilket innebär att det förväntas att fonden kommer att investera i de bästa emittenterna ur ett ESG-perspektiv, baserat på indexets ESG-kriterier.

Investeringsmål

Fonden strävar efter att uppnå avkastning på din investering, genom en kombination av kapitaltillväxt och inkomst på fondens tillgångar, vilket återspeglar avkastningen från MSCI Europe ESG Enhanced Focus CTB Index, fondens jämförelseindex.

Investeringsstrategi

MSCI Europe ESG Enhanced Focus-index spårar de största företagen från Europa. Indexet är utformat för att maximera exponeringen för positiva miljö-, sociala och styrningsfaktorer (ESG) och samtidigt minska koldioxidekvivalentexponeringen för koldioxid (CO2) och andra växthusgaser (GHG) samt minimera deras exponering för potentiella utsläppsrisker från fossila bränslereserver.

Handla EDM6 ETF

iShares MSCI Europe ESG Enhanced UCITS ETF EUR (Acc) (EDM6 ETF) är en europeisk börshandlad fond. Denna fond handlas på flera olika börser, till exempel Borsa Italiana och Deutsche Boerse Xetra. Av den anledningen förekommer olika kortnamn på samma börshandlade fond.

Det betyder att det går att handla andelar i denna ETF genom de flesta svenska banker och Internetmäklare, till exempel DEGIRONordnet, Aktieinvest och Avanza.

Börsnoteringar

BörsValutaKortnamn
gettexEUREDM6
Borsa ItalianaEURESEG
SIX Swiss ExchangeEUREDM6
XETRAEUREDM6

Största innehav

KortnamnNamnSektorVikt (%)ISINValuta
NESNNESTLE SAConsumer Staples3.81CH0038863350CHF
ASMLASML HOLDING NVInformation Technology3.02NL0010273215EUR
ROGROCHE HOLDING PAR AGHealth Care2.50CH0012032048CHF
AZNASTRAZENECA PLCHealth Care2.48GB0009895292GBP
NOVO BNOVO NORDISK CLASS BHealth Care2.32DK0060534915DKK
DGEDIAGEO PLCConsumer Staples2.28GB0002374006GBP
GSKGSKHealth Care1.58GB0009252882GBP
HSBAHSBC HOLDINGS PLCFinancials1.55GB0005405286GBP
TTETOTALENERGIESEnergy1.51FR0000120271EUR
SAPSAPInformation Technology1.50DE0007164600EUR

Innehav kan komma att förändras

Fortsätt läsa

Nyheter

J.P. Morgans första rapport om globala familjekontor: Trender och utmaningar

Publicerad

den

J.P. Morgans Private Bank har precis släppt sin första rapport om globala familjekontor, vilket erbjuder en insyn i hur ultrarika familjer hanterar investeringar, styrning, successionsplanering och drift av familjekontor. Med data från över 190 familjekontor över hela världen ger rapporten en inblick i dagens och morgondagens ekonomiska landskap.

J.P. Morgans Private Bank har precis släppt sin första rapport om globala familjekontor, vilket erbjuder en insyn i hur ultrarika familjer hanterar investeringar, styrning, successionsplanering och drift av familjekontor. Med data från över 190 familjekontor över hela världen ger rapporten en inblick i dagens och morgondagens ekonomiska landskap.

Investeringstrender: Rapporten visar en tydlig förskjutning mot alternativa investeringar, med en genomsnittlig tilldelning på 45% till sådana tillgångar, där privatkapital dominerar. Hur påverkar detta långsiktiga avkastningsmål?

Cybersäkerhetsutmaningar: Nästan en fjärdedel av familjekontoren har drabbats av cybersäkerhetsintrång eller finansiellt bedrägeri. Trots detta har bara en av fem infört åtgärder för cybersäkerhet. Vad kan göras för att stärka dessa vitala skydd?

Kostnads- och personalhantering: Med stigande driftkostnader och en kamp om att behålla toppkompetens, hur balanserar familjekontor effektivitet och expertis?

Förberedelser för nästa generation: Nästan 30% av de tillfrågade saknar en strukturerad metod för att förbereda den yngre generationen för arvsansvar. Vilka strategier används regionalt för att engagera och utbilda framtida arvtagare?

Hela rapporten hittar du här.

Fortsätt läsa

Populära