
Nyheter
2015 From Cyclical to Structural

China Macro Monitor 2015 From Cyclical to Structural. After half a year of spectacular equity market performance to some the clouds of slowing economic growth cast doubt on China’s ability to maintain the rally.
However, that view over-emphasises the correlation between GDP performance and equity market performance. The link between economic and equity market performance has never been straight-forward. Indeed, China may follow a path similar to Japan, South Korea and Taiwan during their early stages of development. That indicates that equity market performance will accelerate during periods of financial market liberalisation rather than periods of strong economic growth.
A number of exogenous events may also prove to be supportive for both China’s domestic equity market and China’s role in the global economy. MSCI is due to evaluate the inclusion of China A-Shares in its Emerging Markets Index this June. The IMF is also due to conduct its five-yearly Special Drawing Rights (SDR) basket review this October. Renminbi inclusion discussions could become a catalyst for significant currency market liberalisation and a seismic shift in the role of the Chinese currency in international trade and finance.
We expect reform to remain the focus of policy makers’ agenda this year, with lower economic growth an acceptable by-product of stability. The authorities are unlikely to let growth fall substantially lower however, as that could stoke political unrest and undo the hard work of the reform agenda. We expect some policy easing, primarily in the form of lower interest rates and a reduction the Reserve Requirement Ratio in coming months.

A ROCKY PATH TO STABILITY
Although Chinese GDP growth of 7.4% in 2014 surpassed consensus expectations, it was the lowest reading in 24 years. The outlook for growth is lower still in 2015. Both the World Bank and IMF have downgraded their 2015 China growth forecasts to below 7%t this month. The message from policy makers in China is that sub-7% growth is acceptable, so long as its reform agenda continues apace.
Over the next decade China’s growth model will migrate away from cheap-currency dependent mercantilism and China will become increasingly more capitalist. Market forces will help the allocation of resources1 and the legal framework will be strengthened to improve quality of China’s institutional infrastructure2.
Transition will inevitably involve winners and losers, but society as a whole is likely to benefit from the new model. China will be careful not to move too quickly and aggravate political instability. With that in mind, it is likely that China will stimulate the economy further in 2015 to avoid a marked slowdown, especially in light of a faltering Euro area dampening global demand their good and services.
In spite of economic growth deceleration in H2 2014, the domestic equity market rallied 58%3. That is not unusual and the experiences of Japan, South Korea and Taiwan in their transition paths in earlier decades highlight that this is what we should expect. For example in Japan during the 1960s, a period of financial repression, the stock market underperformed relative to the overall economy. However in the 1980s when economic growth was subdued relative its past, the stock market performed particularly well in an environment of financial market liberalisation. South Korea and Taiwan experienced similar bouts of equity market outperformance during periods of financial market liberalisation, which countered the underperformance during earlier periods of financial repression and relatively stronger growth.

We believe China’s equity market underformance in recent years prior to the opening up of the Hong Kong-Shanghai Connect initiative in November 2014 was a symptom of a lack of market access. The Connect initiative significantly opened up market access. The fact that volumes traded on the Connect have not met expectations is irrelevant. The market has priced Shanghai stocks as internationally accessible now. The eventual opening of a Shenzhen Exchange link4 will give further access to Chinese domestic stocks, which will also become priced-in at some point.
We are likely to see equity market volatility rise. While structural shifts will move the equity market higher, periodic disappointment over growth figures are likely to lead to frequent corrections. This tug-of-war between the structural and cyclical drivers of the market will continue to divide analysts and see volatility remain high. Investors attracted to the recent rally should recognise the need for a significant degree of risk tolerance to weather rising market volatility.
In 2014, it was clear that Chinese equities were cheap by international standards. That is no longer the case. The MSCI China A-Share P/E is now close to the MSCI World P/E. P/Es in 2009 were undesirably high (it was a period of earnings weakness and price optimism in light of policy easing) and so should not be treated as a benchmark for where equity markets should go back to. Trading China on cheapness should be a thing of the past. Investing in China is once again about buying into structural change.

THE GLOBAL STAGE AWAITS
A number of events this year could prove to be a catalyst for further capital market deepening in China.
Firstly in June, MSCI will reconsider whether to include domestic Chinese equities into its emerging markets index. With approximately US$1.5tn benchmarked to MSCI China Emerging Markets Index, even a small allocation of 0.5% to the China A-Share market in the broader index could drive US$7.5bn into the market on the back of index replication by investors.
As a point of reference, the MSCI United Arab Emirates Net TR USD index rose over 90% between the time MSCI announced UAE stocks would enter its Emerging Market Index and actual inclusion (see shaded area of chart). While the Chinese and UAE markets are vastly different in size and composition, we believe the increasing probability of index inclusion will bode well for China A-Shares.

Secondly, in October the International Monetary Fund will review which currencies it will include in its Special Drawing Rights (SDR) currency basket. The SDR is an international reserve asset, created by the IMF in 1969 to supplement its member countries’ official reserves. Its value is based on a basket of four key international currencies, and SDRs can be exchanged for freely usable currencies. If the Renminbi is included in the basket, central banks buying/selling SDRs will have to deliver/receive Renminbi (in proportion to its weight in the basket).
In its last review in 2010 the IMF decided not to widen the currencies in the basket. At the time the IMF noted that China was the third largest exporter of goods and services but felt that the Renminbi was not a freely useable currency. However, they urged that this issue be kept under review. Since then, the Chinese Yuan has become the fifth most used payment currency according to SWIFT5, jumping from seventh position only a year earlier. The Renminbi became the ninth most actively traded currency according to the Bank of International Settlement’s 2013 triennial survey, jumping from 17th position in 2010. Over that period average daily turnover soared from US$34bn in 2010 to US$120bn in 2013.

Significant expansion in RMB offshore clearing centres around the world has helped fuel this trend and access to the currency has never been easier. In 2014, the Yuan-HK Dollar convertibility cap was abolished in recognition of the demand for Renminbi (timed with the opening of the Hong Kong-Shanghai Stock Connect initiative).
While capital and exchange rate controls will continue to hold back the Renminbi from SDR inclusion, we believe the IMF’s review this year will facilitate a road-map for further internationalisation of the currency. With the internationalisation of the Renminbi a stated policy objective we believe that the Chinese authorities will continue to dismantle controls on the currency.
With the Yuan trading very close to the edge of its trading band (see chart on front page), we could see further flexibility in the trading band this year. The recent depreciation against the US Dollar seems to be more about the strength of the US dollar than Yuan weakness, with the nominal effective rate actually having appreciated in December. Indeed there has been no increase in foreign exchange reserves that would occur if the authorities were intervening to depreciate the currency.

POLICY EASING IN 2015
With consumer price inflation weakening and property prices continuing to fall, we expect the Peoples Bank of China (PBoC) to cut interest rates further this year. We also expect the central bank to cut the Reserve Requirement Ratio (the amount of reserves banks need to hold with the central bank), thus improving banks’ ability to lend.
The transition away from shadow banks to the formal banking sector will continue in 2015, increasing pressure on the PBoC to provide liquidity support to banks. On January 22nd the PBoC injected CNY50bn into the banking system through the 7-day repo market. That was one of the many injections the central bank has provided in the past six months (see page 10 for other examples) and we expect the PBoC to maintain a strong hand on facilitating the transition in the financial sector.

1 “The focus of the restructuring of the economic system… is to allow the market [forces] to play a ‘decisive role’ in the allocation of resources”, Third Plenum Communiqué, November 2013
2 ”Comprehensively advancing the rule of law”, Fourth Plenum Communiqué, October 2014
3 MSCI China A-Share, between 30 June 2014 and 31 December 2014
4 Although no formal announcement has been made, Premier Li Keqiang has openly encouraged the opening of an Shenzhen link
5 December 2014
Important Information
This communication has been provided by ETF Securities (UK) Limited (”ETFS UK”) which is authorised and regulated by the United Kingdom Financial Conduct Authority. When being made within Italy, this communication is for the exclusive use of the ”qualified investors” and its circulation among the public is prohibited.


During and after the US market close on Friday, cryptocurrency markets experienced their largest liquidation event on record, with an estimated USD 19 billion in leveraged positions unwound across futures and perpetual swap markets.
What Happened
The selloff began following President Trump’s announcement of an additional 100% tariff on Chinese imports, a move that triggered a sharp risk-off reaction across global markets. U.S. equities had their worst session since April, and with traditional markets closed for the weekend, crypto became the only major market still open for price discovery.
Nearly 90% of liquidations were long positions, underscoring how leveraged bullish sentiment had become across digital assets.
By asset:
• Bitcoin (BTC) saw over $5 billion in positions liquidated, falling roughly 12.5% intraday, from highs of ~$122,600 to lows near $107,000.
• Ethereum (ETH) recorded around $4 billion in liquidations, declining more than 20% from $4,400 to ~$3,500.
• Solana (SOL) experienced $1.8 billion in liquidations and dropped as much as 22% before recovering some ground.
While Bitcoin’s percentage price decline is in line with historical shocks, and only took the price back to where it was two weeks ago, it was a three-standard deviation move vs the past three years during which the asset saw broader institutional adoption. Moreover, the episode represents the largest forced liquidation event in crypto’s history in both size and concentration of long positions.
Liquidity Dynamics: The Perfect Storm
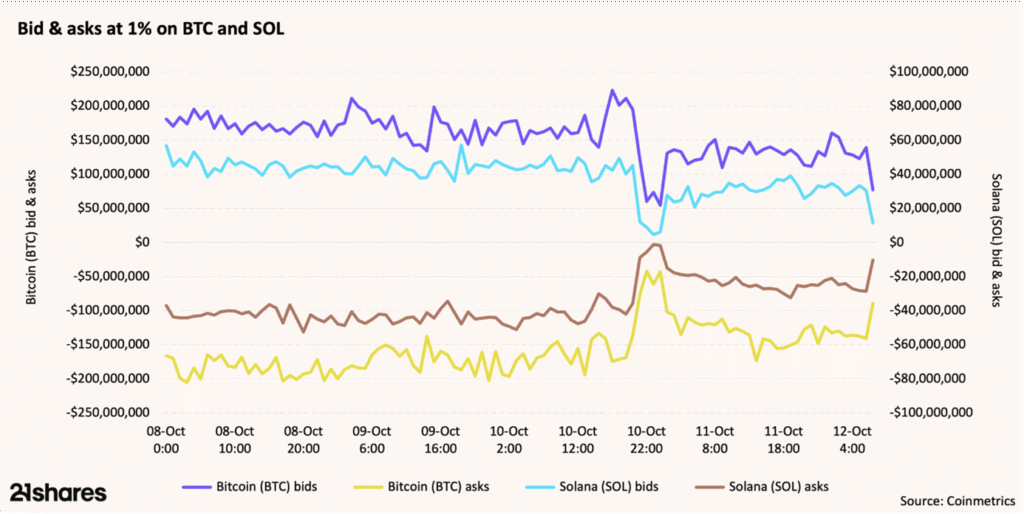
The scale of the move was amplified by fragile liquidity across both spot and derivatives markets. Order books were thin heading into the weekend, leaving markets especially vulnerable to shocks.
The timing compounded the impact:
• The announcement hit just after the U.S. cash equity close and before a long weekend (Columbus Day), when liquidity naturally declines.
• With most global asset classes offline, crypto became the only outlet for risk repricing.
• As liquidity thinned, automated liquidations triggered a domino effect across exchanges.
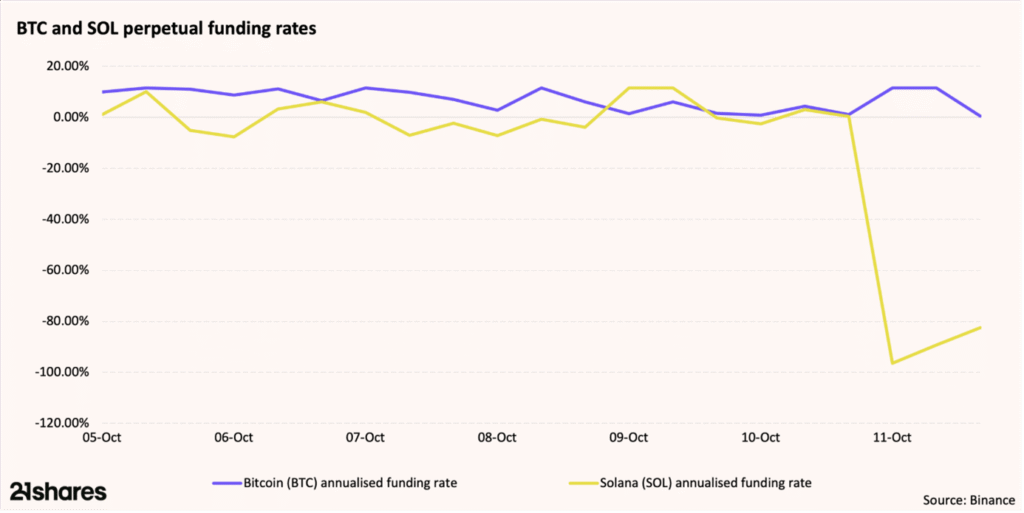
Funding rates flipped sharply negative—particularly in Solana—signaling an abrupt pivot from leveraged longs to short positioning. In some altcoins, liquidity deteriorated so severely that price wicks reached near-zero levels before stabilizing.
Complicating matters, several major exchanges experienced infrastructure strain as trading volumes surged over 140% to ~$180 billion in a matter of hours. APIs froze, oracles glitched, and order books briefly went dark. This led to mispriced liquidations and system-wide stress, highlighting again that crypto’s operational fragility often lies not in blockchains themselves, but in the centralized trading infrastructure that sits around them.
What We’re Hearing from the Market
Market participants describe Friday’s events as a systemic deleveraging that caught even sophisticated funds off guard. Several leveraged traders and funds reportedly suffered heavy losses, and rumors persist of at least one major market maker being forced to unwind positions.
Some internal exchange estimates suggest total liquidations—including unreported DeFi exposures—could approach USD 30 billion once weekend trading is fully accounted for.
Volatility spiked dramatically, with Bitcoin implied volatility reaching levels not seen since the FTX collapse. While unsettling, such spikes are often short-lived and tend to normalize as market depth recovers.
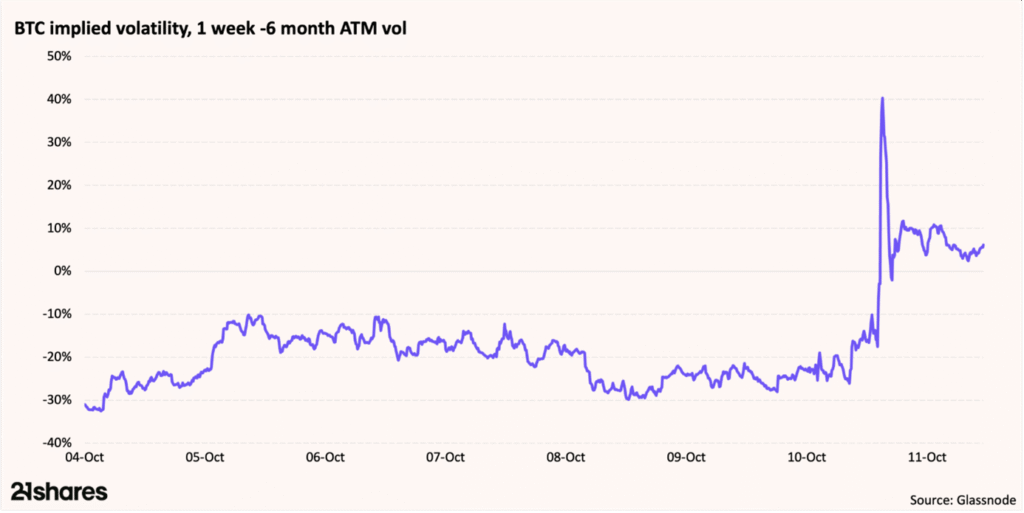
Source: Glassnode
Looking Ahead
Despite the record size of liquidations, the price impact was moderate by historical standards, with Bitcoin’s drawdown smaller than those seen during prior major deleveraging events. Markets had been trading at all-time highs just days earlier, so a correction of this magnitude is not entirely unexpected.
So far, crypto markets appear to be stabilizing, though volumes remain light and sentiment cautious.
Key areas we’re watching in the near term include:
• Asian equity and futures markets as they reopen Monday, which may influence crypto sentiment.
• CME futures basis and funding rates as indicators of capital flows and arbitrage activity.
• Ethereum staking queues, which could become further stretched if the selloff continues.
Historically, large-scale liquidation events have been followed by periods of consolidation lasting one to two months before recovery. The previous two major liquidation cycles saw drawdowns of 19–24% over ~60 days, with full recovery typically taking three to five months.
Currently, Bitcoin funding rates remain within normal ranges, suggesting arbitrage desks continue to operate efficiently. However, with Solana’s funding still deeply negative, we could see a short squeeze if sentiment turns and liquidity returns.
Our View
While last week’s events highlight ongoing structural fragilities—particularly in leverage and centralized infrastructure—they also demonstrate that core blockchain networks remained resilient throughout.
For investors, this underscores the value of crypto exposure via regulated, physically backed ETPs over leveraged trading venues, where forced liquidations and operational risks can amplify volatility.
Overall, we view the selloff as a healthy, if painful, reset of speculative excess. As macro uncertainty persists, disciplined position sizing and diversification across regulated products remain key.
Research Newsletter
Each week the 21Shares Research team will publish our data-driven insights into the crypto asset world through this newsletter. Please direct any comments, questions, and words of feedback to research@21shares.com
Disclaimer
The information provided does not constitute a prospectus or other offering material and does not contain or constitute an offer to sell or a solicitation of any offer to buy securities in any jurisdiction. Some of the information published herein may contain forward-looking statements. Readers are cautioned that any such forward-looking statements are not guarantees of future performance and involve risks and uncertainties and that actual results may differ materially from those in the forward-looking statements as a result of various factors. The information contained herein may not be considered as economic, legal, tax or other advice and users are cautioned to base investment decisions or other decisions solely on the content hereof.


Crypto market update: record liquidations amid tariff shock

Hur investera i Blockchain med hjälp av börshandlade fonder

XTMT ETF ger exponering mot aktier från Taiwan

Handla WisdomTrees ETFer utan courtage hos SAVR

XDPU ETF – Levler S&P 500 by Xtrackers

HANetf och Infrastructure Capital Advisors samarbetar för att lansera aktivt förvaltad preferensavkastnings-ETF i Europa

IN0A ETF spårar S&P 500 med fokus på företag med höga ESG-betyg

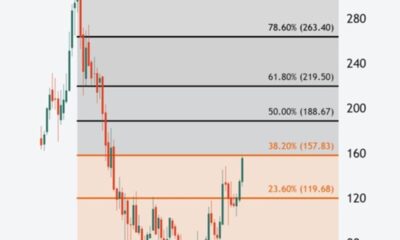
Vägen tillbaka till rekordnivåer är kantad av Fibonacci-motståndsnivåer

YSLV ETP ställer ut köpoptioner på silver för att skapa en löpande avkastning

De bästa lågvolatilitets ETFer på marknaden
-
 Nyheter3 veckor sedan
HANetf och Infrastructure Capital Advisors samarbetar för att lansera aktivt förvaltad preferensavkastnings-ETF i Europa
-
 Nyheter4 veckor sedan
IN0A ETF spårar S&P 500 med fokus på företag med höga ESG-betyg
-
 Nyheter4 veckor sedan
Vägen tillbaka till rekordnivåer är kantad av Fibonacci-motståndsnivåer
-
 Nyheter4 veckor sedan
YSLV ETP ställer ut köpoptioner på silver för att skapa en löpande avkastning
-
 Nyheter3 veckor sedan
De bästa lågvolatilitets ETFer på marknaden
-

 Nyheter4 veckor sedan
PLTY ETP utfärdar optioner mot aktier i Palantir
-

 Nyheter4 veckor sedan
Time in Bitcoin beats timing Bitcoin
-

 Nyheter4 veckor sedan
Investera i NEAR med en börshandlad produkt