
Nyheter
Why the gold price rally may continue
We often write about the different market developments that can impact the returns of gold within investor portfolios. The primary factors that we consider are:
• Policy of the US Federal Reserve (Fed)
• Consumer Price Index (CPI) measures of inflation
• Behaviour of the US Dollar
• Levels of interest rates—particularly the US 10-Year Treasury Note
• Gold futures speculative positioning
While we believe that these are among the most important factors that explain movements in the gold price, we couldn’t say that they are the sole determinants as to why the price moves. Technical factors, such as the ratios of gold to US equities, gold to US government bonds, and gold to the US Dollar are also certainly worth considering. Below, we look at these ratios and explore the implications for the gold price.
Gold technicals: the gold price to US equities ratio
Since the end of 2009, there have been two dominant trends within the relationship between the price of gold and US equities, as shown through the performance of the S&P 500.
• From 31 December 2009 to 22 August 2011, the price of gold appreciated by nearly 40% annualised while the S&P 500 only gained about 1% per year
• From 22 August 2011 to 8 February 2019, the S&P 500 gained about 14% per year, while the price of gold lost nearly 5% per year
At the risk of stating the obvious, US equities have been the star performers at the expense of most other asset classes since 2011, gold included. But we’d note that in Figure 1, which shows the ratio of the gold price to the S&P 500, we see a falling wedge pattern. The performance of US equities was strong enough recently to push the line—designed such that it declines when US equities are outperforming gold—outside the lower boundary of the falling wedge. This move was short-lived, and technicians have noted that when moves like this fail to establish a trend, the reverse move may occur quite quickly. This suggests that gold could potentially outperform US equities in the near term.
Figure 1: The relationship between gold and US equities may be changing

Source: Bloomberg, with period from 31 December 2009 to 8 February 2019. Concept for chart from blog post by JC Parets on 6 February 2019. Historical performance is not an indication of future performance and any investments may go down in value. You cannot invest directly in an index.
Gold technicals: the gold price to long-maturity US government bonds ratio
One of the big debates among investors today is in relation to where US interest rates—particularly long-term US interest rates—may go to from current levels. From the early 1980s to the present, the trend has clearly been down, leading to massive price appreciation for bond investors. Now, however, with interest rates near historic lows, many hypothesise that the next 10 or 20 years could look very different to the last 30 to 40 years.
In Figure 2, we show the ratio of longer-dated US government bond cumulative returns against the price of gold, using the ICE US Treasury 20+ Year Index as a measure of the returns from US government bonds. The chart shows:
• From 2004 to 2011, the price of gold outperformed longer-maturity US government bonds, resulting in an upward trend in the ratio
• From 2011 to about 2014, longer-maturity US government bonds outperformed gold, resulting in a downward trend in the ratio
• From 2014 onwards, we have observed a strong multi-year basing process, and it looks like the price of gold is again starting to outperform long-maturity US government bonds
While this ratio cannot guarantee that the price of gold will outperform longer-maturity US government bonds going forward, we think that the ratio is an interesting way to consider a longer-term historical context and relationship between the two assets.
Figure 2: Gold may be poised to outperform US government bonds

Source: Bloomberg, with period from 31 December 2004 to 8 February 2019. Concept for chart from blog post by JC Parets on 6 February 2019. Historical performance is not an indication of future performance and any investments may go down in value. You cannot invest directly in an index.
Gold technicals: major trends in the relationship between the US Dollar and the gold price
Gold (and many other commodities) is priced in US Dollars, leading to a natural tendency of the price of gold to rise as the value of the US Dollar falls. Figure 3 indicates that since the late 1960s, the US Dollar has had four regimes of significant depreciation. It is clear that the price of gold responded during these periods by moving significantly higher.
On the right-hand side of Figure 3, we indicate that a pattern has developed recently that looks similar to patterns that we have seen in the past prior to a big US Dollar move down and a subsequent upward move in the price of gold. While this pattern is by no means a guarantee of future performance, we do believe that analysing the long-term relationship between the US Dollar and gold is helpful in stepping outside the minute-by-minute, hour-by-hour, and day-by-day short-term analysis that the world has become accustomed to.
Figure 3: The US Dollar versus gold price relationship since the late 1960s

Source: Bloomberg. Periods of the US dollar are defined as Sept. 1969 to June 1973 (Period 1), June 1976 to June 1980 (Period 2), December 1984 to December 1987 (Period 3) and June 2001 to March 2008 (Period 4). Periods of the gold price are December 1969 to December 1974 (Period 1), Sept. 1976 to Sept. 1980 (Period 2), December 1984 to December 1987 (Period 3) and March 2001 to Sept. 2012 (Period 4). Concept for chart from blog post by JC Parets on 6 February 2019. Historical performance is not an indication of future performance and any investments may go down in value. You cannot invest directly in an index.
Conclusion: the price of gold may appreciate further
We have written recently that, based on our forecast and internal models as of 31 December 2018, gold’s price could reach $1,370 per troy ounce by 31 December 2019. This forecast was based primarily on fundamental factors, rather than technical factors. However, analysing the three charts above, we believe that gold’s further appreciation could also be supported from a technical perspective.
This material is prepared by WisdomTree and its affiliates and is not intended to be relied upon as a forecast, research or investment advice, and is not a recommendation, offer or solicitation to buy or sell any securities or to adopt any investment strategy. The opinions expressed are as of the date of production and may change as subsequent conditions vary. The information and opinions contained in this material are derived from proprietary and non-proprietary sources. As such, no warranty of accuracy or reliability is given and no responsibility arising in any other way for errors and omissions (including responsibility to any person by reason of negligence) is accepted by WisdomTree, nor any affiliate, nor any of their officers, employees or agents. Reliance upon information in this material is at the sole discretion of the reader. Past performance is not a reliable indicator of future performance.
Important Information
Communications issued in the European Economic Area (“EEA”): This document has been issued and approved by WisdomTree Ireland Limited, which is authorised and regulated by the Central Bank of Ireland.
Communications issued in jurisdictions outside of the EEA: This document has been issued and approved by WisdomTree UK Limited, which is authorised and regulated by the United Kingdom Financial Conduct Authority.
WisdomTree Ireland Limited and WisdomTree UK Limited are each referred to as “WisdomTree” (as applicable). Our Conflicts of Interest Policy and Inventory are available on request.


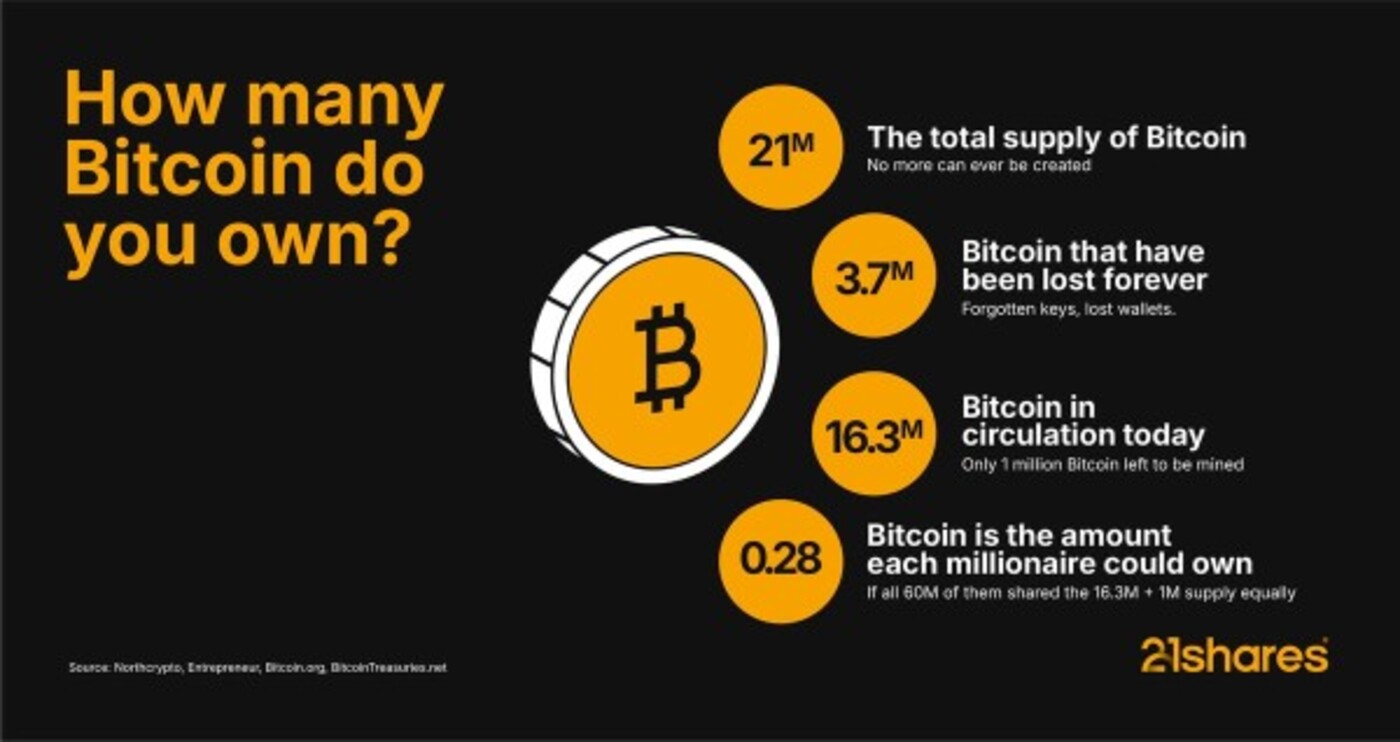
Bitcoin is running out. Literally, out of a total 21 million coins, 3.7 million are lost forever. That leaves only 16.3 million in circulation and just 1 million left to be mined. Imagine 60 million millionaires worldwide fighting for Bitcoin: each could only get 0.28 BTC. The question is simple: do you own any Bitcoin?


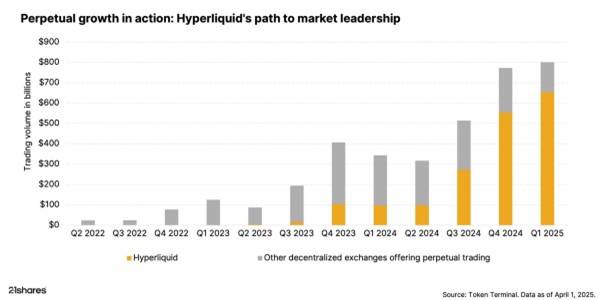
Perps explained: How Hyperliquid and dYdX are powering the next phase of crypto trading
Perpetual futures contracts, or “perps,” let traders speculate on the future price of cryptocurrencies like Bitcoin or Ethereum without actually owning them and without any expiration date. They are rapidly gaining popularity on decentralized exchanges such as Hyperliquid and dYdX, which offer deep liquidity, seamless access, and efficient on-chain trading, making it easier than ever for users to participate in this growing market.


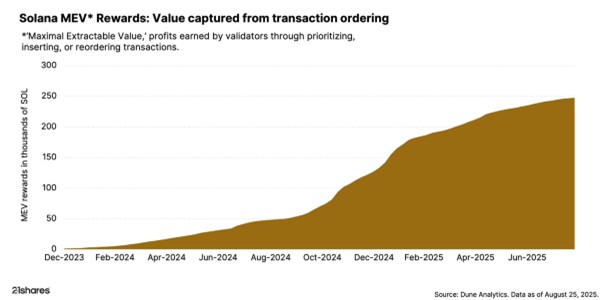
Meet BAM: Solana’s smart traffic controller investors can’t ignore
Think of Solana as a super-fast highway where transactions are cars, but order can get messy. Jito’s BAM acts as a smart traffic controller, organizing transactions efficiently. This major upgrade from Solana’s largest liquid staking provider improves block building, transaction sequencing, and value flow, marking a key milestone for developers, users, and SOL holders.

Research Newsletter
Each week the 21Shares Research team will publish our data-driven insights into the crypto asset world through this newsletter. Please direct any comments, questions, and words of feedback to research@21shares.com
Disclaimer
The information provided does not constitute a prospectus or other offering material and does not contain or constitute an offer to sell or a solicitation of any offer to buy securities in any jurisdiction. Some of the information published herein may contain forward-looking statements. Readers are cautioned that any such forward-looking statements are not guarantees of future performance and involve risks and uncertainties and that actual results may differ materially from those in the forward-looking statements as a result of various factors. The information contained herein may not be considered as economic, legal, tax or other advice and users are cautioned to base investment decisions or other decisions solely on the content hereof.


WisdomTree noterar fond för kvantberäkning på Xetra

Bitcoin is scarce. Will you get your share?

XB32 ETF fokuserar på eurodenominerade företagsobligationer med förfall 2023

Att förstå säljoptionsstrategier

JGOV ETF investerar i statsobligationer från hela världen
Bitcoin likes to dance to its own beat, not to tech stock tunes

BJLX ETF hållbara företagsobligationer med förfall 2032

IncomeShares strategiuppdatering: Kontantsäkrad säljoptioner plus aktie

HANetfs VD kommenterar Trump-Putin-toppmötet

HANetfs analyserar hur ett fredsavtal kan påverka det europeiska försvaret
-

 Nyheter4 veckor sedan
Bitcoin likes to dance to its own beat, not to tech stock tunes
-
 Nyheter4 veckor sedan
BJLX ETF hållbara företagsobligationer med förfall 2032
-
 Nyheter4 veckor sedan
IncomeShares strategiuppdatering: Kontantsäkrad säljoptioner plus aktie
-
 Nyheter3 veckor sedan
HANetfs VD kommenterar Trump-Putin-toppmötet
-
 Nyheter2 veckor sedan
HANetfs analyserar hur ett fredsavtal kan påverka det europeiska försvaret
-

 Nyheter3 veckor sedan
VALOUR ARB SEK spårar priset på kryptovalutan Arbitrum
-

 Nyheter1 vecka sedan
Månadsutdelande ETFer uppdaterad med IncomeShares produkter
-

 Nyheter4 veckor sedan
Palantir har ökat intäkterna varje kvartal