
Nyheter
Transient Weakness in Oil Prices

Transient Weakness in Oil Prices Oil prices fell sharply last week after OPEC decided not to cut production. While members of the oil cartel acknowledged that prices will remain weak unless production is curtailed, OPEC is not willing to bear the burden of such a decision alone.
We remain positive on oil in the long-term, but believe oil prices will remain under pressure until production is reduced.

WTI crude and Brent are now trading over 30% below the US$100/bbl level that is considered a “fair price” by most OPEC producers and that has historically been defended by OPEC. While weak global demand for oil and distillates combined with ample global supply of crude has weighed on both Brent and WTI prices over the past few months, OPEC inaction contributed to push oil prices below US$70/bbl.
Although OPEC resisted calls to cut production last week, highlighting the need for oil prices to find a new equilibrium, we believe the cartel will eventually have to reduce supply to help stabilise global oil prices. The cartel jointly produces approximately 40% of global oil output. While the US is gaining an increasing share of global output (by displacing oil imports through its own production) and Russia remains a formidable player, we believe it is too early to write off OPEC as an irrelevant cartel when it comes to setting global prices.
Key in the decision not to cut production was the split between OPEC and non-OPEC producers. Over the past few years, non- OPEC countries, particularly the US, have seen the majority of the growth in oil production, progressively taking market share away from OPEC countries. With the US not likely to cut its shale production at this stage, OPEC members are unwilling to take the burden alone.
OPEC has historically played a fundamental role in keeping oil prices above US$100/bbl but shale oil might have changed the shape of the industry permanently. Oil productivity and costs vary considerably across different shale formations (see chart opposite), with striking variances within areas of the same formation. While the marginal cost of production of oil as measured by the 90th percentile of the cost curve of the 50 largest oil and gas companies was estimated to be around US$92/bbl in 2011 (see chart on page 2), shale oil has become increasingly cheaper to produce. The IEA reckons 82% of crude oil and condensates production from the United States is still profitable at a price of US$60/bbl or lower
However, the majority of OPEC countries are estimated to require oil prices of at least US$90-US$100/barrel to balance their government budgets. While these countries can run budget deficits, the appetite to do so will wear thin as the cost of financing starts to increase. We believe that last week’s inaction increases the need for large cut at the June 2015 OPEC meeting.

Although price weakness is likely to continue through the first half of 2015, continued growth from the US and China, combined with a reduction in oil supply, will eventually bring the oil market back to balance with prices returning to trade around the US$90/bbl level. In the meanwhile, we deem appropriate to revise down our short/medium-term targets for WTI and Brent from US$105/bbl to US$70/bbl and from US$110/bbl to US$75/bbl as OPEC’s decision of not cutting production will continue to put pressure on prices. Once we start to see production cuts we expect WTI to move towards US$90/bbl and Brent towards US$95/bbl.
IMPORTANT INFORMATION
This communication has been issued and approved for the purpose of section 21 of the Financial Services and Markets Act 2000 by ETF Securities (UK) Limited (“ETFS UK”) which is authorised and regulated by the United Kingdom Financial Conduct Authority (“FCA”).


XTMT ETF ger exponering mot aktier från Taiwan

Handla WisdomTrees ETFer utan courtage hos SAVR

XDPU ETF – Levler S&P 500 by Xtrackers

7MAG ETP genererar löpande avkastning på Magnificent 7

Invesco lanserar aktiv ETF som investerar i amerikanska företag

HANetf och Infrastructure Capital Advisors samarbetar för att lansera aktivt förvaltad preferensavkastnings-ETF i Europa

IN0A ETF spårar S&P 500 med fokus på företag med höga ESG-betyg

Vägen tillbaka till rekordnivåer är kantad av Fibonacci-motståndsnivåer

YSLV ETP ställer ut köpoptioner på silver för att skapa en löpande avkastning

De bästa lågvolatilitets ETFer på marknaden
-
 Nyheter3 veckor sedan
HANetf och Infrastructure Capital Advisors samarbetar för att lansera aktivt förvaltad preferensavkastnings-ETF i Europa
-
 Nyheter4 veckor sedan
IN0A ETF spårar S&P 500 med fokus på företag med höga ESG-betyg
-
 Nyheter4 veckor sedan
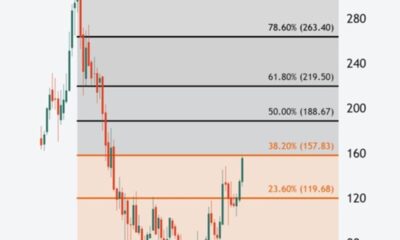
Vägen tillbaka till rekordnivåer är kantad av Fibonacci-motståndsnivåer
-
 Nyheter4 veckor sedan
YSLV ETP ställer ut köpoptioner på silver för att skapa en löpande avkastning
-
 Nyheter3 veckor sedan
De bästa lågvolatilitets ETFer på marknaden
-

 Nyheter4 veckor sedan
PLTY ETP utfärdar optioner mot aktier i Palantir
-

 Nyheter4 veckor sedan
Time in Bitcoin beats timing Bitcoin
-

 Nyheter4 veckor sedan
Investera i NEAR med en börshandlad produkt